
Let’s say you are learning a new options strategy – the bull put credit spread, for example.
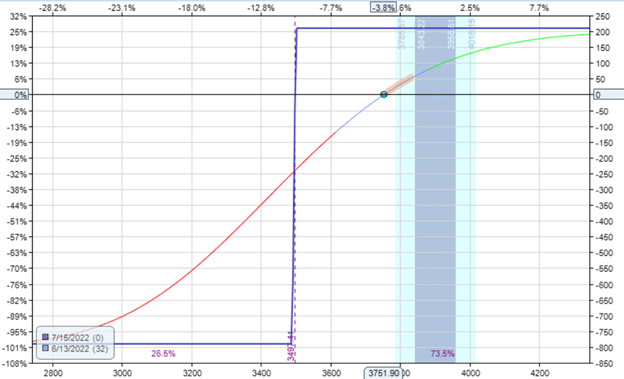
Here is a risk graph to give you a visual:

You can already see from the graph that the trade had an initial credit of $200.
We should define when to take profit and when to stop loss.
For example, say you have decided to take a profit of 50% of the initial credit received.
And you have decided to exit the trade if the loss is twice the credit received.
Your stop loss dollar amount would be $400 in this case.
So, winning trades would give you $100, and losing trades would cost you $400.
For this strategy to be profitable, you need to have four times as many winning trades than losing trades.
That would require a win rate of 80%.
Is that possible?
Is the profit target and stop loss chosen the correct choice?
How are you going to know this if you have never traded this before?
Are you going just to put the trade live with real money and see?
Some traders do, and that’s going to be an easy way for the market to extract money from traders.
This article is written to give you a better way.
Contents
Level 1: Backtesting
A better way is to backtest the strategy first.
Using OptionNet Explorer, the trader can turn back the clock to a particular date and time in the past.
They can then put on a “pretend” trade and step through the trade hour-by-hour or day-by-day.
The software uses historical option prices and shows the P&L of the trade, the Greeks, the candlesticks, and even chart indicators.
Make repeated back-trades hundreds of times across many different market conditions, and you can get a sense of the win rate and whether the take profit level and stop loss level actually work or not.
Hundreds of times?
The more times you do it, the more accurate the statistics will be.
Yes, it is time-consuming.
So, some traders use automated backtesting software, where they input the parameters, and the computer runs hundreds of trades and spits out the results.
That is fine as a start.
However, for traders who need to practice making adjustments, such as rolling the option to different strikes mid-trade based on market conditions or chart indicators or picking entries based on trader discretion, the only way to practice these is to manually back-trade it.
Level 2: Paper Trading
One downside of automated and manual backtesting is that you do not get a sense of the trade happening in real-time.
In the backtest, you can complete a trade in a few minutes.
You may have to sit through the trade for weeks when you take that live.
Not used to the long wait time for profits to come in, you might become impatient, think the trade is not working, exit early, pull the plug on the trade, or commit other such errors in live trading that you might not have made during backtesting.
While practicing back-trading with historical data, you might already know what the market did and subconsciously make adjustment decisions that match the market moves.
So, the next level is forward-testing or paper trading.
You initiate the trade and manage it in near-real time.
This way, you can not know what the market would do next.
The time scale is the same as in live trading.
The only difference is that it uses “paper” money instead of real money.
Some brokers (such as Tradier) have so-called “paper” accounts where you can practice using the trading platform and the strategy.
There is software (such as OptionStrat) where you can save your trade positions and track their P&L.
The problem with relying on these paper trading software features is that many use delayed data.
So, the option prices may be delayed by 15 minutes and not be in sync with the real-time candlestick chart the trader reads.
Even if you find (or pay extra for) a paper trading account that uses live data feed, many of the fill prices of paper accounts are unrealistic.
A trader may put a trade in a paper account at a favorable price, filling it immediately.
Whereas, if they did that in a live trade, it would not fill.
That is because the trade’s execution is computer-simulated and is not subject to the live market factors of supply and demand.
Also, paper trading accounts may not simulate the early assignment of options, which can happen in live trading.
Level Three
The next level is to get real pricing off your trading platform.
Put the trades into your trading platform, but do not hit the submit button.
At least now, you can see the bid and ask price in real-time as it fluctuates.
Wait long enough to get a sense of the mid-price, then account for slippage by giving in a nickel.
Now, you can use that number as the cost basis of your option.
Then, track your P&L in a spreadsheet or other software.
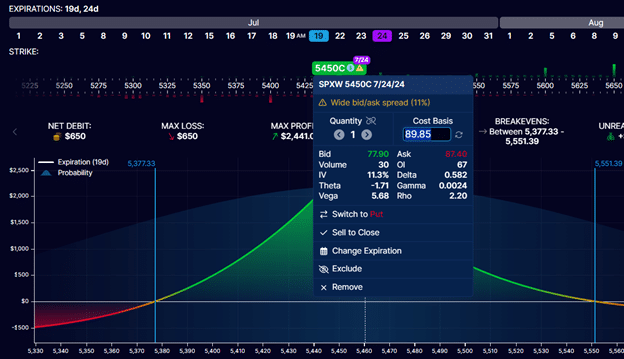
For example, OptionStrat lets you adjust the cost basis of your option and saves your position:

Final Thoughts
Practice trading will reveal any flaws in a trading strategy.
It will inform you under what market conditions the strategy works well and when it doesn’t.
If your strategy uses adjustments, you will learn how to make better adjustments.
The next step is to go live but with a small size.
As much as the three levels of practice trading will help you prepare for live trading, it will never be exactly the same.
It is always different when you have real money on the line.
We hope you enjoyed this article on the three different levels of practice trading.
If you have any questions, please send an email or leave a comment below.
Trade safe!
Disclaimer: The information above is for educational purposes only and should not be treated as investment advice. The strategy presented would not be suitable for investors who are not familiar with exchange traded options. Any readers interested in this strategy should do their own research and seek advice from a licensed financial adviser.


