


Today, we a reviewing an option profit calculator from OptionStrat.
OptionStrat is an online options charting application that you can use on your web browser or download the Android or IOS app.
Contents
- Introduction
- Options Builder
- Graph Of The Option Price
- Option Spreads
- Profit And Loss Table View
- Simulating Implied Volatility (IV)
- Bid/Ask Spread Pricing (IV)
- Save And Share Feature (IV)
- Optimize(IV)
- Flow Summary
- Live Flow
- Prebuilt Filters
- Summary
Introduction
OptionStrat is an excellent addition tool if your trading platform does not offer the ability to chart the payoff graph.
Even if it does, OptionStrat may have more advanced features.
Beginning options investors can use OptionStrat as a learning tool and to paper trade.
The free features of OptionStrat use delayed data.
Paid members will have access to current prices as well as additional features.
Options Builder
Let’s start with a simple long call option strategy in the “Build” tab of the app.
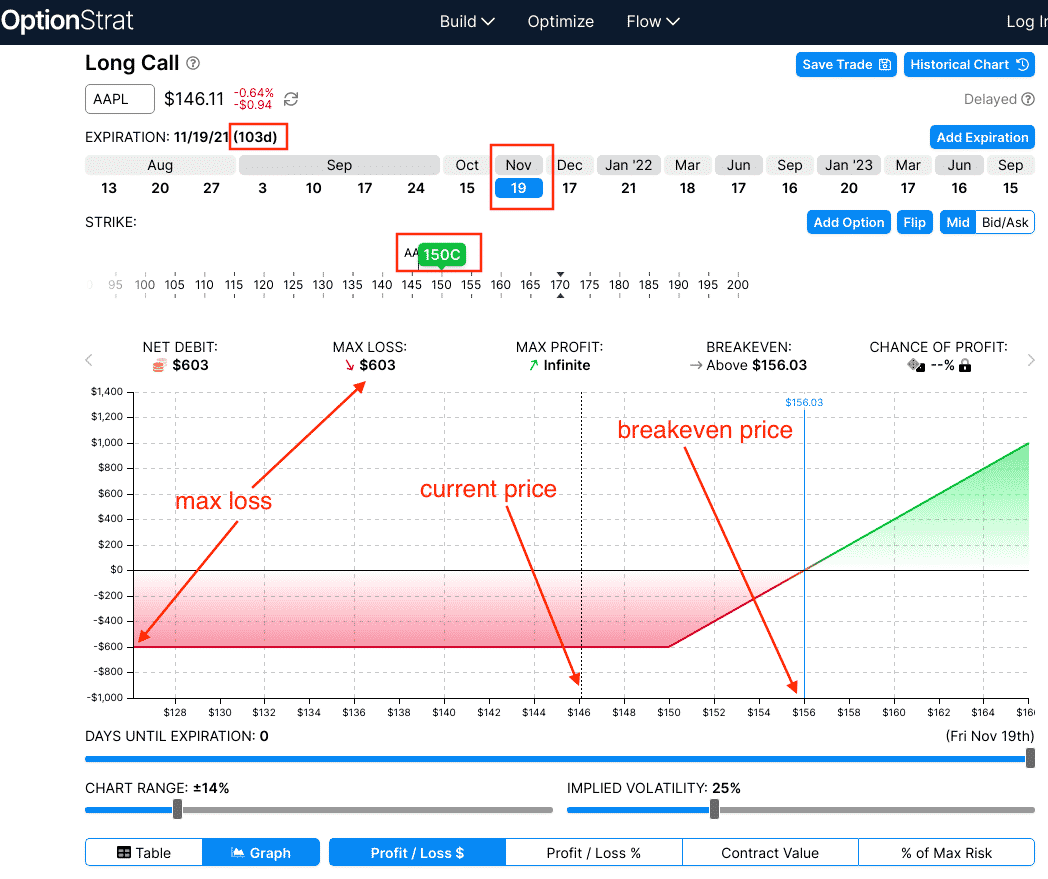
Here I have selected to buy the $150 call on Apple (AAPL) expiring on November 19 that is 103 days away.
If filled at the mid-price, it would have cost me a net debit of $603.
That is also the max loss, as the payoff diagram shows (also known as the profit and loss graph, or risk graph).
The graph is centered at the current AAPL price of $146.
I can zoom in and out on the chart by adjusting the “chart range” slider.
The blue vertical line is the breakeven price of $156 in which AAPL must go up to by expiration for us to profit on the trade.
If AAPL is anywhere above that, we are in the profitable green section.
Otherwise, we would be in the non-profitable red area.
The “chance of profit” is displayed in the header in the paid version
This graph is the “expiration graph” because we currently have the “days until expiration” slider to the right.
But if we plan to take the trade-off three weeks before expiration.
Just set the slider to 21 days to expiration (DTE), and you will see that the breakeven price comes down to $154 (look at the blue verticle, not the header info).
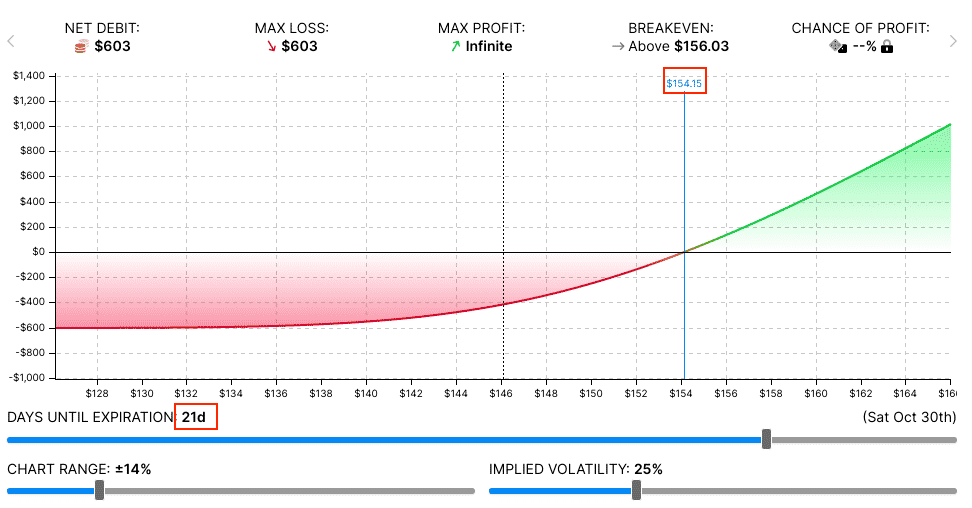
The header information shows the stats assuming if held to expiration.
I can get the Greeks values as of the start of the trade by clicking the arrow on the header.
Below we see that the trade has a negative -3.71 theta, which means that the value of this call loses $3.71 per day, given that all other things remain the same.
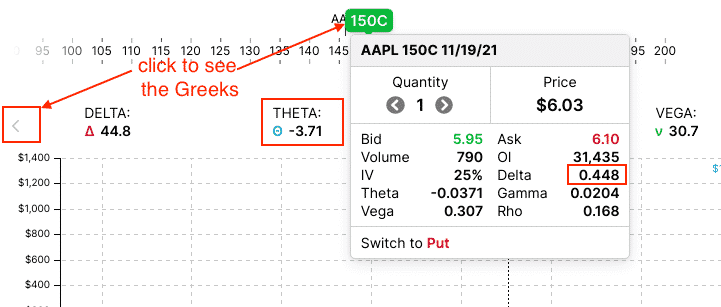
You can also see that the $150 call is at the 44.8 delta of the option chain.
Keep in mind that these Greeks will change as time progress and the price of AAPL moves.
OptionStrat only shows the value at the start of the trade.
If you want to see the profit and loss in percentages, click “profit/loss %” or “% of max risk” tabs.
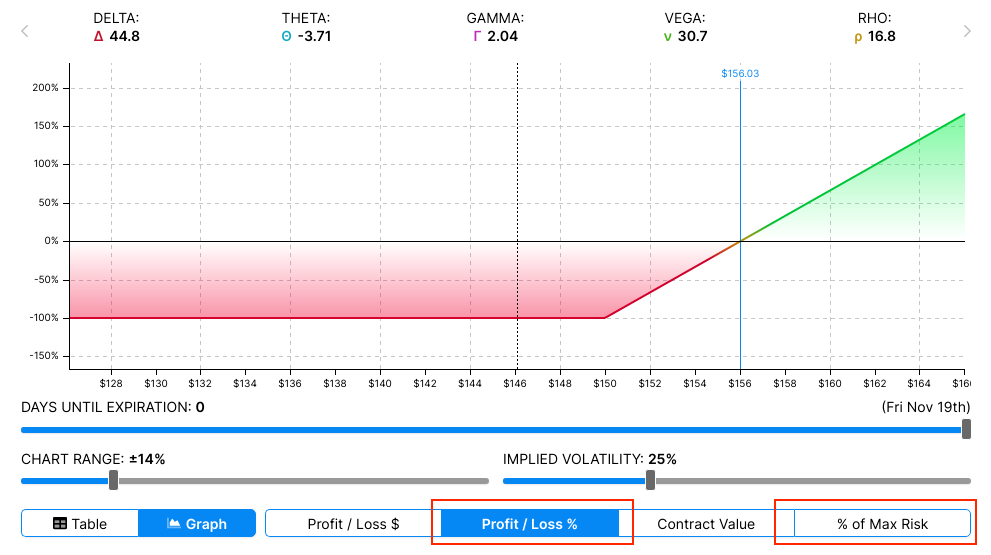
The vertical axis now shows that the max possible loss is 100% of the price we paid for our call option.
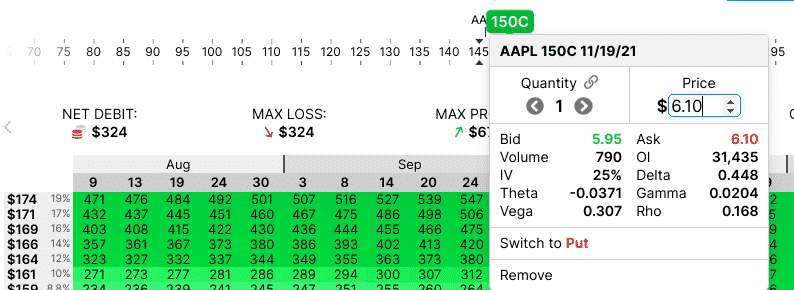
Graph Of The Option Price
A great feature not easily found elsewhere is a graph of the historical value of the long $150 call option.
Click on the “Historical Chart” button.
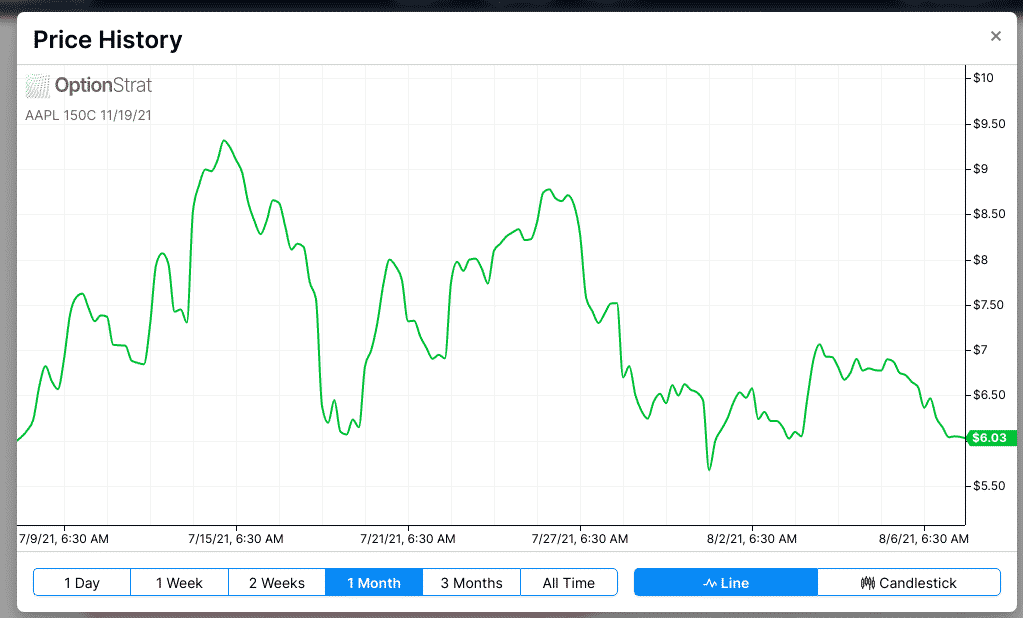
See that the midpoint pricing of the November 19 AAPL $150 call is currently at $6.03.
What is more important to see is whether the graph is falling or rising.
You get historical option pricing data for free, which means you can backtest option strategies.
This tool will chart the value of multi-leg option strategies as well.
For example, simply from looking at the graph, we can see that if we had bought the AAPL 150 call option on July 15 and sold it today on August 9, we would have lost money.
But if we had bought it on July 9 and sold it on July 15, we would have made money.
Option Spreads
Let’s say that instead of a single long call, we want a bull call debit spread.
By clicking on the “Add Option” button, we also short the $160 call (which is at 26.6 delta) with the same expiration as our existing long $150 call to make this into a bull call debit spread.
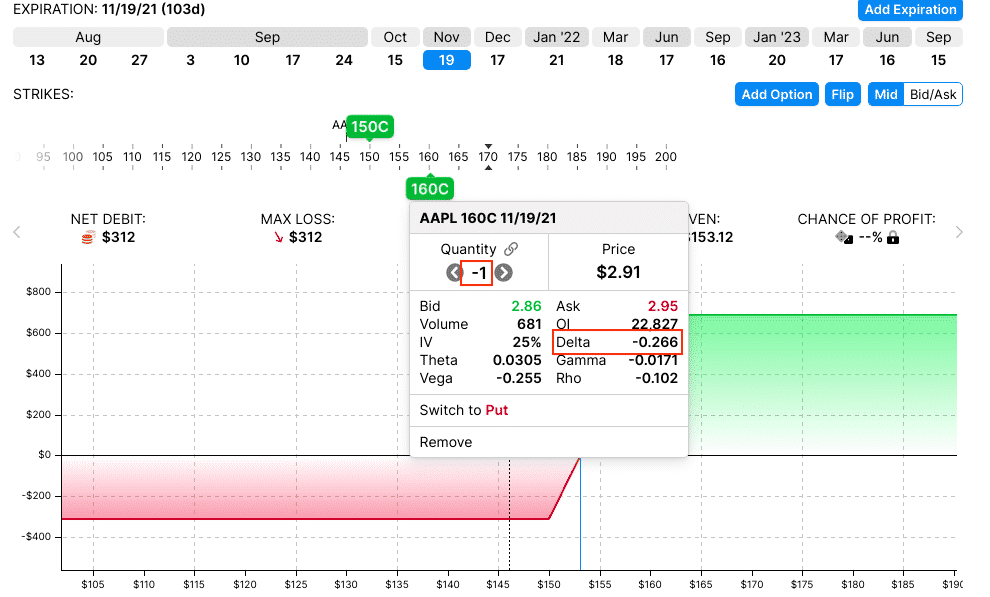
The -1 quantity indicates that we are shorting the option.
We see from that graph that this caps our profits and reduces our max loss down to $312.
The combined Greeks for the spread are only available for paid members.
Non-paid members would have to do the math to come up with the Greeks of the trade spread.
Combined Greeks:
Delta: (44.8) + (-26.6) = 18.2
Theta: (-3.71) + (3.05) = -0.66
We see that the magnitude of our delta and theta decreased; we became less bullish, and we will lose less money from time decay.
We also see that our expiration breakeven decreased down to $153.
This decrease should increase our chance of profit, and paid members would see that this number changes.
If option buyers increase their probability of profit when converting a long option into a spread, in that case, it stands to reason that sellers would decrease their probability of profit when converting a long option trade into a spread trade.
Exercise for the reader: Use the builder to sell a cash-secured put and then compare that with a bull put credit spread.
Compare the breakeven price and determine which has a higher probability of profit.
For setting options at different expirations, it is easiest to select either “calendar” or “diagonal” from the “build” menu and then tweak it from there.
Profit And Loss Table View
With today being August 8, we see from the table view that if AAPL is up 3.3% on September 20, we will make $74.
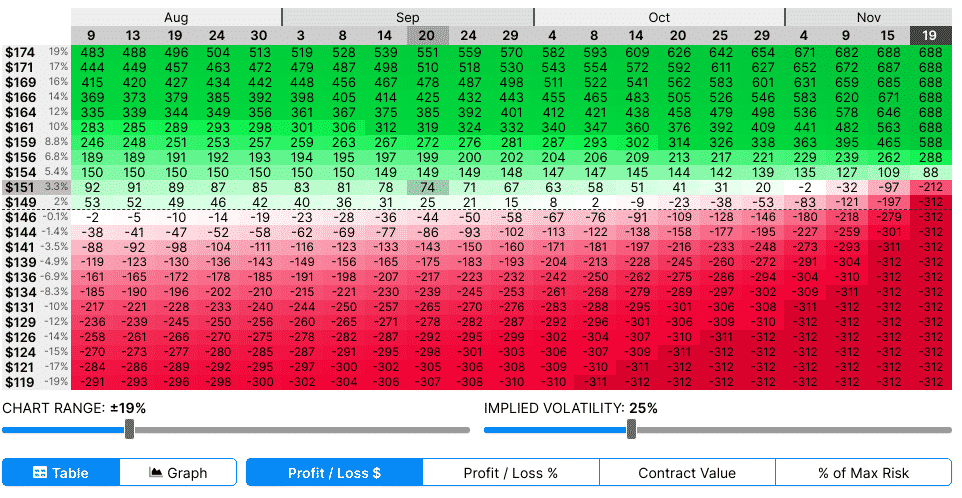
Since we spent $312 for the call debit spread, that would be about a 25% return on investment.
Instead of doing the math yourself, click the “Profit/Loss %” or the “% of Max Risk” tabs.
Now you see how options are naturally leveraged.
Stock investors who make a return of 3.3% on AAPL; option investors will make a 25% return on that same move.
But that goes the other way as well.
Option investors will lose a more significant percentage if the price declines.
Simulating Implied Volatility (IV)
What if implied volatility increases from now to September 20?
Just move the implied volatility slider up and see that our profit would increase to $84.
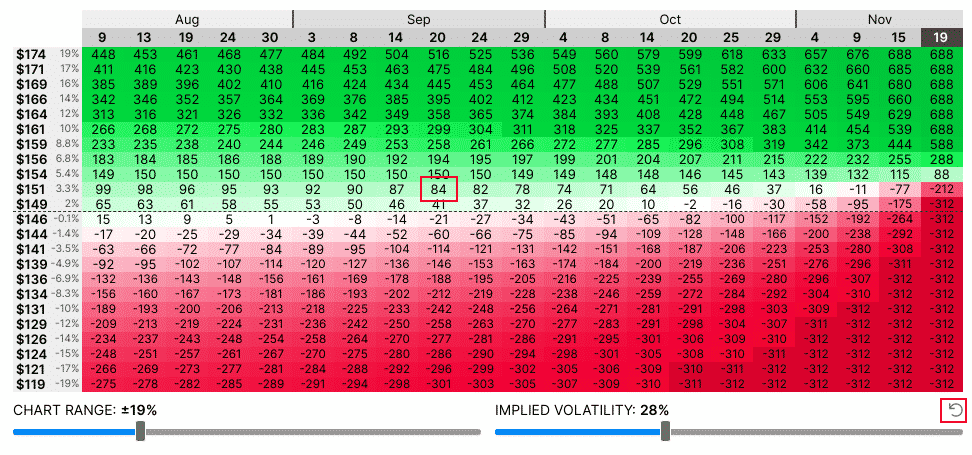
This increase is as expected since this is a slightly positive vega spread.
I’ll click the implied volatility reset icon to bring it back to the way it was.
Bid/Ask Spread Pricing
The numbers in the table assume that you got filled at the midpoint of the bid/ask spread.
While this may be fine for liquid stocks such as AAPL, it may not be so realistic for less liquid stocks. In that case, you might want to click the “Bid/Ask” button.
Now you see that we are down –$14 right from the start.
We lost a little in the bid/ask spread if we did not get filled at the midpoint.
If you had made the trade in your brokerage platform a few days ago, your fill price would have been different, you could set the exact fill price for each option, and OptionStrat will recalculate the profit numbers.
Save And Share Feature
Click the “Save Trade” button to save this trade so that you can check on its returns later.
In this way, you can do paper trading.
You also get a link of the trade you can send to your friends so they can open your trade in OptionStrat and see the graph and everything.
Optimize
Put in a ticker symbol in the optimize tab and select your sentiment.
OptionStrat will show you some strategies.
If you choose “Bullish”, OptionStrat will automatically fill in the “target price” based on the “expected move” of the stock to the expiration date selected.
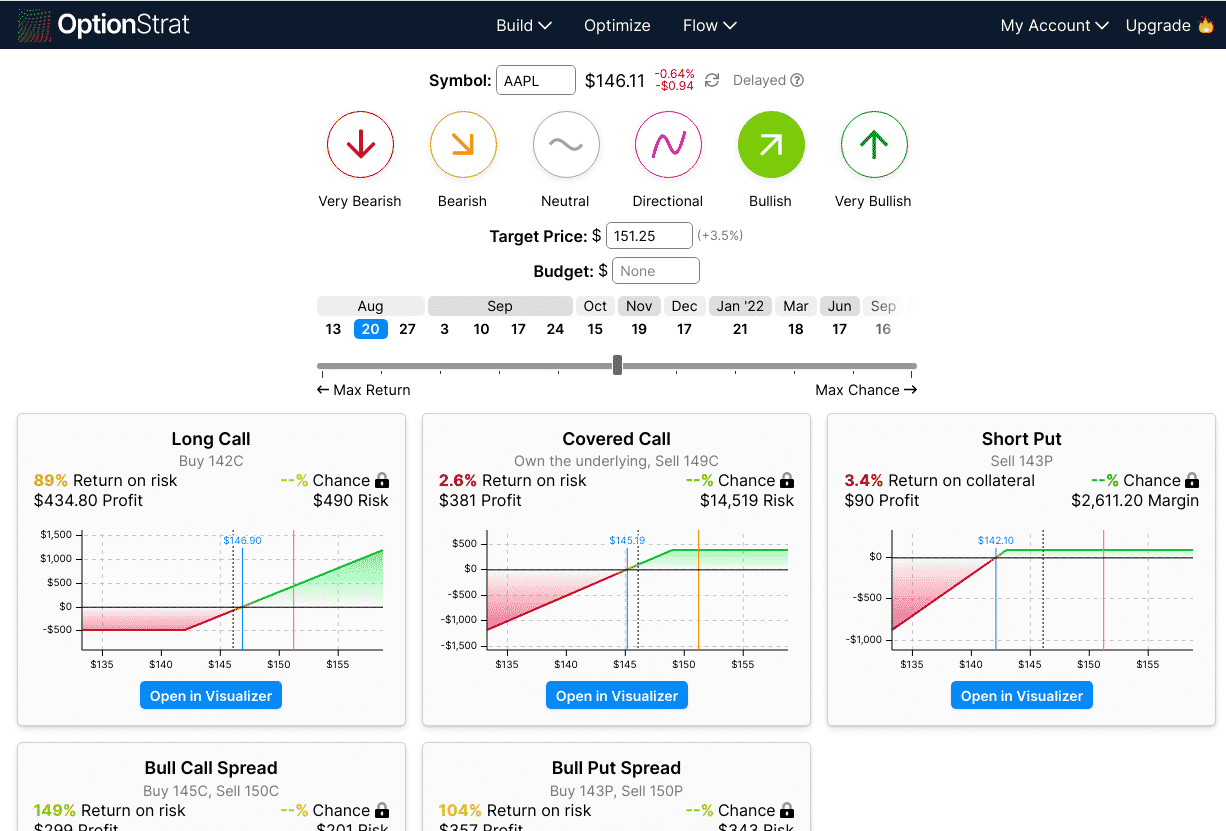
If you change the expiration date, you can see that the target price updates.
Selecting “Very Bullish” will double that target price.
Play with the slider between “max return” and “max chance”, and you can see how the proposed strategy graphs change.
Flow Summary
Get trade ideas from the Flow Summary page.
It scans what the big institutions and “smart money” are trading.
OptionStrat algorithm picks out the significant ones it thinks are most bullish and bearish.
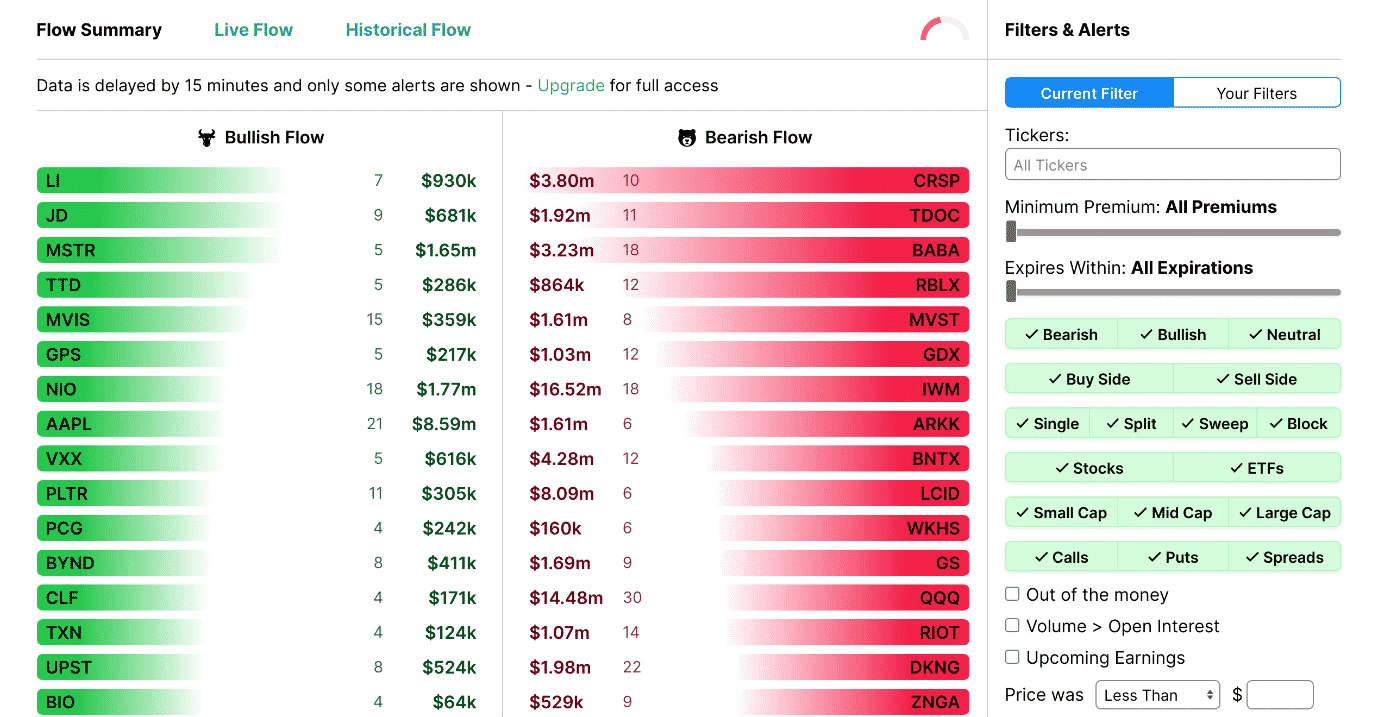
Live Flow
The chart below shows what trades have been bought or sold recently.
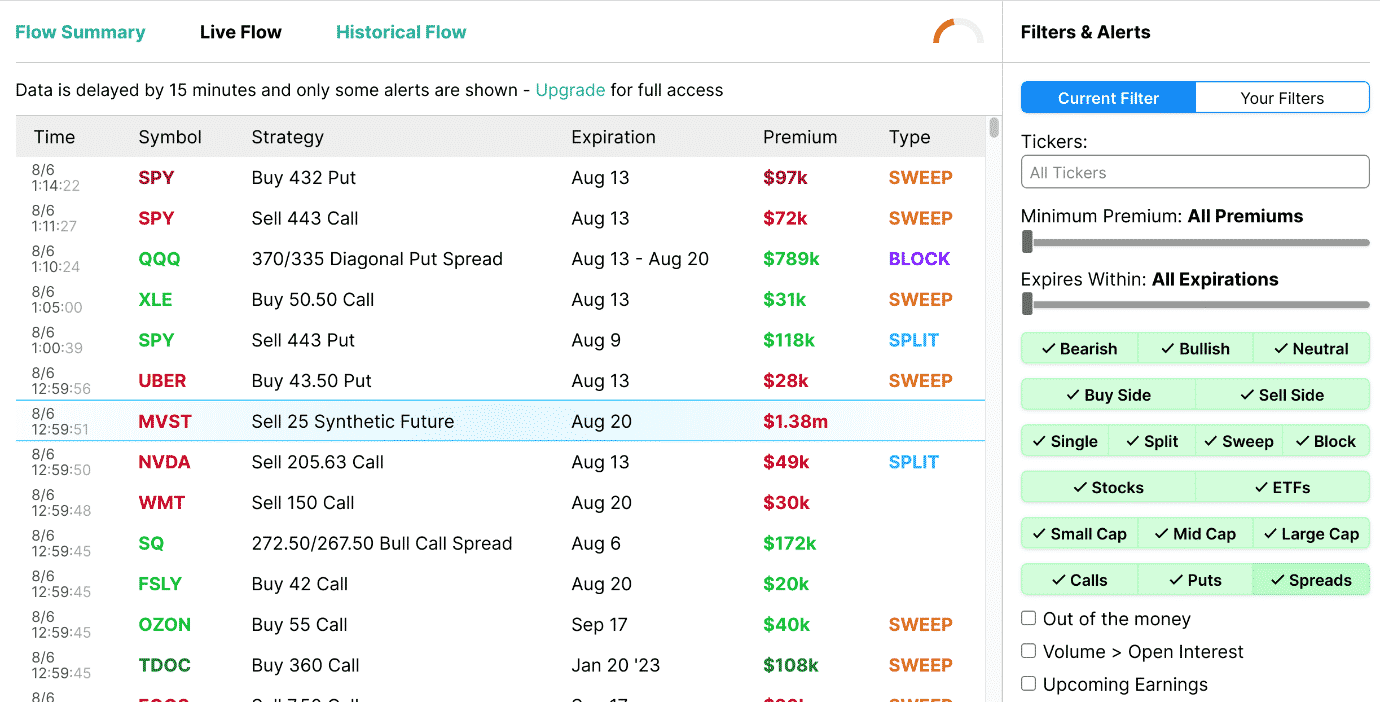
You can filter out ETF if they are cluttering the list.
It is also possible to checkmark “upcoming earnings” if you are interested in earnings plays.
From the size of the premiums, you can see these are the “big money” trading.
It looks like someone bought the $43.50 put on Uber (UBER) expiring in one week.
But wait! When someone buys this call, doesn’t it mean that someone sold this call?
Why is only one side listed?
OptionStrat looks at where the trade was filled in compared to the bid/ask spread and stock price movement to determine whether the buy-side had more urgency in getting into the trade or whether the sell-side.
The color of the ticker being red indicates a bearish sentiment on the stock, which makes sense since this was a purchase of a put.
The person, or institution, thinks UBER price is going down.
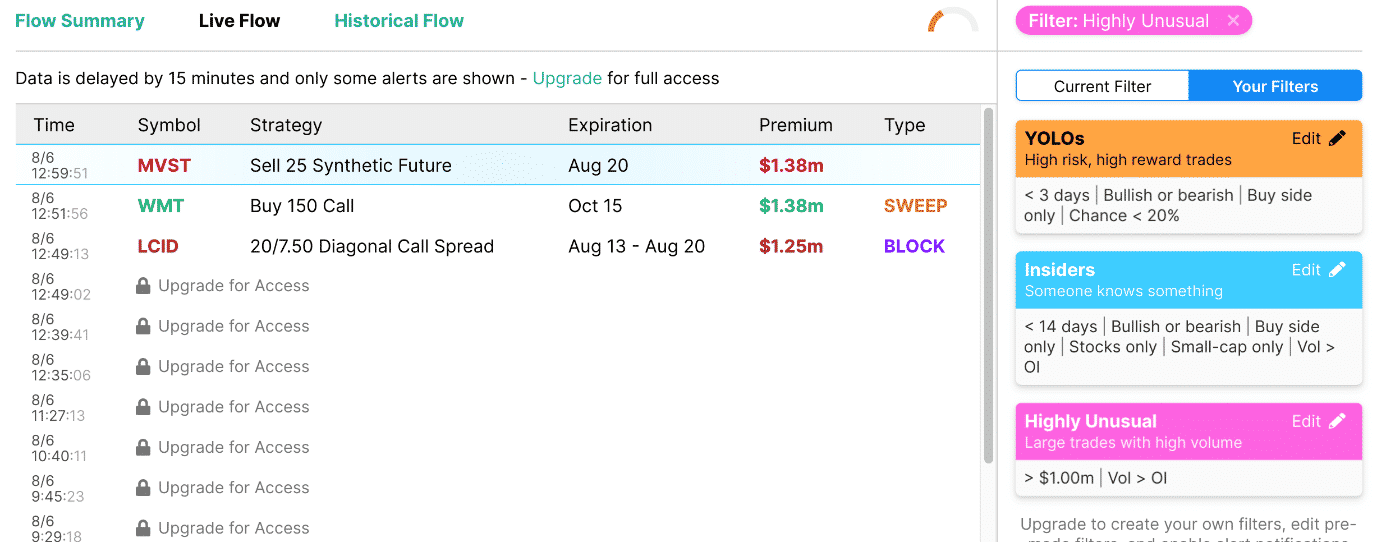
Prebuilt Filters
Clicking on “Your Filters”, you get three prebuilt filters. With the “Highly Unusual” filter turned on, we see that someone made a big order to buy Walmart $150 calls expiring in about two months.
Summary
OptionStrat is pretty new.
It launched in November 2020.
The user interface is modern and easy to use. Its features are comparable to other trading platforms.
I found this to be an excellent tool for both beginner and advance options investors.
Trade safe!
Disclaimer: The information above is for educational purposes only and should not be treated as investment advice. The strategy presented would not be suitable for investors who are not familiar with exchange traded options. Any readers interested in this strategy should do their own research and seek advice from a licensed financial adviser.


