
In the last lesson, we learned about the collar trade with a difference, this week we are going to look at using technical analysis in our covered call decision making process.
View previous covered call lessons on covered calls 101, compounding, volatility, open interest, selecting covered call strikes, setting up a covered call portfolio, when to sell covered calls, how to limit losses on covered calls, the collar trade, the collar trade with a difference and the Dogs of the Dow plus 2015 Update.
When it comes to covered call trading, technical analysis can be a key factor.The primary risk with covered calls is that your stock will have a sharp move lower, so sticking to stocks in well defined uptrends can help minimize (but not eliminate) that risk. So how is an uptrend defined?
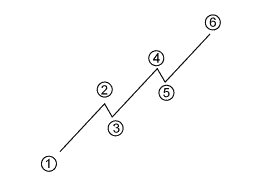
An uptrend could be defined as a series of higher highs and higher lows, or it could be a stock that is above a particular moving average such as the 20 day or 200 day. However you choose to define it, sticking to stocks in clear uptrends will help improve your chances of success.
For stocks in clear uptrends, traders can be a bit more aggressive with their call strike placement and look to seek more profit from capital gains while foregoing some of the income portion. For stocks with less well defined uptrends or with choppy chart action, traders may want to think about placing their call strike at-the-money and focus on maximizing income.

Uptrend – higher highs and higher lows
Using support and resistance is also important for covered call trading. These levels can help traders decide where to place their call strikes and set their stop loss. Investopedia defines resistance as:
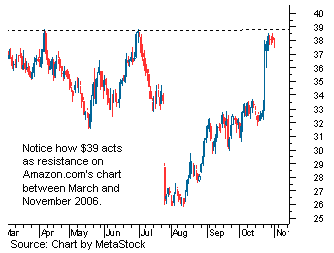
With that in mind, traders can place their short call around, or just above a stocks resistance level. If the stock rises up to resistance but doesn’t break through it, that is the ideal scenario for a covered call trader. They achieve a capital gain, their short call expires worthless and they get to hold on to the stock in order to sell another lot of calls.
Below, you can see Amazon’s stock that had particular trouble breaking through resistance of $39 in 2006. Placing call strikes at $40 may be a good idea for traders not wanting to have their stock called away.
Investopedia defines support as:
Breaking through support is a significant negative signal for a stock indicating that it may be time for traders to consider implementing their exit strategy. Quite often when a stock breaks through support, swift declines follow and covered calls do not provide much downside protection in that case.

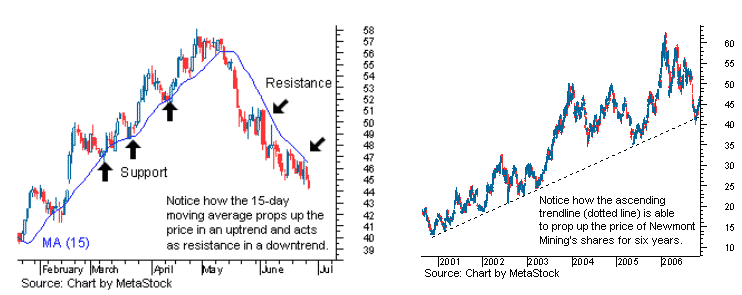
Moving averaged and trendlines can also provide support and resistance as seen below:

While technical analysis can help in the decision making process, it should not be the sole reason for entering a trade but rather should be used in conjunction with an overall trading strategy.


