
Traders anticipate a pullback if an asset becomes overbought or seems over-extended on the upside.
The only problem is that they don’t know when that pullback will come.
Sometimes, an asset can be overbought for a very long time, much longer than what traders would expect.
Contents
Introduction
We want a trade with a negative delta to profit from a downside move.
Yet, we don’t want to lose a lot of money if the pullback never comes.
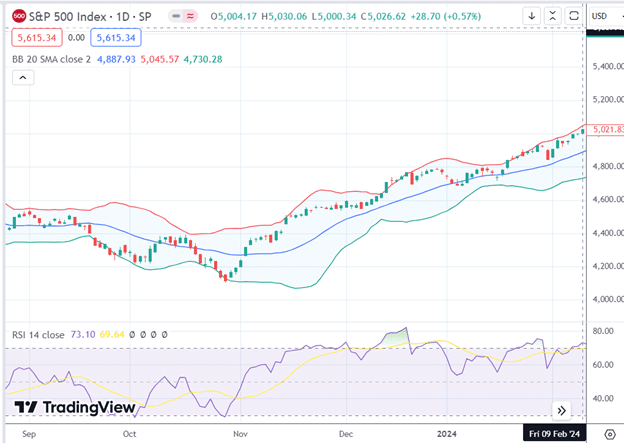
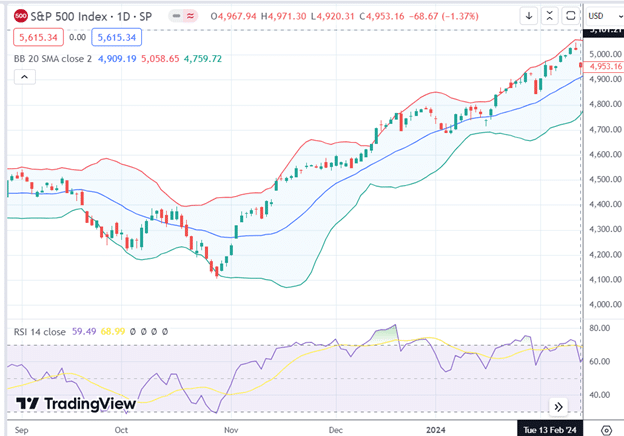
For example, we will use February 9, 2024, when the SPX is overbought (above 70 on the RSI) and near the top of the Bollinger Bands.
Normal Pullback
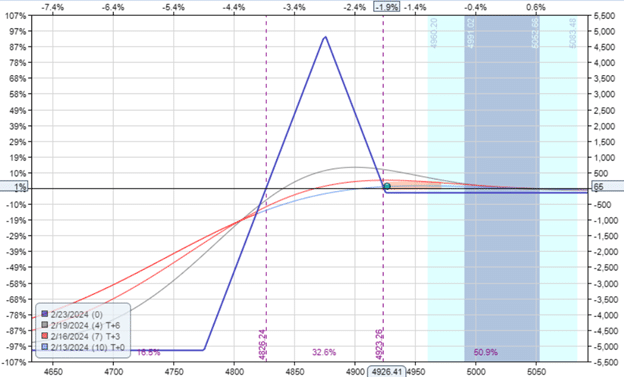
Take a look at this broken-wing butterfly, which is two weeks to expiration.
Date: February 9, 2024
Price: SPX @ 5025
Buy one February 23 SPX 4775 put @ $2.25
Sell two February 23 SPX 4875 put @ $4.90
Buy one February 23 SPX 4925 put @ $9.00
Total Debit: -$145
The short options are roughly at the 10-delta on the option chain.
The upper wing is 50 points, and the lower wing is 100 points.
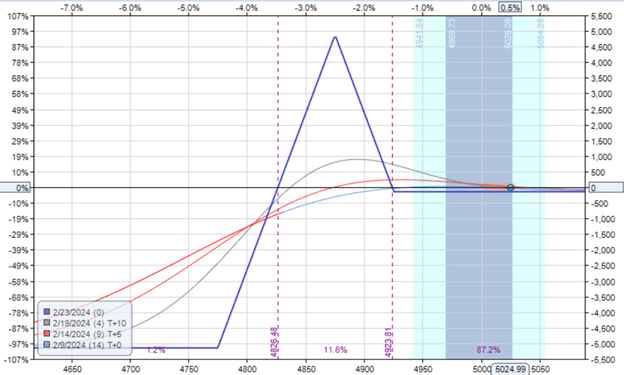
It looks like this.
The Greeks are:
Delta: -0.99
Theta: 9.86
Vega: -14.9
The trade has a negative delta to profit from the pullback.
But if the traders have to wait a while before it comes, at least there is some positive theta to profit from the passage of time.
All of the options in this butterfly are put options.
If the price is above the strike prices of the put options, the put options expire worthless.
If the pullback never comes and SPX keeps going up and up and up until the butterfly expires in two weeks, the traders would lose the initial Debit that they paid for the butterfly, which would be $145.
The $145 loss is the upside risk.
The max loss in the trade is not the Debit paid.
The max risk is a downside risk of $5145 if SPX is below all the strike prices of the put options at expiration.
But the traders should never let that happen.
Looking at the intermediary-time curves, as SPX goes down, the trade will move through a profit zone before it gets into the loss zone.
Traders should take the profit and close the trade before it gets into the loss zone.
Even if SPX drops 100 points right away in one day (a rare event), the T+0 line shows that the trade can still be near break-even.
In the back of our minds, we know that the T+0 is just a mathematical predictive model that reality does not need to obey.
Let’s model what happens to this trade in OptionNet Explorer.
The next day, the pullback didn’t come. But looks like the trade made $5 in theta.
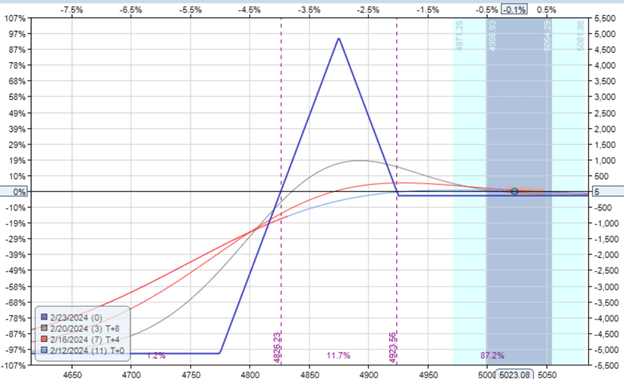
The following day, the pullback came.
And trade is up $65.
Delta: 1.79
Theta: 53.00
Vega: -82
The delta has switched from negative to positive.
If SPX continues to drop, the trade will no longer make money.
In fact, it would start to lose money and get into the loss zone.
This would be a good time for the traders to take their profits and close the trade.
Getting $65 with $5145 capital at risk is about a 1.26% return in two days.
The Pullback That Came Too Late
Let’s look at how the trade can lose if the pullback comes too late.
This time, with five butterflies on SPY.
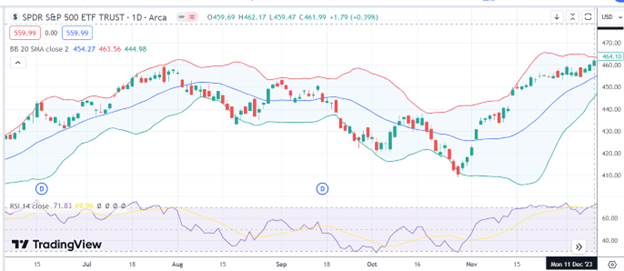
Date: December 11, 2023
Price: SPY @ $461.50
Buy five December 29 SPY 435 put @ $0.33
Sell ten December 29 SPY 445 put @ $0.72
Buy five December 29 SPY 450 put @ $1.19
Total Debit: -$40
Max Risk: $2540
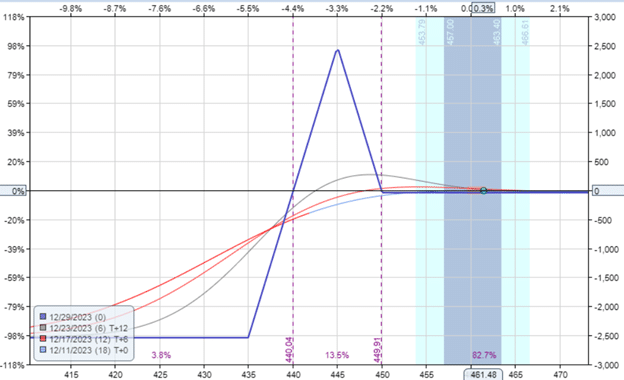
Delta: -0.66
Theta: 5.24
Vega: -11.6
The SPY kept going up for another eight days until the pullback came on December 20, 2023:
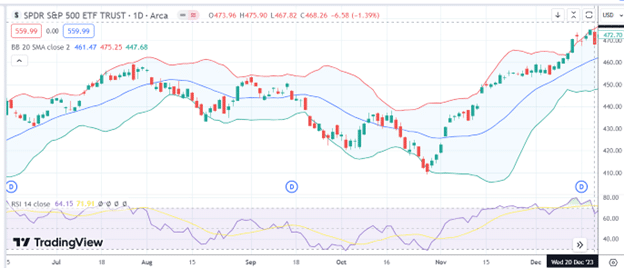
But by then, the price had moved so far away from the butterfly that the P&L shows a -$35.
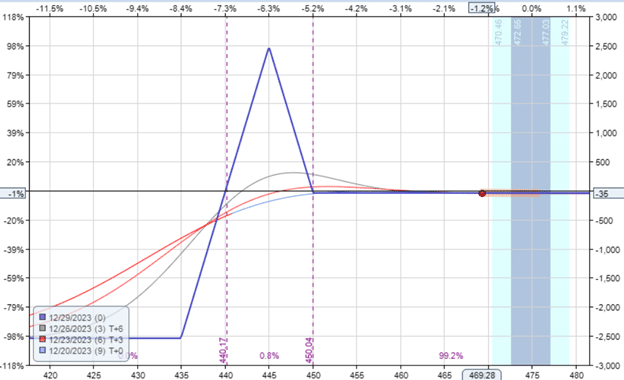
The fly still had -1.84 Delta. So if SPY continues down, it may get back into profit.
But SPY promptly continued upward after that until the trade expiration on December 29:
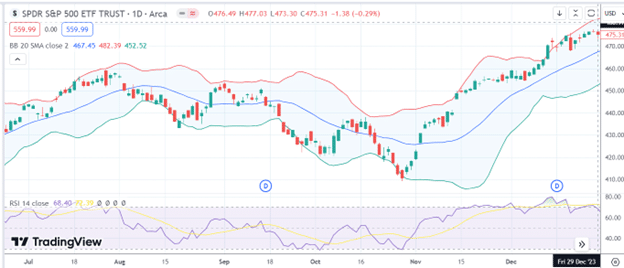
The traders lost the Debit paid, which was $40. With $2540 capital at risk in the trade, that would be a 1.6% loss.
So timing does play a factor.
Frequently Asked Questions
How was the downside risk calculated?
You can look at the risk graph.
Or, in the case of the first example, If SPX drops below all, the put option strikes.
Then we make $5000 from the put debit spread of the upper wing.
And lose $10,000 from the put credit spread of the lower wing.
That’s why the max loss is $5000 plus the $145 initial debit, or $5145.
Is it possible to get a credit for the butterfly?
You can configure the butterfly to get an initial credit, but that fly would likely have a positive delta, which is not what you want if you expect a pullback.
It would be nice to be able to find a combination of strikes and expirations so that we get a negative delta and a credit.
But that combination would be difficult to find.
At best, you might get something with near-zero Debit and near-zero delta.
Summary
For traders with the opinion of a temporary downside move, this broken-wing butterfly may be something to consider with a small limited upside risk if the trader’s opinion is wrong.
It may be a good alternative to the bear call spread in which, if the trader is wrong, the losses can mount up fast if the trader does not close it quickly enough.
We hope you enjoyed this article on how to catch a pullback with a broken-wing butterfly.
If you have any questions, please send an email or leave a comment below.
Trade safe!
Disclaimer: The information above is for educational purposes only and should not be treated as investment advice. The strategy presented would not be suitable for investors who are not familiar with exchange traded options. Any readers interested in this strategy should do their own research and seek advice from a licensed financial adviser.


Very interesting, thanks a lot for sharing!
One hint, the link to the bear call spread in the summary leads to the wordpress admin page
Thanks! And thanks for the heads up about the link, it’s fixed now.