


Today, we are looking at an SPX weekly option strategy.
We use weekly expiration options all the time in longer-term trades that have 30 to 45 days till expiration.
Today, we are not talking about those.
Here when we say “weekly options strategy,” we are talking about trades that have expiration in 4 to 7 days.
These are also known as 4-DTE trades or 7-DTE trades, depending if you are initiating the trade on a Friday or Monday for the following Friday expiration.
Contents
Introduction
There are a few different SPX weekly option strategies out there.
The one that we are going to take a look at today is the bullish broken wing butterfly strategy presented by Eric O’Rourke his YouTube channel).
There are several appealing things about this strategy:
- the trade is defined-risk
- the max risk is small enough to be comfortably traded on small accounts
- the strategy is mechanical — just follow the rules as to enter the trade or not
- there is no adjustment and no watching the market — just hold to expiration because SPX is cash-settled
- there is a filter to avoid entering in under poor conditions (because no strategy works all the time).
His Results
In his video, he showed the results of his backtest using end-of-day data with eDeltaPro automated backtesting software.
His 5-year backtest (from April 20, 2016, to April 30, 2021) shows a 66% win rate, with the average win being $215 and the average loss of $297.
The average P&L per trade over the 74 trades taken is $42.
This result shows that the strategy produces a positive return in the long run.
However, the years tested were primarily bullish years which worked out well for a bullish strategy.
If you look closely at the backtest equity curve, you see significant drawdowns.
At some point in the year 2018, the P&L went from $1295 down to $670.
That is almost a 50% drawdown.
While it is easy for a trader to say that they will be able to trade the strategy when they see a five-year equity curve that goes up, the psychology of trading the strategy live and being able to hold through the drawdown is a different story.
To get a better feel for the strategy, we are going to manually back-trade the strategy through the year 2021 and the bear market of the first half of 2022.
For our test, we will make two modifications to the rules.
- Instead of his test, which enters the trade at the end of Monday, we will enter our trade two hours after the market opens on Monday. This is because we are using OptionNet Explorer, which does have intra-day data. He was using eDeltaPro, which has only end-of-day data.
- In addition to his moving average filter (see rules below), we are adding an additional filter to prevent us from trading when the VIX term structure is in backwardation. We feel that since this is a bullish strategy, not trading during backwardation should decrease our losses.
The Rules
The complete rules used in our backtest are:
- Enter the trade on Monday if the 3 EMA is above the 8 EMA and if the front two months of the VIX Futures term structure are in contango. Skip the trade if Monday is a holiday.
- Use SPX with four days-to-expiration for the following Friday expiration. If Friday is a holiday, skip the trade. If Friday has an AM and PM expiration, choose the PM expiration.
Using an all-put butterfly, sell two puts at delta 55.
Buy one put two strikes lower. Buy another put one strike higher.
- Hold to expiration. Hence do only on SPX, which is cash-settled. SPY is not recommended since it can be assigned.
This is a risk graph of a typical trade.
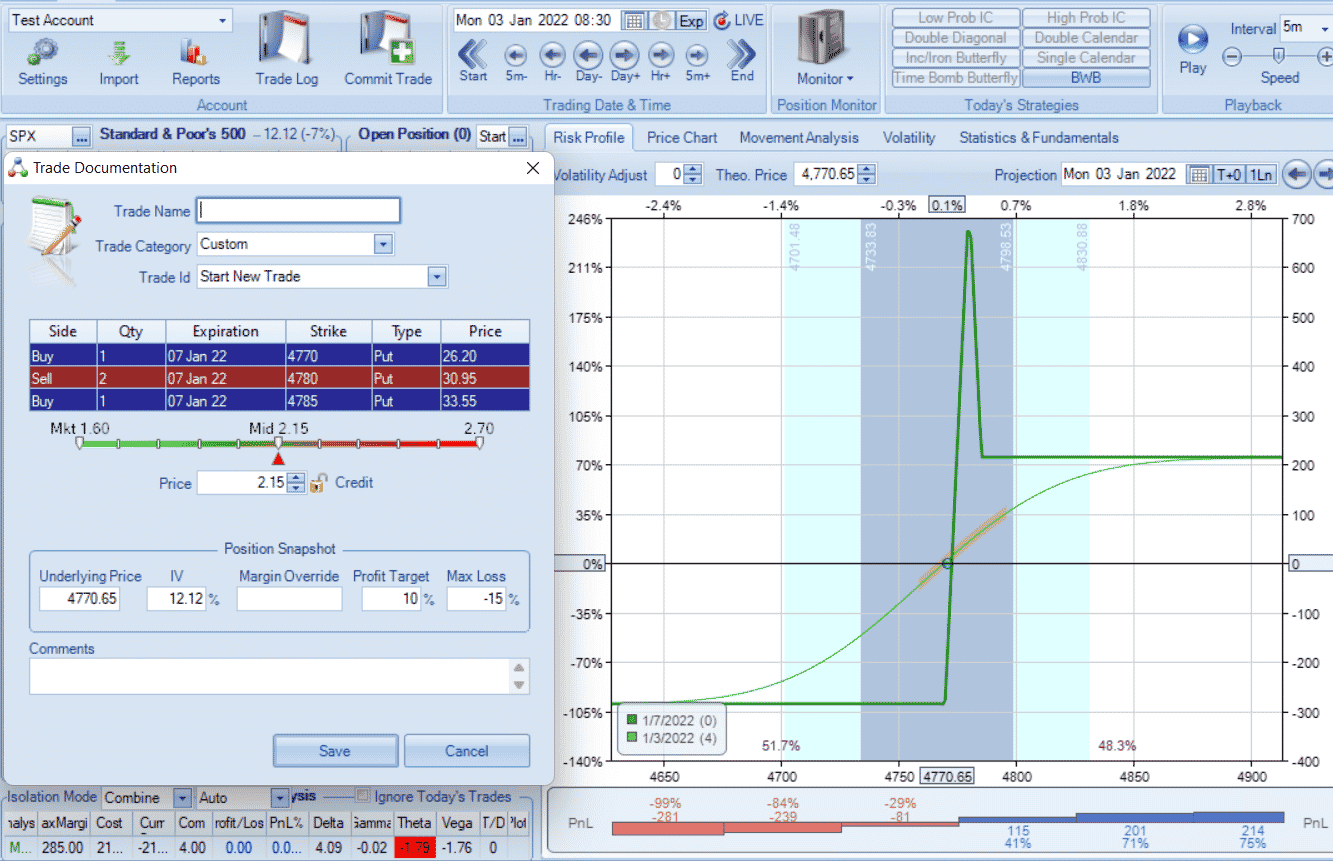
The trade started on January 3, 2022, with expiration that Friday on January 7.
The credit received for putting on the trade is $215 for one butterfly.
This is a purely directional trade.
SPX is trading at $4770 at the start of the trade, and we are hoping that the price of SPX will expire above the short strike of $4780.
If the trade wins, it will likely win the credit received for $215.
If the trade losses, it will likely lose the max loss in the trade of $285.
There are rare cases where the price may fall in the butterfly tent area that cause those numbers to differ.
There is no theta decay at play here.
In fact, the theta is negative.
This is a bullish trade starting with four positive deltas.
Our Results
Over the one and half years tested, the following 37 dates met our trade criteria:
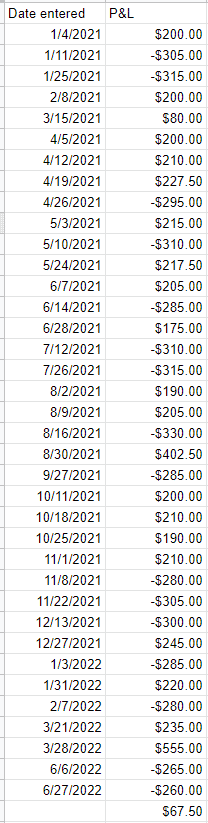
Out of those 37 trades, there were 21 wins and 16 losses — giving a win rate of 56.7%.
The net P&L overall is $67.50.
This equates to an average win of $1.82 per trade, where each trade is one butterfly with max capital at risk of about $285.
A return of $1.82 on $285 capital at risk is a 0.6% return in one week.
It took 1.5 years for the strategy to make $67.50.
It made $147.50 in the bullish year of 2021.
And it lost $80 in the first half of the bearish 2022 year.
Scaling up to 10 butterflies
If we had scaled up the test to be ten butterflies per trade with a max risk per trade of $2,850, then the backtest would have made $1475 in the year 2021 (where we had 30 trades triggered).
The average return on capital per trade for 2021 would be $49/$2850 = 1.7%.
Although we are not trading it every week, on the week we do trade the strategy, it makes, on average, a 1.7% return in a week (for bullish times).
During the bearish times, the strategy would have lost $800 in the first half of 2022.
Only seven trades were triggered in the six months.
So the average loss per trade is –$114. Percentage loss on capital at risk is –$114/$2850 = -4%.
The number of consecutive losses seen is also an important number.
Because of the three consecutive losses on November 8, November 22, and December 13, 2021, it means that the trader would have a drawdown of –$885 during one month.
The strategy does well in a bull market but suffers in a bear market.
These short-term directional strategies tend to do what the market does.
FAQs
What are the benefits of weekly options?
By having trades that last only one week, you can re-use the capital for the next trade next week.
If you have a profitable strategy, then this gives you a greater percentage yield on the capital used.
If the trade involves capitalizing on theta decay, you get larger theta in these shorter-term trades.
What are the disadvantages of weekly options?
Short-dated options have a large price risk.
This means that if the price makes a big move, the short-dated position can be down a lot in P&L.
This is the effect of a larger gamma, which comes with getting larger theta.
Is selling 7-DTE iron condors a good idea?
It is okay to do these once in a while in small size for speculative trades and for earning events.
There is very little opportunity for adjustments on these trades.
Even if you were to make a simple adjustment, you would have to watch the market closely and act fast.
One large price move and the trade is gone (sometimes to max loss).
Therefore try to structure trades so that the risk-to-reward is not that large.
Keep it down to somewhere around 3-to-1 risk to reward.
I wouldn’t want to have a short-term trade with a risk-to-reward of 10.
For our bread-and-butter iron condors that we used to generate monthly income, we prefer longer-dated expirations closer to 45 days and get out before the week of expiration.
This gives us protection against large price moves and allows us to adjust without having to constantly watch the market.
Conclusion
While numbers reported from a backtest may look good on paper.
Trading it in a live account can feel quite different. It is true that in the long run spanning bullish periods, the strategy does make money.
How long must the strategy be traded to see those gains?
The question that the trader needs to ask is how large the drawdown is.
Is the trader okay with trading a strategy for six months and not seeing any positive P&L?
That would be what would have happened if a trader started trading the strategy on November 8, 2021.
The trader would have to continue trading it all the way till the end of June 2022 and not see the P&L go above zero.
That is because of pure bad luck that the first three trades turned out to be losers, and the wins did not come quickly enough before the bear market started.
What if the bearish half of 2022 continues to last for a long time?
Will the trader continue trading the strategy until the bullish time comes?
Or will the trader try to time the strategy as in timing the market?
Or is the trader going to start tweaking the rules to try to find a rule that better filters out the bearish market and signals only for the bullish market.
The 3 and 8 EMAs were supposed to perform this filter, but they didn’t seem to do too good of a job.
What if we add an additional filter to trade only when the price is above the 50-period moving average.
We tried that.
That reduced the losses in 2022 and turned the P&L positive for those six months.
But the rule filtered out good trades in 2021 and made the P&L of 2021 negative. So that didn’t work too well.
We concede that our backtest of only 37 trades is a very small sample size.
Too small to statistically make definitive conclusions.
However, in real life, those 37 trades would have spanned 1.5 years.
Is a trader going to try out a strategy that long to determine whether it is working or not?
Before you decide to trade a strategy based on a number from backtesting, manually back-trade it or paper trade it first.
Each trader would have to decide for themselves whether the strategy is worth trading or not.
We hope you enjoyed this article on the SPX weekly option strategy.
If you have any questions, please send an email or leave a comment below.
Trade safe!
Disclaimer: The information above is for educational purposes only and should not be treated as investment advice. The strategy presented would not be suitable for investors who are not familiar with exchange traded options. Any readers interested in this strategy should do their own research and seek advice from a licensed financial adviser.


awesome as usual, thanks a lot Gavin for doing all this incredible work and sharing it.
Why a BWB?
This trade is basically the same as a bullish vertical spread with the SPX starting in-between the two strikes of the vertical spread.
Yes quite similar.
Thanks for the information