


VectorVest is a stock analysis and portfolio management software that has been gaining popularity among investors and traders.
The platform offers a suite of tools that allow users to analyze stocks, track market trends, and make informed investment decisions.
In this article, we will provide an in-depth review of VectorVest and its features, as well as explore its pros and cons to help you decide if it’s the right investment tool for you.
Contents
Introduction
VectorVest is a stock analysis and portfolio management platform that provides market analysis, stock screening, and charting tools.
VectorVest is geared toward stock investors, but it does have some use cases for options traders, which we will get into later.
It claims to have superior proprietary market timing indicators.
Its algorithm analyzes and ranks stocks based on various criteria, such as earnings growth, price momentum, and value.
Pricing
VectorVest has a 30-day trial at a discounted rate.
It will ask for your credit card when you sign up.
This is so that it can bill you $9.95 for the first month and then the regular subscription price of $69.95 for subsequent months.
The prices are as seen on their website at the time of this writing and may change. Please check their website for the latest pricing.
Getting Started
I can see why they include free webinars for new members.
Because once you download the Windows or Mac version of the VectorVest 7 desktop application, this is what you see:
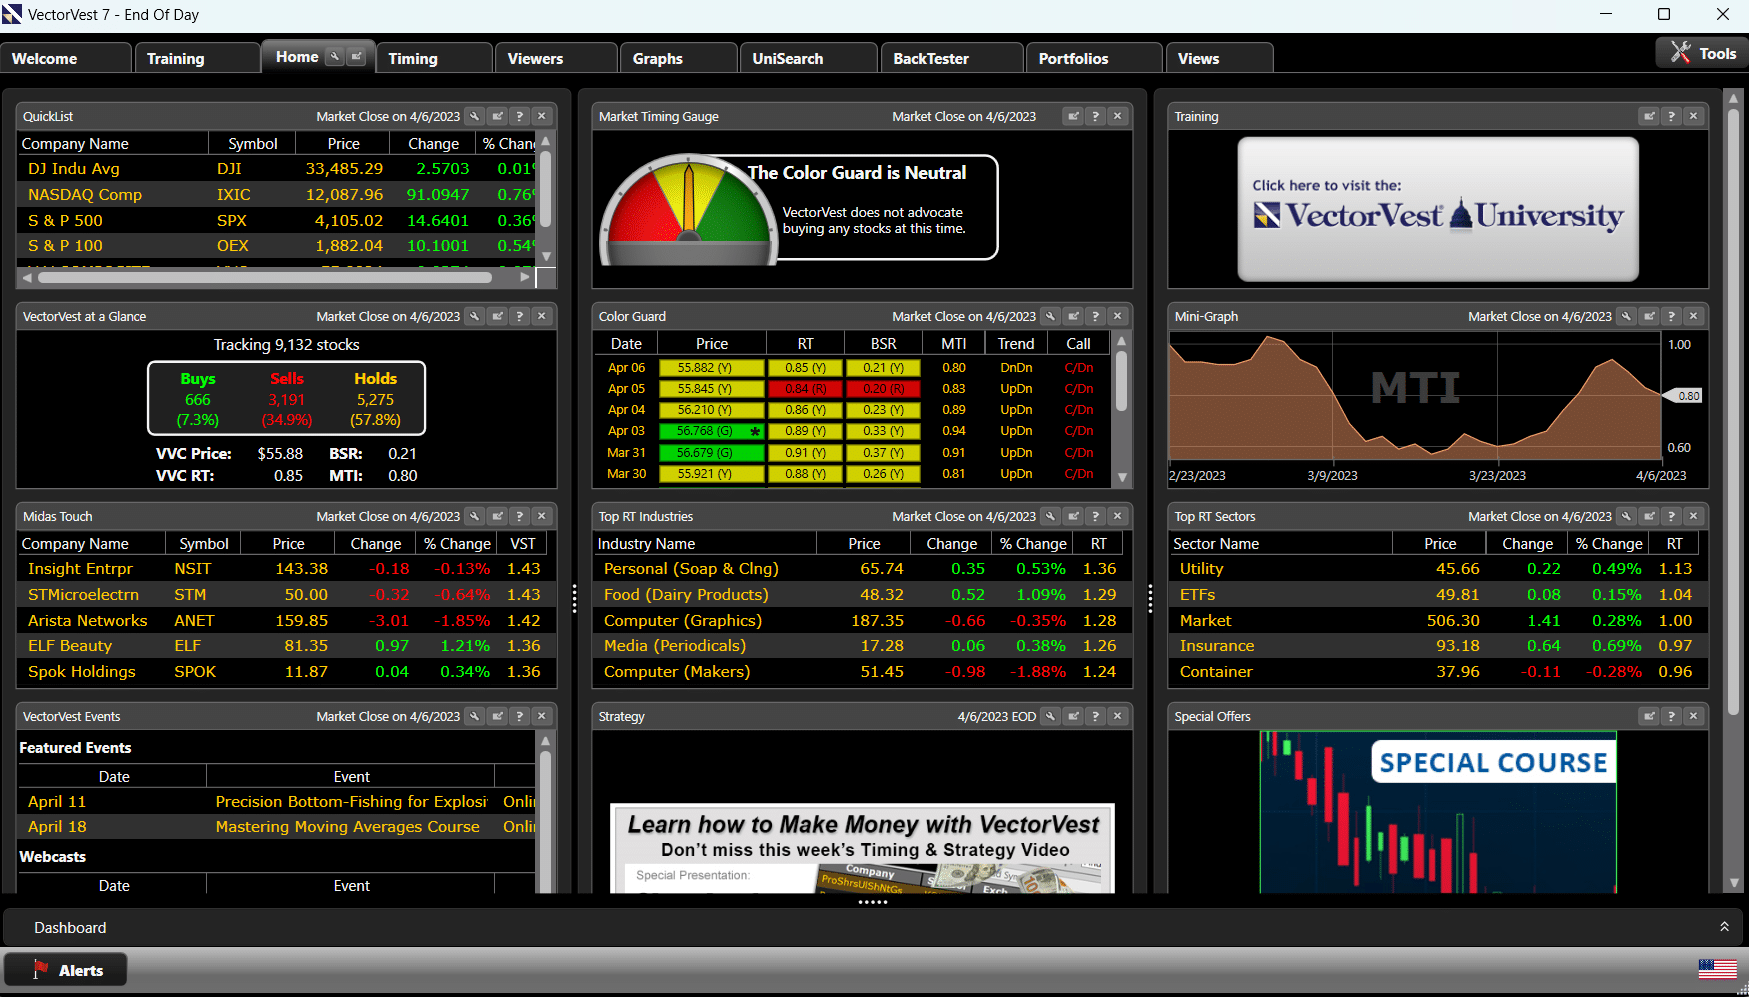
Unlike the cockpit of an airplane with all the dashboards and panels, you don’t even know where to begin.
Instead of randomly clicking around, I recommend clicking on the “Training” tab and watching the “Successful Investing Quick Start Course”.
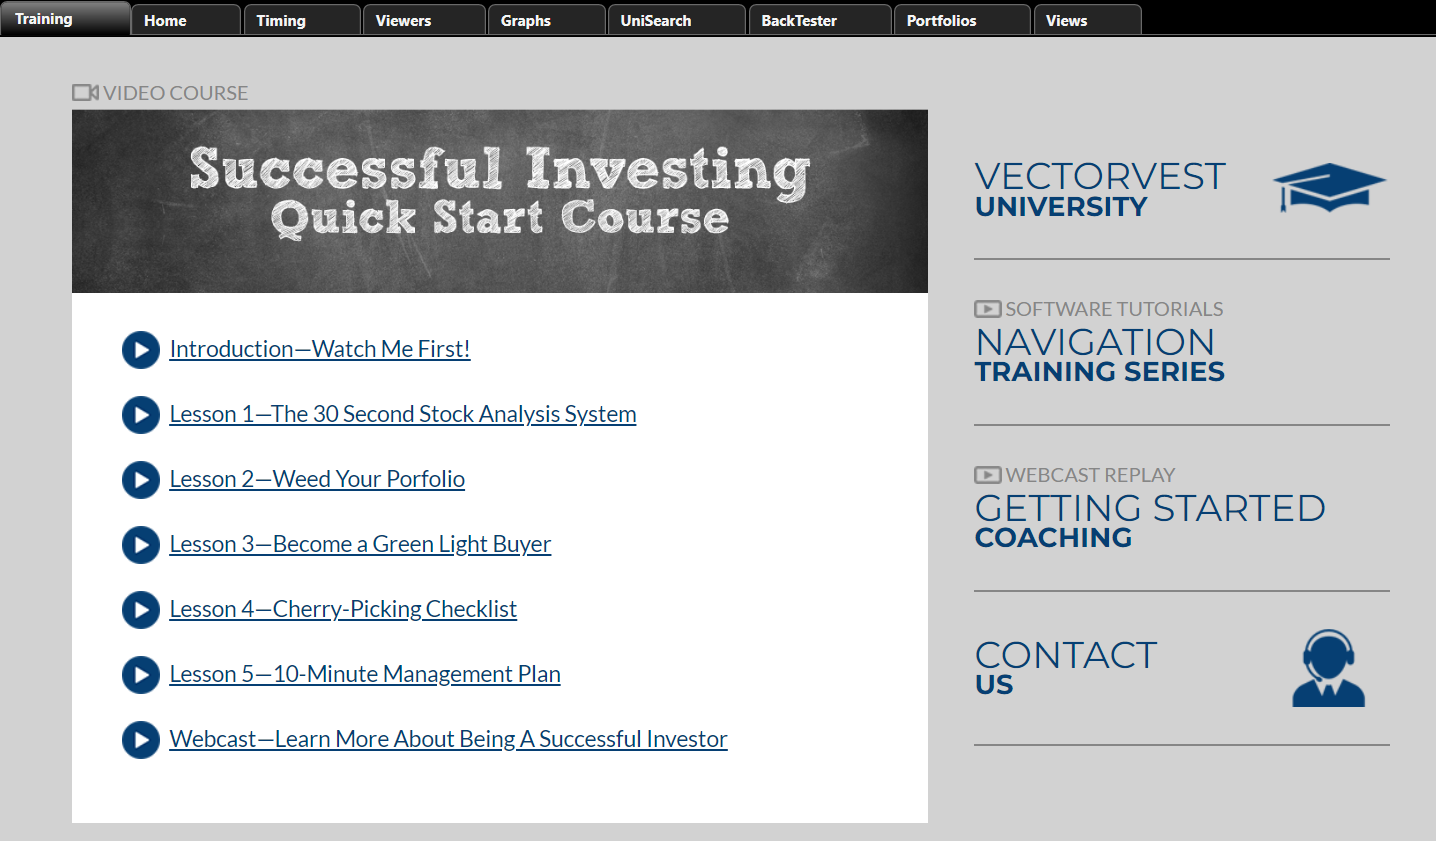
In the end, you should be able to have a simple step-by-step system to buy and sell stocks and learn the basics of the VectorVest platform.
And if you are still confused, there is that “Contact Us” button again.
VectorVest has good support and does not appear shy in giving out their contact telephone.
You can find their toll-free international number right up front on the website, plus in all the obvious other places.
It is not some offshore call center.
Their support team is based in North Carolina, and many use VectorVest.
However, don’t call them on the weekends because they are not open then.
I have found that they pick up their phones when they are open.
Philosophy
VectorVest core philosophy is to buy rising stocks in a rising market.
Similarly, sell falling stocks in a falling market.
It also tries to “keep it simple” by buying safe, undervalued stocks that are rising in price.
To do this, it considers market timing, technical analysis, and fundamental analysis into the mix.
True to the philosophy of keeping it simple, you don’t need to spend hours analyzing a stock by looking.
The VectorVest algorithms analyze the stocks for you and give you a simple green, yellow, or red signal as to whether it recommends buying, holding, or selling that particular asset.
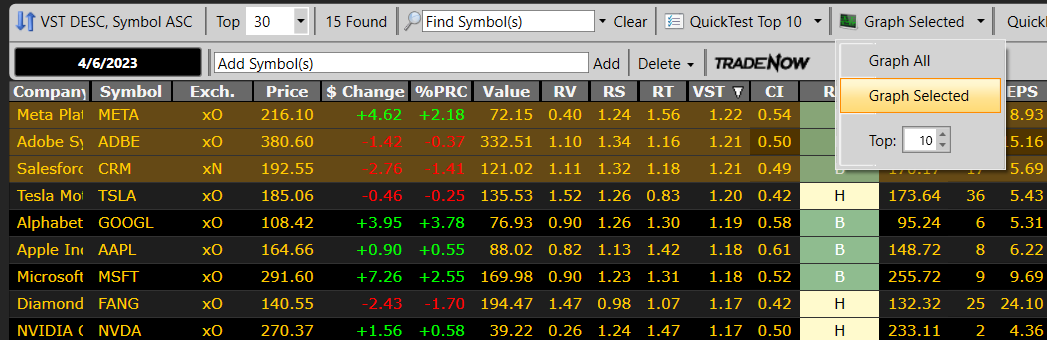
The WatchList
The centerpiece of the VectorVest application is the Watchlist under the “Viewers” tab.
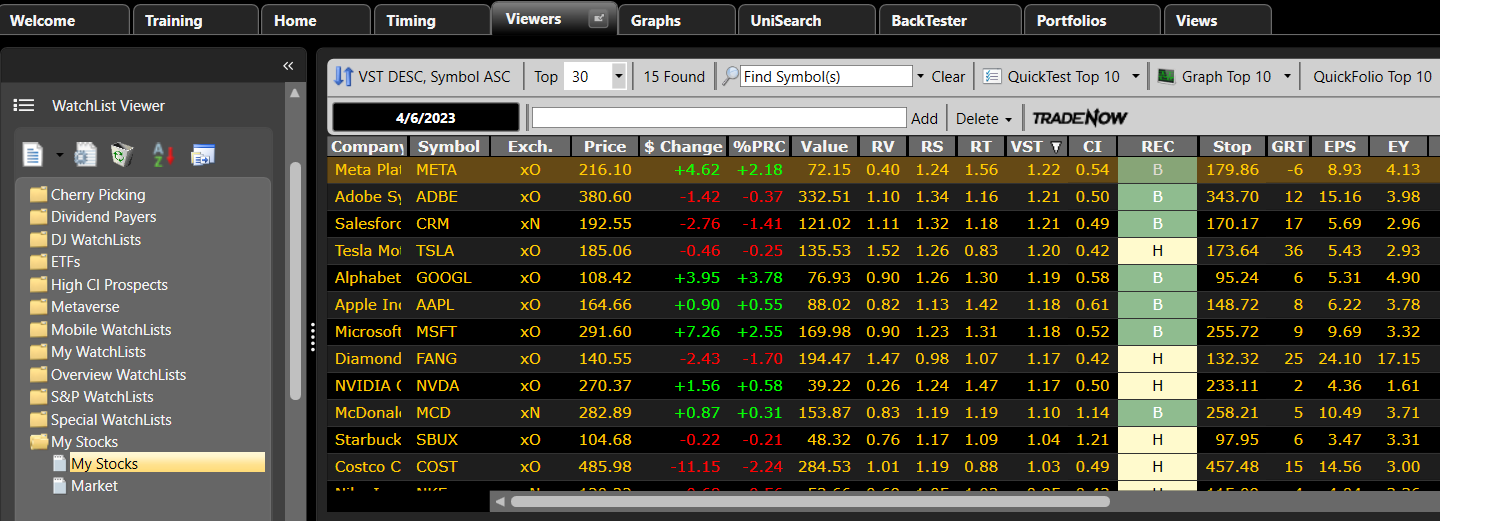
Here you can group and categorize multiple watchlists.
I have some example stocks shown in this Watchlist, which I have sorted by the “Value” column.
The “Value” column is a number that VectorVest computes based on a stock’s earnings, growth, profitability, and other metrics.
In other words, it is the stock price that VectorVest thinks the stock ought to be at based on those metrics.
If you compare the price number with the value number, you can determine if a stock price is overvalued or undervalued and by how much.
For example, Salesforce (ticker CRM) has a VectorVest value of 121.
Its market price is 192.
Hence it is not considered undervalued.
But just because a stock is undervalued does not mean it gets a “buy” recommendation in the “Rec” column.
And just because a stock is overvalued does not mean it cannot receive a “Buy” recommendation.
The “Rec” column will have color-coded symbols as follows:
Green – “B” for buy
Yellow – “H” for hold
Red – “S” for sell
The “Relative Value” (RV) column tells the long-term price appreciation potential – the larger the number, the better.
A 1.52 number, for example, means that the stock has the potential to outperform a corporate AAA bond by 52% in the next one to three years.
The “Relative Safety” (RS) column tells you how safe the stock is.
The “Relative Timing” (RT) column tells you whether buying is a good time based on the short-term price trend. A number above 1 means the stock is in an uptrend.
The “Value Safety and Timing” (VST) column combines the RV, RS, and RT metrics into one number with a greater weight on timing.
That way, if you want to keep things simple, you can just look at this one number instead of thinking about three different numbers.
The “Stop” column is VectorVest’s computed price, at which it thinks if the stock falls below, then you should get rid of the stock.
It is based on the 13-week moving average adjusted for fundamentals.
This is great for investors with trouble deciding where to put their stop-loss orders.
The other columns in the table contain the usual metrics, such as earnings per share (EPS), the Price to Earnings ratio (P/E), etc.
A tip for options investors, if you see the prefix “x” in the “Exch” (exchange) column, then that stock has options available.
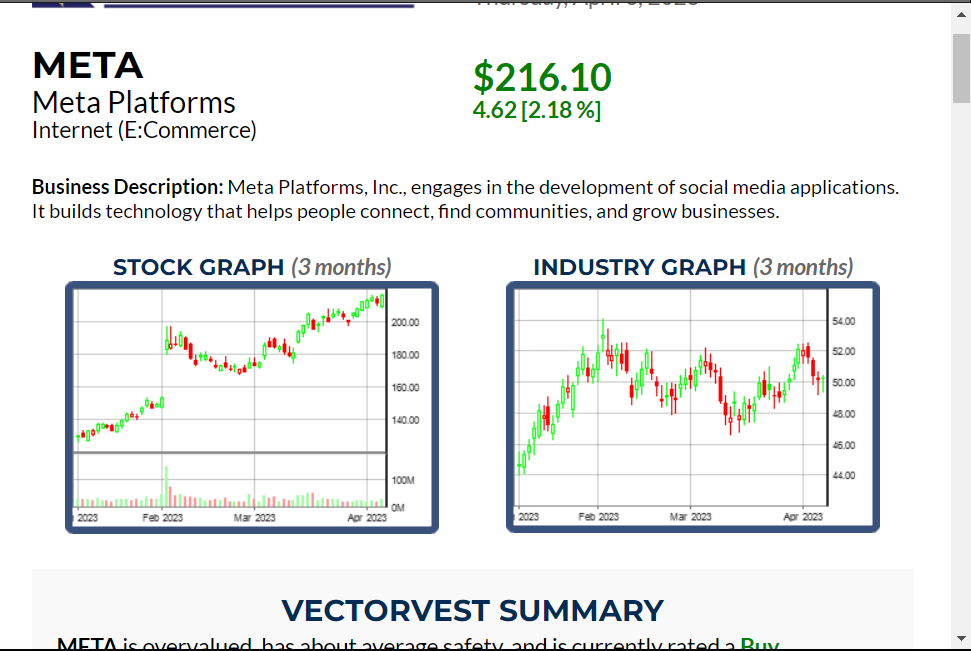
Stock Analysis Reports
Right-click on a stock on the Watchlist, and you can take any of the following actions on this menu:
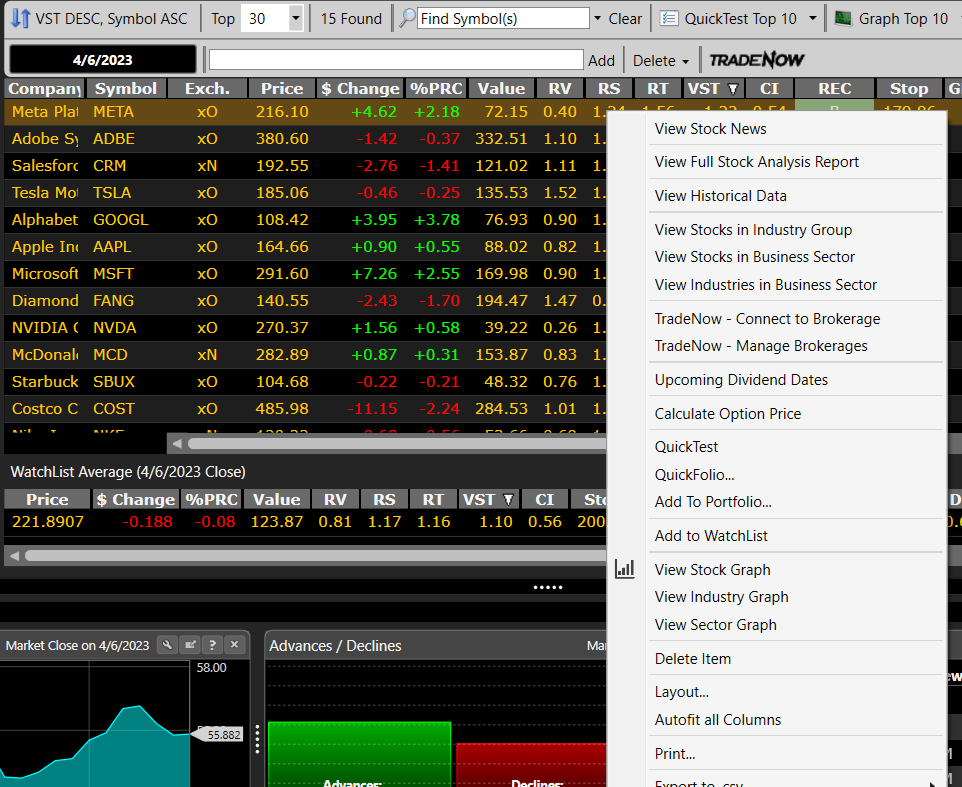
One of the choices enables you to generate a full stock analysis report that looks like this:
Graphing
No investment platform is complete without graphs.
Highlight the rows of stock you want to graph and select “Graph Selected”.
Now you can quickly flip through the selected stock by clicking the up/down arrows in the right scroll bar.
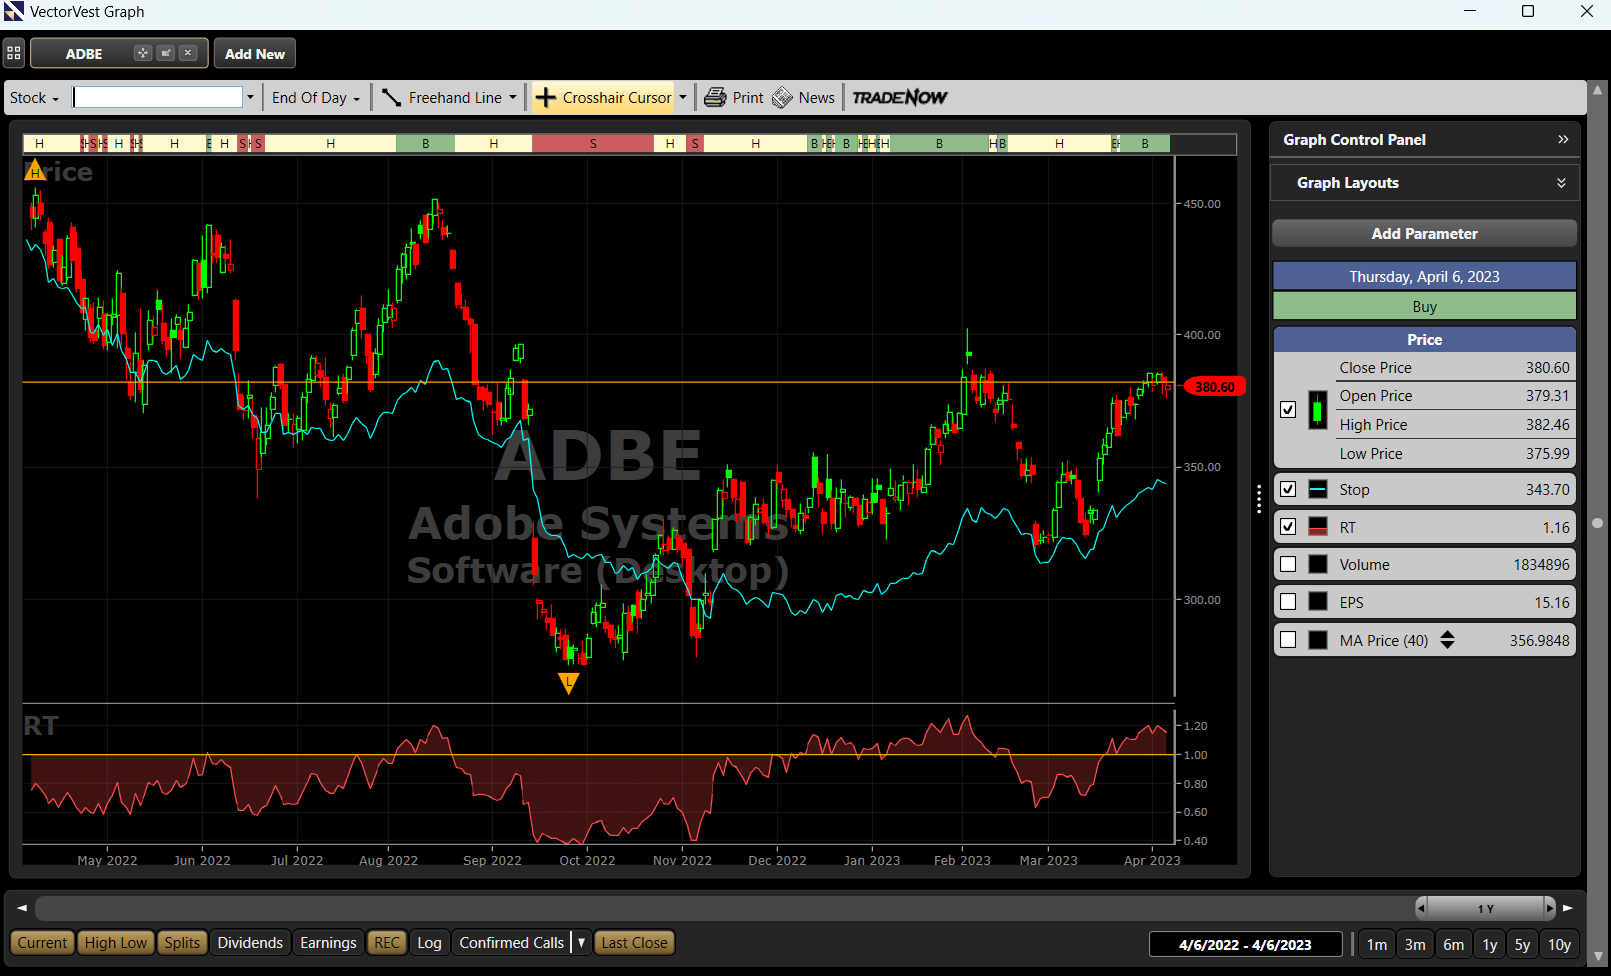
You see the recommendation ribbon at the top of the graph.
The blue indicator line is the VectorVest “stop” price. VectorVest recommends the stock a “sell” if the price is below this line.
The RT indicator at the bottom panel is “relative timing,” which tells you when the price is in an uptrend (above 1) or downtrend (below 1).
Remember that VectorVest’s philosophy is to only buy stocks that are in an uptrend in an up-trending market.
How Do We Know If the Market Is in an Uptrend?
The Market Timing Graph, which can be accessed from the “Market Timing” menu under the Graphs tab, tells you when it is a good time to buy stocks or not.
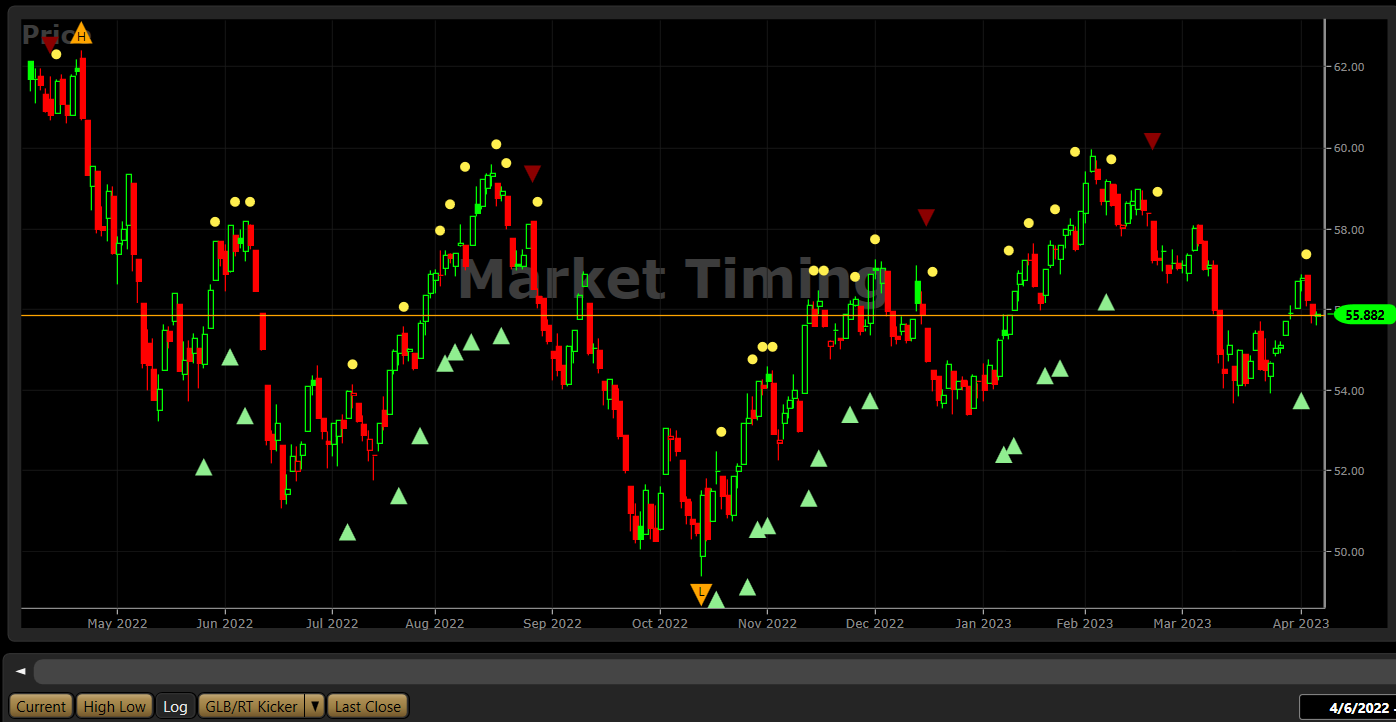
RT Kicker” will give us green buy arrows.
The candlestick you see is the VectorVest Composite (VVC), an index average of all the stocks VectorVest tracks.
Setting the “Log” to “GLB/RT Kicker” will give us green buy arrows.
“GLB” stands for “Green Light Buyer.”
The green arrows will not show up if it feels that the market is toppy (or too high) due to the addition of the “RT Kicker,” which considers the relative timing.
If this is too much of a complication for certain investors, then all they need to do is to look at the “Market Timing Gauge” on the “Home” tab.
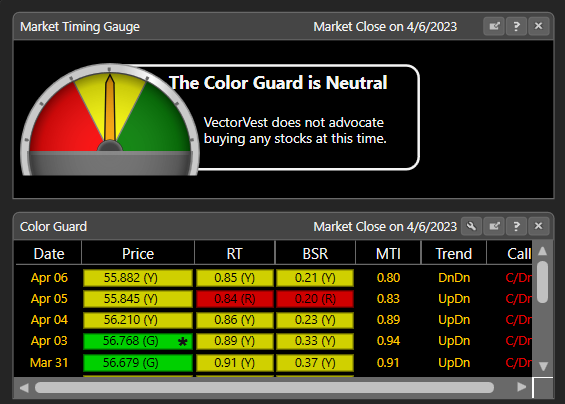
A quick glance will tell you if the gauge is pointing green, yellow, or red – the meaning of which is self-explanatory.
For color-impaired users, the right one-third of the gauge is green.
The left third is red. And yellow in between.
The last column labeled “Call” (confirmed market call) will tell you if the market is in a “confirmed uptrend” or “confirmed downtrend.”
All market crashes since 1996 (including the Covid pandemic) were preceded by a confirmed downtrend call.
A green color under the “Price” column of the “Color Guard” for the most recent date means it is okay to buy.
This is the VectorVest Composite Price (VVC) of the market.
If it has a star next to it, it means that it has momentum.
The RT is the “Relative Timing.”
The BSR is the Buy-Sell Ratio computed from all the stocks in the VectorVest database that have a buy signal compared with the number of them with a sell signal.
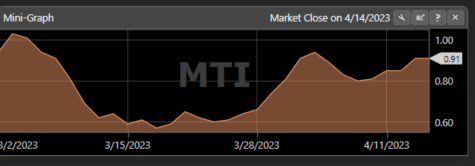
The MTI is the Market Timing Indicator that combines the information from Price, RT, and BSR into one number that ranges from 0 to 2.
If the number is above 1, that means the market is in an uptrend.
The best time to buy is when MTI is above 1.
If MTI is above 1.5, the market may be heading into an overbought condition.
It may still continue higher but buy with caution.
If MTI is below 1, the market is in a downtrend
There is a mini-graph of the MTI indicator on their homepage.
VectorVest categorizes investors into three categories: “Retirement,” “Prudent Investors,” and “Aggressive.”
Most subscribers to VectorVest are in the first two categories.
Their literature says that for all three categories, wait for a green signal in the VVC price and MTI above one before buying.
For retirement and prudent investors, also wait for a confirmed-up call.
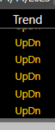
But aggressive investors can buy if they see an “up” in the VectorVest primary wave.
That is the first indicator in the Trend column.
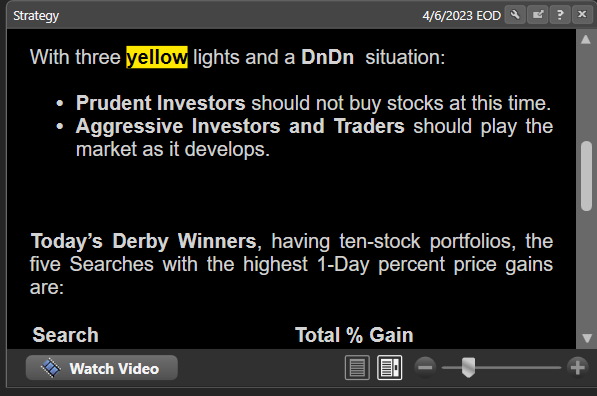
Also, be sure to watch VectorVest’s daily video or read its strategy report.
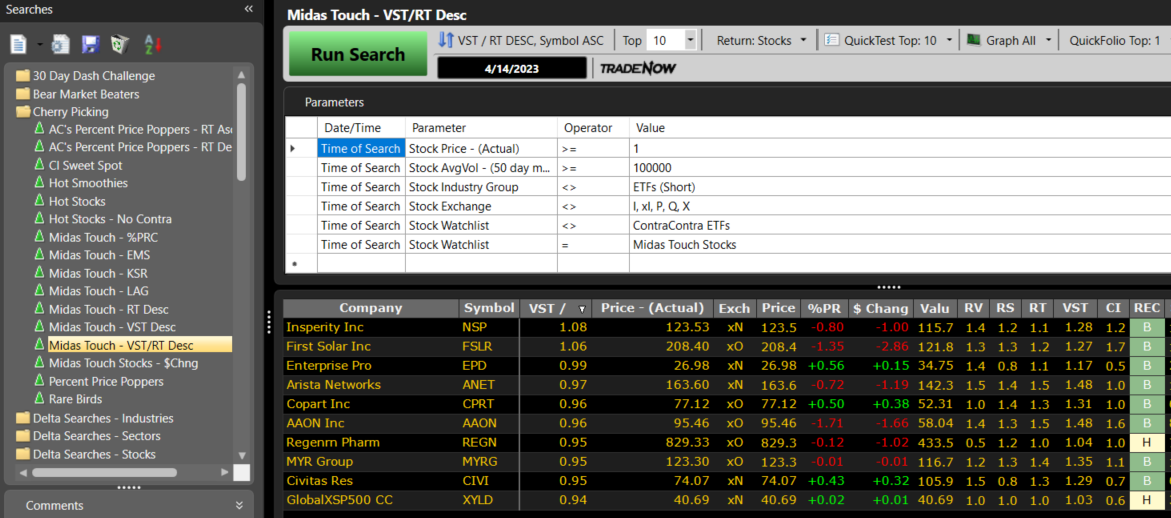
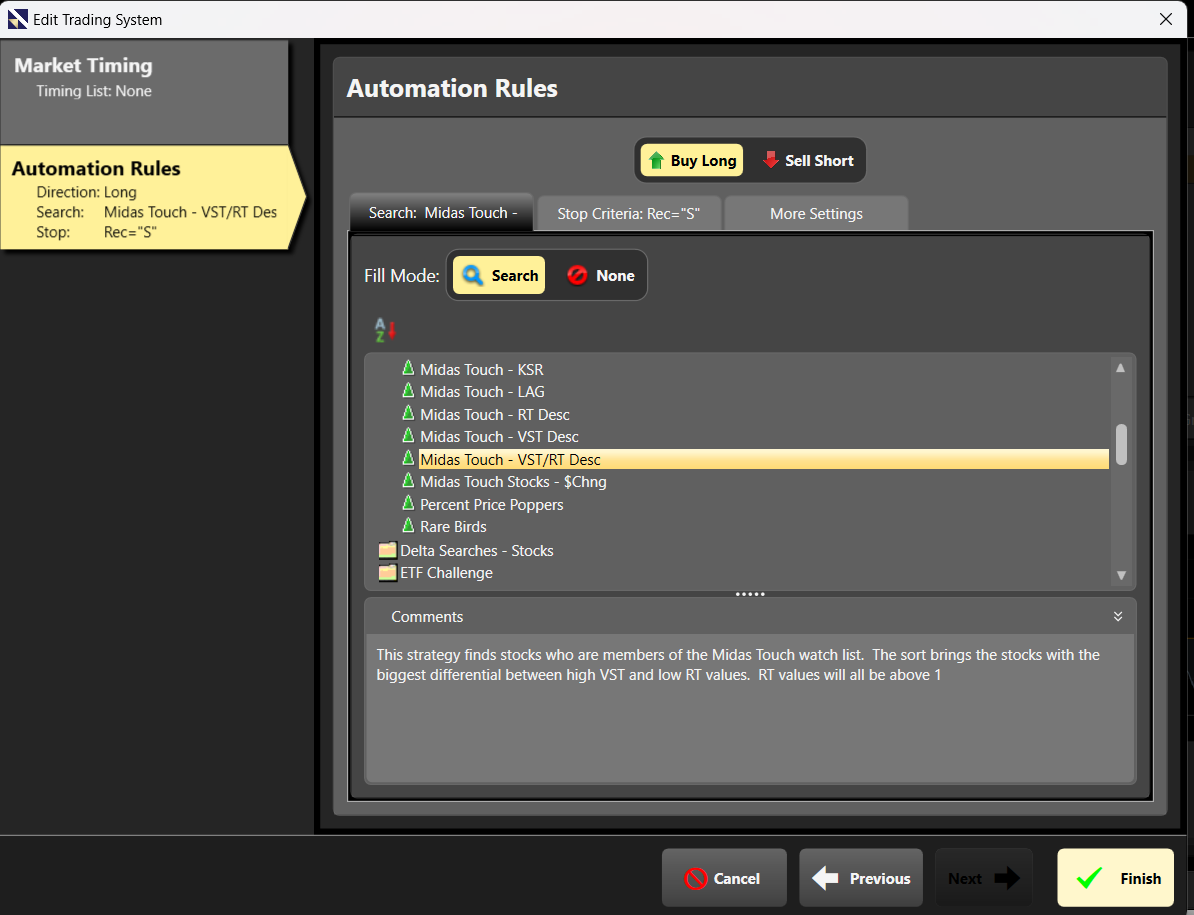
UniSearch
UniSearch consists of saved queries for finding good stocks to buy.
The Midas Touch stocks are what VectorVest considers top stocks, and you can query for these stocks like this.
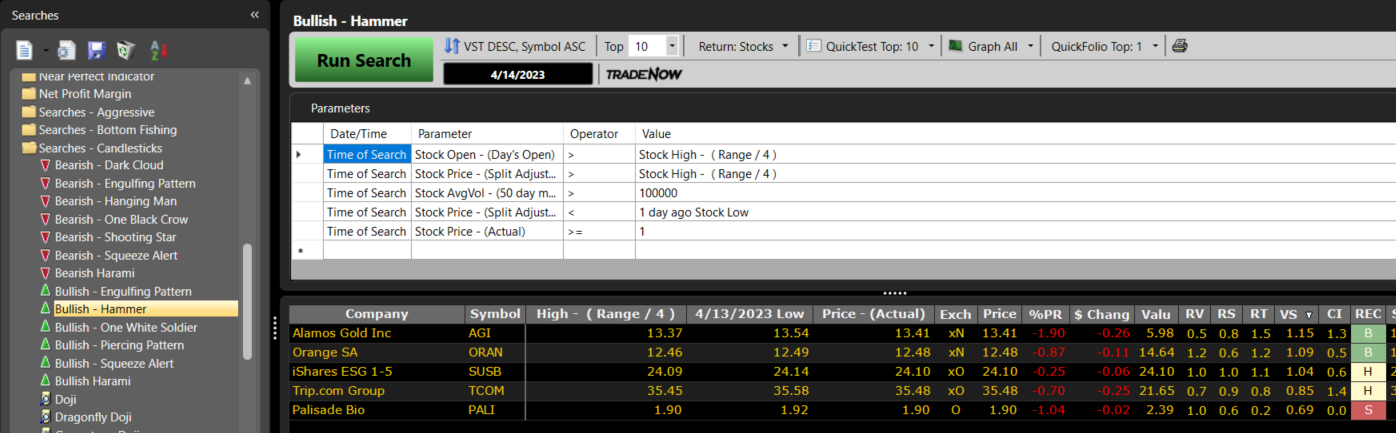
You can also search stock by candlestick patterns.
Here are some that had a bullish hammer at the time of the search.
For aggressive investors wanting to short stocks in a bear market, they can run these queries here:
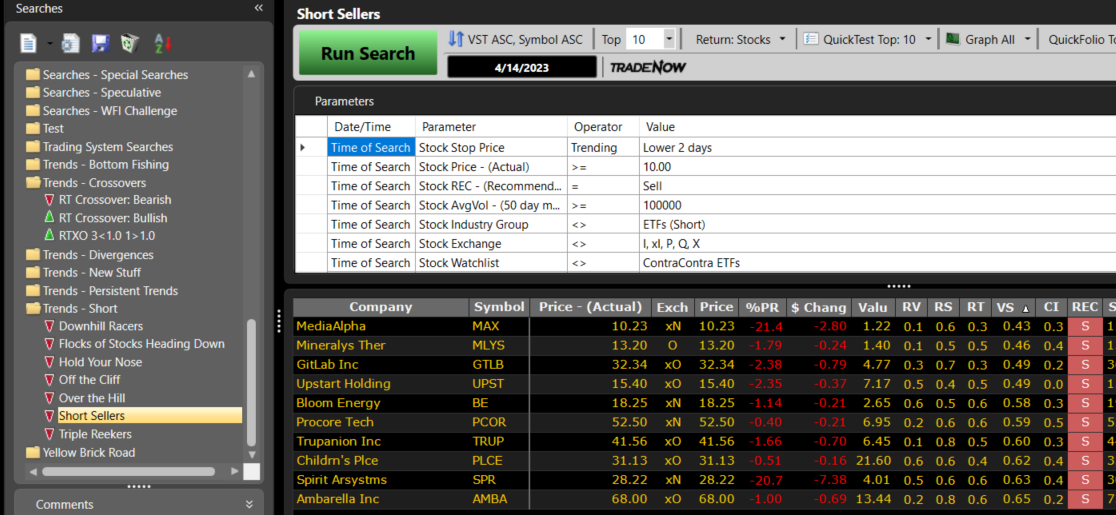
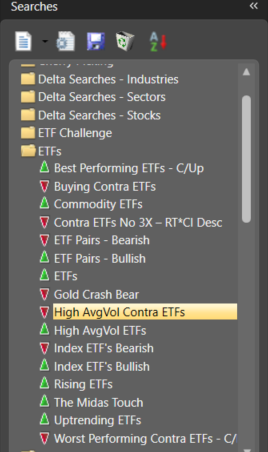
Or they can look to buy Contra-ETFs in a bear market.
Backtest Panel
The backtest panel allows you to run a simulation of a scenario such as the following.
If we started at $100,000 and bought the top 10 stocks resulting from a particular scan during the period from this date to that date where we can see that VectorVest had a confirmed uptrend call, what would be the ending balance?
What would the ending balance be if set a take profit of 20% and a stop loss of 10%, or any other variation thereof?
Note that additional modules may need to be purchased to use some of the advanced features, such as market timing.
This back-tester is not one where you can input your buy/sell criteria based on chart indicators. Nor is it for testing options strategies such as bull put spreads, etc.
Frequently Asked Questions
Can options traders use VectorVest?
While most VectorVest members are stock investors, options investors can still benefit from the VectorVest market direction signals and stock scans to pick the option strategies to apply.
In fact, at VectorVest University, there is a course called The Options Paycheck, which goes over how to use credit spreads in conjunction with VectorVest market timing and stock selection signals to generate income.
Even for non-directional options traders, VectorVest indicators such as the ColorGuard can tell you if the market is trending hard in one direction or another or just moving sideways.
This tool can inform you if it is a good time to initiate a range-bound trade or not.
Or it can bias you to slant your delta-neutral structures in one direction or another.
For example, if I see ColorGuard red, the price column red, RT and BSR red, and a market call of a confirmed downtrend, then I won’t be putting any non-directional trades at that time.
Who are some of the key people in VectorVest?
Dr. Bart DiLiddo is the founder of VectorVest. The “Dr” before his name is not from his medical knowledge.
It is from his knowledge of mathematics with a Ph.D. from Case Western Reserve University.
He is also a graduate of the Sloan School of Management at MIT. The credit for VectorVest’s market timing system goes to Dr. DiLiddo.
Dr. David Paul is Managing Director at VectorVest UK.
Based on his presentation, The Psychology of Trading and Investing, this guy knows what he is talking about regarding trading and investing.
He also has “Dr” prefixing his name. His doctorate is in mechanical engineering.
Does David Paul use the VectorVest system?
Yes, he does. In his presentation at Master Investor Show 2022, he said that he had used the VectorVest system for 70% of his own money since 2016.
Can I do the same things using the free barchart.com?
You may be able to get all the fundamental data and charting with Barchart, but you don’t get the VectorVest ranking system and buy/sell signals which are based on VectorVest proprietary algorithms.
What are the “Midas Touch Stocks” in the Cherry Picking Watchlist?
The VectorVest algorithm thinks these are the best at the current time.
If you don’t want to think too much, you can head over there to pick stocks.
Is there a VectorVest mobile app?
Yes, there is.
Is it worth paying VectorVest $9.95 for a 30-day trial?
I think so. For less than $10, why not?
When you sign up for the 30-day trial, you get access to the “Successful Investing Quick Start Guide.”
It is surprisingly good.
While it goes over some tips on using the VectorVest platform, it also contains solid investment principles and even guides you in writing a trading plan.
For new investors, I think this alone is worth the trial.
I don’t mean to sound like a marketer, but if you find that it is not for you within 30 days, just call their support number, and they cancel your subscription without hassle.
At most, they might ask for a simple reason.
And all you have to do is to give them a simple answer.
Is it worth paying VestorVest the $69/month subscription rate?
If using VestorVest enables you to make profits over $69/month, then the answer is yes.
If you find that you are not even using VestorVest after subscribing, the answer is no.
Or, to put it another way: When you had your 30-day trial, did VestorVest tools enable you to make more than $69?
If yes, then the subscription is worth it for you. If not, then it is not worth it for you.
The answer will be different for everyone.
How are the Enhanced and Premium plans different from the Basic plan?
The basic plan is the lowest-cost subscription plan and has data updated once a day at the end of the day.
The Enhanced plan uses 15-minute delayed data and has the Advanced Trading Stop module.
The Premium plan uses real-time data and has all of the above plus ProTrader, AutoTimer, and WatchDog modules.
In addition, you get to participate in live coaching groups.
Conclusion
There is just so much to the VectorVest platform, including additional “add-ons” for an additional cost.
Even though this article has already been super long, I feel like I’ve barely touched the surface and did not even get around to talking about all the other VectorVest features available due to the limited space I have in this article.
VectorVest provides users with a range of tools to manage their portfolios, including trade alerts, position sizing, and risk management.
Additionally, the platform offers educational resources and support to help users develop their investment strategies and improve their trading skills.
Overall, VectorVest is designed to help investors save time and make better investment decisions by providing them with access to a wide range of market data and analysis tools.
We hope you enjoyed this VectorVest review.
If you have any questions, please send an email or leave a comment below.
Trade safe!
Disclaimer: The information above is for educational purposes only and should not be treated as investment advice. The strategy presented would not be suitable for investors who are not familiar with exchange traded options. Any readers interested in this strategy should do their own research and seek advice from a licensed financial adviser.


