

The “short strangle” (not to be confused with the “strangle” or the “long strangle”) is an options trade where the trader sells a call option and sells a put option of the same expiration.
Both the call option and the put option are out-of-the-money.
It is called the short strangle when these options are being sold.
It is called the long strangle when these options are being bought.
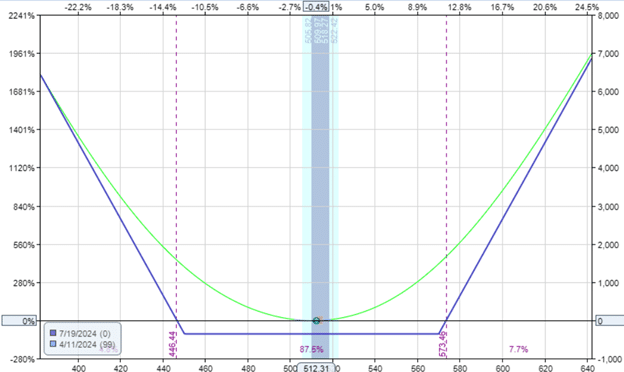
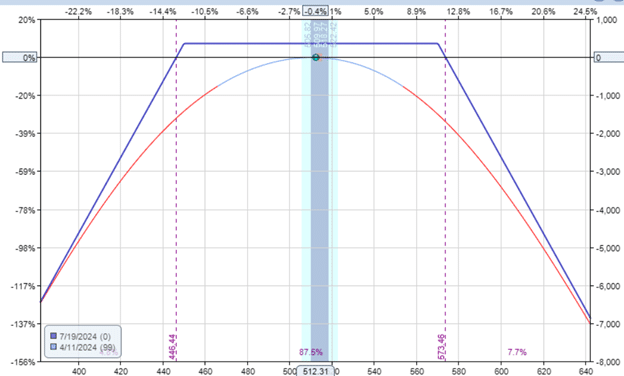
The expiration risk graph of the short strangle and long strangle are flipped images of each other.
This is a graph of the long strangle:
The following is a graph of the short strangle:
Contents
Introduction
Today, we are talking about the short strangle, which I prefer over the long strangle.
The reason is that I generally like to sell options to collect on the premiums rather than buying options.
The options seller has the benefit of time decay of the option, whereby if the option decays in value over time, the option seller profits.
This characteristic is noted by the trade having a positive theta.
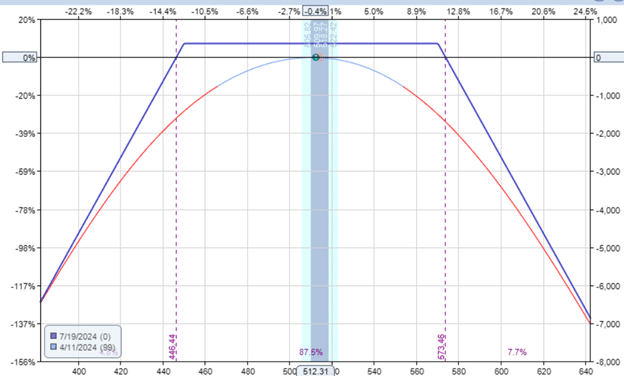
Look at the risk graph of the short strangle. It is reminiscent of the shape of the iron condor.
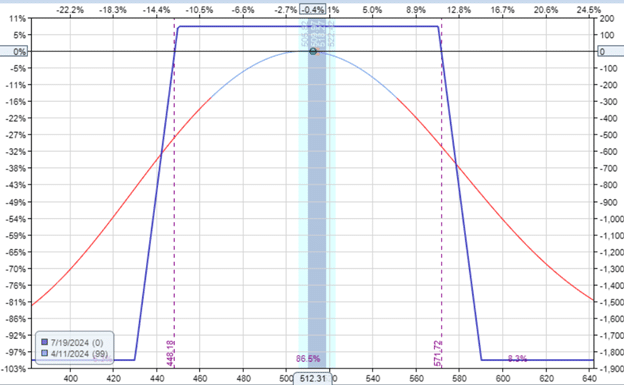
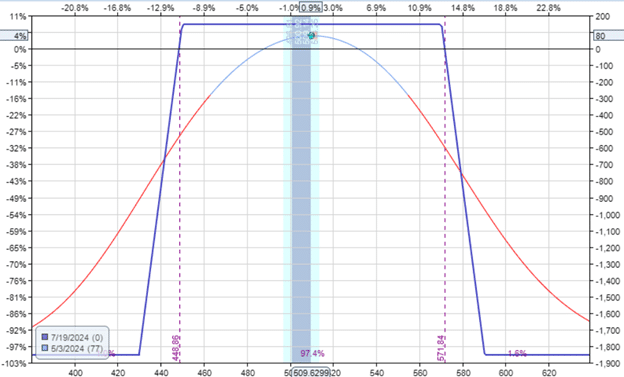
This expiration graph of the iron condor shows that the P&L (indicated on the vertical axis) does not go below the -$1850 loss level.
The iron condor is a defined risk trade with a maximum loss.
The short strangle is an undefined risk trade where the graph slopes down into negative P&L on both sides without end.
For this reason, undefined risk trades are not something that beginning traders should start with, as the trade can move against them very fast.
Iron condors would likely be more suitable.
The short strangle consists of a naked short call, requiring a high option-level privilege in an account to trade it.
We can, however, make the short strangle more conservative by going further out in time, like 90 days to expiration.
And plan to exit the trade before expiration.
Perhaps hold the trade only for 30 out of those 90 days.
This keeps the gamma of the trade low so that we are less affected by large market moves.
In addition, we will sell far out-of-the-money at the ten delta on the option chain.
So, the underlying price needs to move a lot before it reaches our short strikes.
Because this is a non-directional trade, we want an underlying that does not make large swings up or down in price.
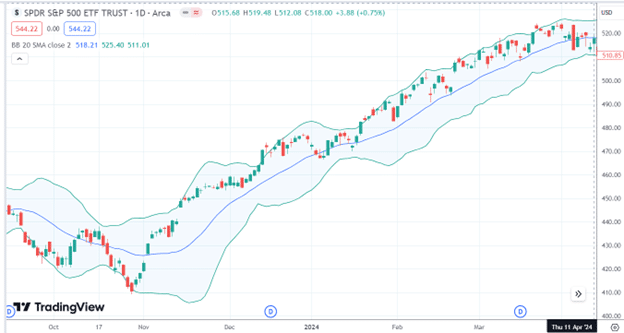
We will use the SPY ETF, which is composed of 500 stocks, and initiate the trade when the 20-day moving average is horizontally flat, and the price is in the middle of the Bollinger Bands, such as on April 11, 2024, for example:
Source: TradingView.com
An example trade might be the following with 99 days till expiration:
Date: April 11, 2024
Price: SPY @ 512
Sell one July 19 SPY 570 call @ $0.82
Sell one July 19 SPY 450 put @ $2.74
Credit: $355
Delta: -1.5
Theta: 8.13
Vega: -92
Gamma: -1.17
Theta/Delta = 5.42
How Do The Greeks Compare With The Iron Condor?
The Greeks of the Iron Condor, with the short options at the same strike and with 20-point wide wings, are:
Delta: -1.36
Theta: 2.7
Vega: -35
Gamma: -0.44
Theta/Delta = 2
As expected, the iron condor has less theta, vega, and gamma.
Define The Stop
Because the short strangle has no long options to stop its potential loss, we have to mentally determine our stop point before entering the trade.
For example, we might say that if our dollar loss exceeds twice the dollars initially collected, then we exit the trade – no questions asked.
Since we collected $355 initially if our P&L becomes -$710, we exit the trade.
For the profit target, if our P&L reaches $178 (half of the credit collected), we take profit and exit the trade.
This means that one loss would cancel out four winning trades.
For this strategy to be profitable, we need to win at least 80% of the trades. So out of ten trades, if we win eight and lose 2, we end up even money.
Traders who trade the short strangle would find their stop level, take their profit level, and record their win rates to determine what combination of parameters would work best for them.
This is when backtesting would come in handy.
Other traders might also add some adjustment strategies, such as closing or rolling one of the options based on certain triggers.
How Did The Short Strangle Turn Out?
This example trade turned out pretty well. At 22 days into the trade, the profit target was reached.
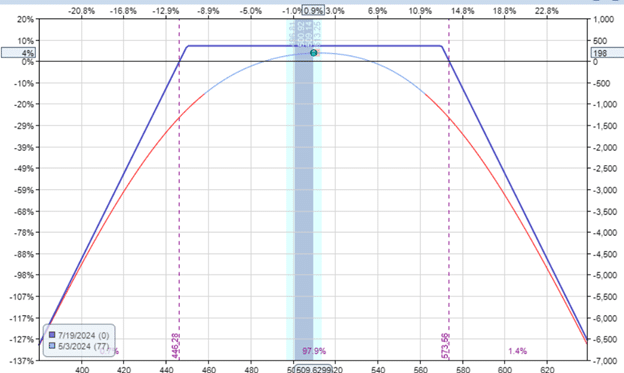
Perhaps this trade got lucky because SPY ended up nearly at the same spot it started with.
How About The Iron Condor?
Within the same time frame, the iron condor made $80.50, or 4.35%, with $1852 of capital at risk.
Final Thoughts
Have you ever wondered why they call it the “strangle”?
Look again at the risk graph.
It tapers to become more narrow – as if someone squeezed or strangled the graph at that point.
We hope you enjoyed this article on the short strangle option trade.
If you have any questions, please send an email or leave a comment below.
Trade safe!
Disclaimer: The information above is for educational purposes only and should not be treated as investment advice. The strategy presented would not be suitable for investors who are not familiar with exchange traded options. Any readers interested in this strategy should do their own research and seek advice from a licensed financial adviser.


Finally the strangle name is clear to me 🙂