
The inverse head and shoulders chart pattern is a technical chart formation that signals a potential trend reversal.
This bullish pattern consists of three troughs: a lower “head” between two higher “shoulders.”
The trade is on once the price breaks back above the formation line or neckline.
Contents
Traders often enter long positions when the price rises above the neckline and set stop losses below the right shoulder.
Combining this pattern with additional indicators, such as the Relative Strength Index (RSI) and the Moving Average Convergence Divergence (MACD), further validate and potentially enhance profitability.
What Is The Inverse Head And Shoulders
The opposite of the bearish head and shoulders chart pattern, the inverse head and shoulders is a bullish reversal pattern.
Similar to the head and shoulders, it contains both a right and left shoulder and a head in the middle; this is just turned upside down.
This can be a powerful pattern to recognize for a trader looking to play a potential reversal.
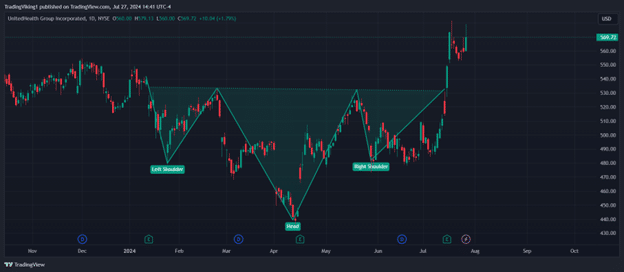
Take the chart above of UNH as an example; while it is not the cleanest example, this is more often than not what a real-world pattern will look like.
Price comes down in early 2024 and pivots back up, failing to make a higher high; this is the left shoulder.
It then spends the next several months slowly declining to form the low that will eventually become the head in the pattern.
The last step is that the price should not take out the high of the left shoulder before resuming a downward trend.
Look for the price to reverse someplace around the price that the left shoulder did, and you have the right shoulder forming.
As you can see above, neither shoulder formed a partially neat pattern, but they are still valid shoulders.
How Do You Trade The Inverse Head And Shoulders?
Now that we have all of the basics of the inverse head and shoulders let’s look at how to trade this pattern.
The traditional trade is to wait for the price to close above the neckline and enter the trade on the opening of the next candle.
Let’s look again at the UNH example above.
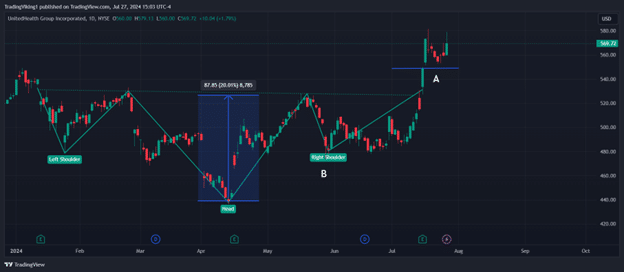
The entry on the chart is marked off with the word “A.”
Unfortunately, this pattern happened around earnings, and the entry was significantly higher than the neckline.
You would place your stoploss under the right shoulder, marked off by the white “B” on the chart.
For your take profit, you would look for the number of points from the trough of the head to the neckline.
In this case, it is roughly 88 points.
There is a second way to enter based on the inverse head and shoulder pattern that is more aggressive; however, it will get you into the trade significantly earlier than the normal trade.
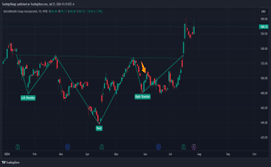
For the aggressive entry, you would look for the right shoulder to form and enter when the price closes above the halfway mark on the right shoulder, marked by the orange arrow.
Your stop would still be under the low of the right shoulder, and your take profit would still be calculated from the neckline.
Additional Indicators To Use When Trading This Pattern
One way to help confirm your entries and enhance the inverse head and shoulder strategy is to use additional indicators like the Relative Strength Index (RSI) and the Moving Average Convergence Divergence (MACD).
Relative Strength Index (RSI):
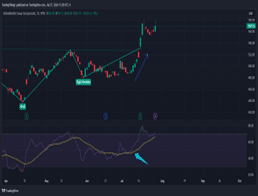
Adding the relative strength index to the inverse head and shoulder pattern is simple.
You only want to see two things to help confirm your entry.
First, you want to the index value over the moving average.
You can see an example here on the left.
The second thing you want to see is that RSI continuing to trend up.
It does not matter if the RSI is above the 70 threshold that is often used to show overnight.
It is strictly being used to confirm the strength of the move.
Moving Average Convergence Divergence (MACD):
Another common indicator that is added to confirm this trade is the Moving Average Convergence Divergence (MACD) indicator.
Adding the MACD is just as simple as adding the RSI, and similarly, you are looking for only two things to confirm the potential reversal.
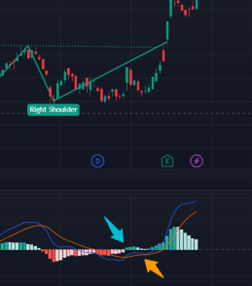
The first thing you are looking for is the MACD line cross-over to stay above the moving average.
This is shown in the image at the orange arrow.
At the same time, you are looking for the MACD histogram to move from red to green.
This shows a potential trend change;
The blue arrow shows this.
Adding In Options
We now have a solid understanding of the inverse head and shoulders and how to use some common indicators to enhance the setup.
Let’s look at how we can turbocharge this pattern using options.
Like the regular head and shoulders, buying an option is the simplest way to trade it.
You could purchase a call option at either of the two entry points and still use the right shoulder low as an exit.
Some of the issues here are the timing of the move, which strike to enter, and the fact that earnings and other high implied volatility events can artificially inflate the options price.
A potentially better solution is a trade that involves a short contract to help offset any potential premium decay.
Like the regular head and shoulders, credit or debit vertical spreads are very useful.
Both lock in your maximum loss and maximum gain but can help you directionally play a reversal without worrying about the underlying price overcoming both the inverse head and shoulders price pattern and the amount of money spent on the long option.
Whether you choose the credit or debit version of the spread is up to your trade plan and risk tolerance.
Finally, more exotic spreads like the ZEBRA strategy also work well.
The basics of this strategy are to achieve the options equivalent of 100 shares but with significantly less capital risk.
This strategy has unique challenges, though you can read more about the ZEBRA spread here.
Wrap Up
The inverse head and shoulders chart pattern is a powerful tool for traders to identify and capitalize on potential trend reversals.
It can provide a clear visual signal of a stock bottoming and, when combined with additional indicators and options, can become a powerful way to trade.
Options strategies such as the vertical spread or the ZEBRA spread can dramatically increase profitability while cutting some potential risks if the pattern fails.
We hope you enjoyed this article on the inverse Head and Shoulder chart pattern.
If you have any questions, please send an email or leave a comment below.
Trade safe!
Disclaimer: The information above is for educational purposes only and should not be treated as investment advice. The strategy presented would not be suitable for investors who are not familiar with exchange traded options. Any readers interested in this strategy should do their own research and seek advice from a licensed financial adviser.


