


Today, we are looking at fractals trading.
You will learn what it is and how we can relate it to our trading.
You will also learn why fractals market theory is an alternative to the efficient market hypothesis.
Contents
- Introduction
- Sierpinski Triangle
- How Does That Relate To Trading?
- Is The Market Random?
- The Fractal Market Hypothesis As An Alternative To The Efficient Market Hypothesis
- Can The Market’s Direction Be Predicted With Enough Accuracy To Make Some Profit?
- Conclusion
Introduction
The fractal markets theory, also known as the fractal markets hypothesis, is the concept that the stock market has mathematical fractals and chaos theory characteristics.
We will get into what that actually means later in this article.
Edgar Peters popularized the fractal market theory in his 1994 book titled Fractal Market Analysis: Applying Chaos Theory to Investment and Economics.
He explains fractal geometry nicely when he writes that fractal geometry “is characterized by self-similarity and increased complexity under magnification.”
While it sounds very philosophical when he writes that:
“In fractal time, randomness and determinism, chaos and order coexist.”
What it simply means is the markets have global structure as well as local randomness at the same time.
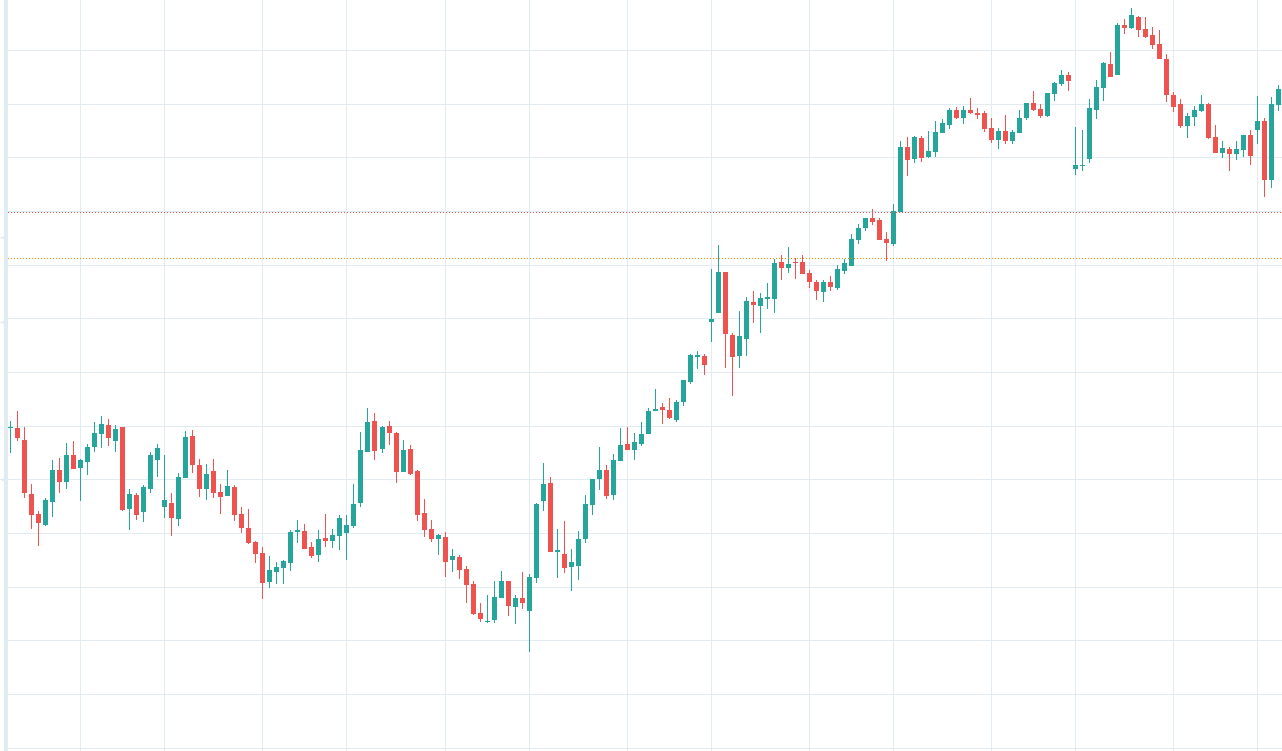
If you see an asset in a trend, as in this daily chart of SPX.
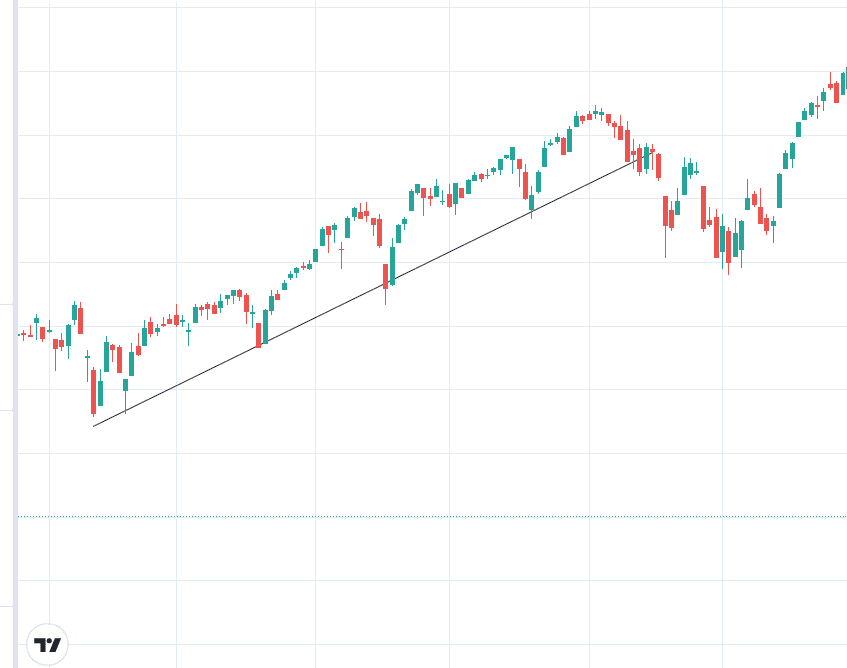
source: tradingview.com
You would say that there is structure.
That is why traders can “buy the dip.”
They see that structure and assume it will hold (at least until they complete their trade).
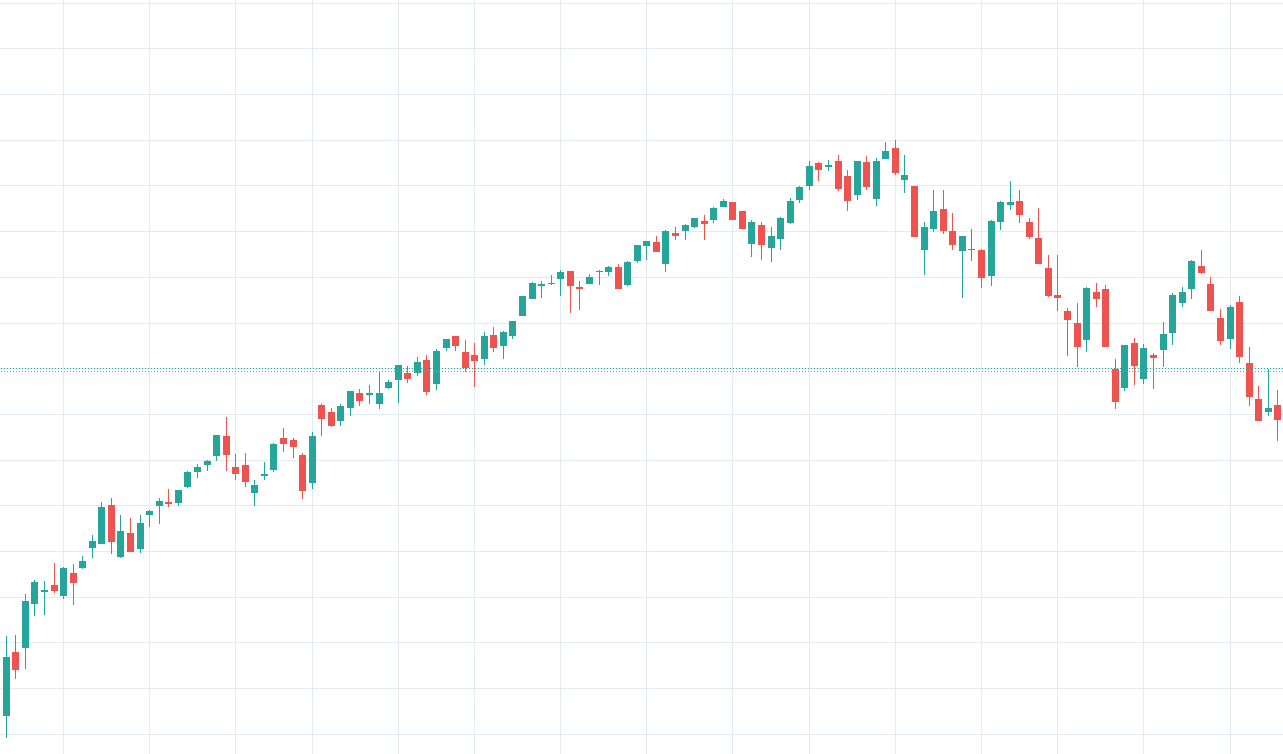
However, when you look at the same chart under magnification, you will see that it has randomness.
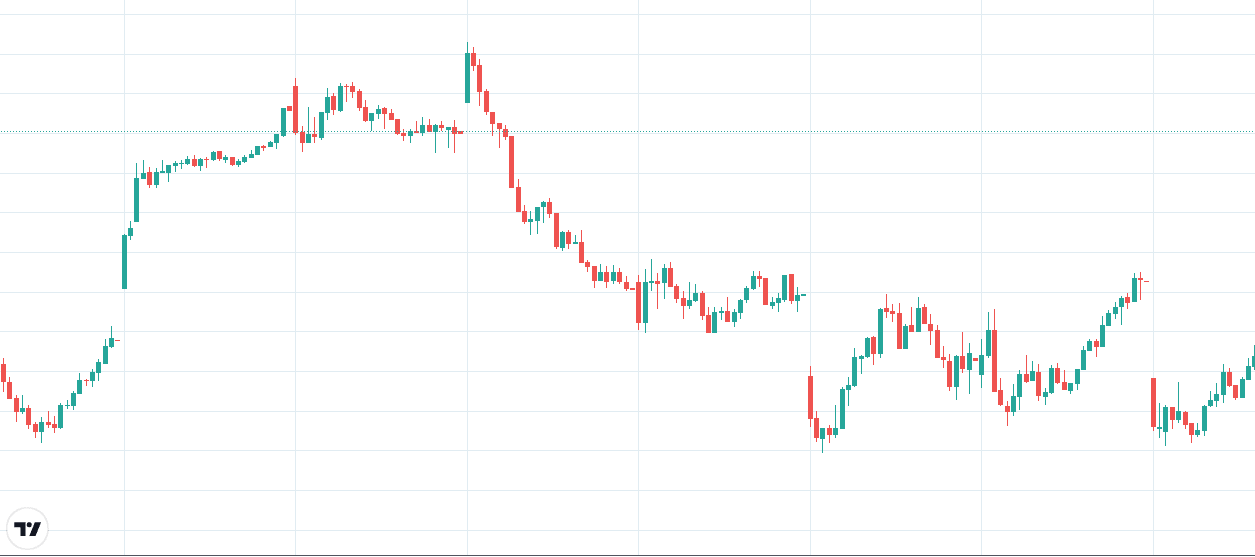
source: tradingview.com
This is a 15-minute chart from a section of that trend.
Movements Are Random On A Small Time Frame
The price movements in a small timeframe are quite random.
Yet over a larger timeframe, this randomness creates a pattern that can be clearly seen.
This is the concept of chaos theory, that order can come from randomness.
We see this in nature all the time.
The position of each sand on a beach is random.
Yet the aggregate of all those random positions can produce a stable shoreline that can be charted on a map.
From the flip side perspective, we can say that things we see as stable structures are really composed of random entities.
We see a tree. Everyone recognizes it as a tree because it has a “tree structure.”
However, each tree is built from random elements of branches and leaves that are different from every other tree.
How can completely random events (such as you or me deciding to buy or sell a particular stock at a particular time) create stable and recognizable patterns?
Sierpinski Triangle
A common example that is given is the Chaos Game.
- Start with an equilateral triangle.
- Pick a random point inside it.
- Pick randomly one of the three vertex points.
- Plot a dot halfway from the last point to the vertex.
- Repeat steps 3 and 4.
What you end up with is the Sierpinski Triangle:
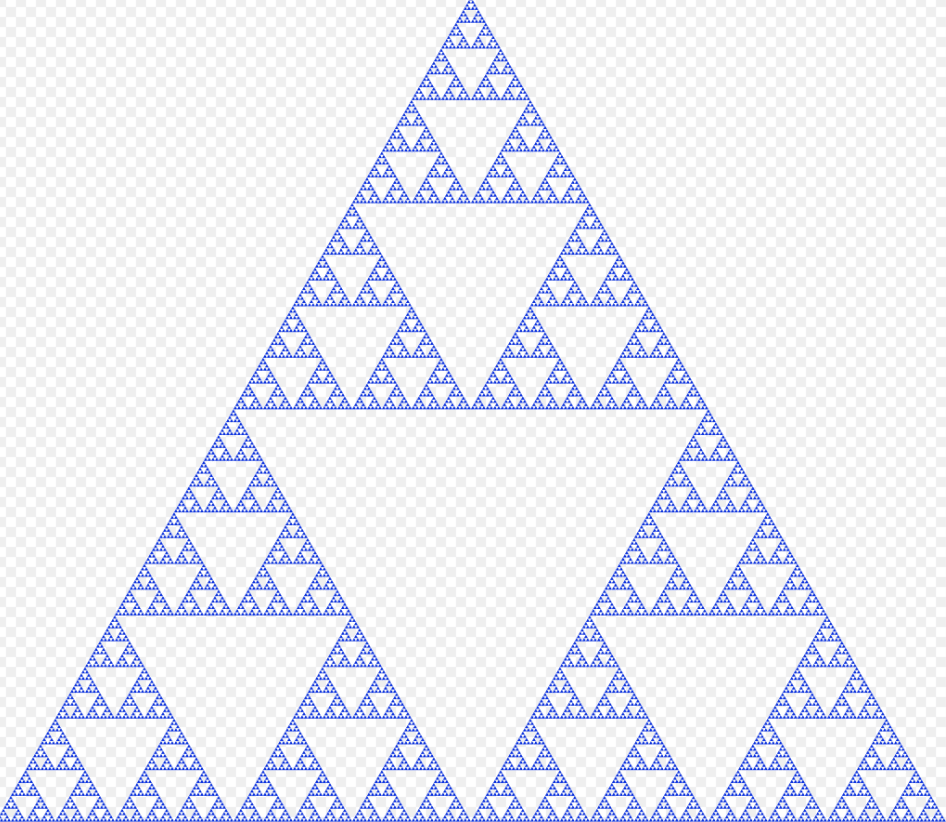
source: Sierpiński triangle. (2022, October 21). In Wikipedia.
Repeat this game many times, and you always get the same picture.
While the sequences of dots drawn are random, the end result is the same pattern that emerges.
Not only that, but it also exhibits “self-similarity.”
If you zoom in on the picture at whatever magnification level, it looks like the picture itself.
This is what is known as a fractal.
The fractal markets theory posits that price movement over time exhibits fractal characteristics.
This would apply to both the vertical up-and-down price movement of an asset on a price chart as well as the price movement in time across the horizontal axis.
How Does That Relate To Trading?
Imagine a trader trading on the 15-minute chart.
All of a sudden, there is a two-standard deviation drop in the stock price (probably due to some random news or something).
To the trader, this is like a scary market crash.
It might trigger all the stops, and the stock is sold.
However, to the trader trading the daily chart, that drop was not scary at all.
It is just a small dip. In fact, it is a buying opportunity.
So, while all the 15-minute traders are selling the stock, all the daily-chart traders are buying the stock.
This diversification of traders on different timeframes keeps the stock price stable.
The panic in the 15-minute timeframe is absorbed by the longer-timeframe traders making the market stable.
If all investors and traders were on the 15-minute chart, then all of them would be selling at the same time.
The price would crash and be unstable.
What does that mean to the options trader?
It means that if you are trading short DTE (days to expiration) trades, it is wise to have other longer-DTE trades so that if the short-term trades completely fail due to some random event, then the longer-DTE trades can absorb that shock and keep your portfolio P&L stable.
While stock investors talk about asset diversification, when options have varying lengths of timespan, the options trader also talks about time diversification.
Is The Market Random?
Yes and no.
On a local level, it is random. On the global level, that randomness can produce structures that are not random (at least not 100% random).
If the market was completely and 100% random, it would be impossible for anyone to profit from trading, just like it is impossible to profit from a fair coin toss.
I have seen traders and investors that are consistently profitable; therefore, the market can not be 100% random.
Yet anyone who has traded the markets knows that there are random elements at play.
Human decisions to buy or sell are affected consciously or subconsciously by memory.
This memory throws a bit of determinism into the market, making it not 100% random.
Imagine an investor who bought a stock at $100, hoping it would go up. But instead, it went down to $80.
The investor curses and says, “This stupid stock, I’m going to get rid of it as soon as I get my money back.”
Then through mostly random events, the stock gets back to $100.
The investor sells the stock at $100. To the investor, that price point of $100 was not a random price.
That selling point was affected by the investor’s memory of the price at which the price was bought.
For a series of events to be completely random, each event cannot be affected by past events.
Here the investor selling at $100 was affected by the past event of the investor buying at $100.
A coin toss is completely random because the result of a previous toss does not affect the current toss.
The Fractal Market Hypothesis As An Alternative To The Efficient Market Hypothesis
The efficient market hypothesis states that all market prices reflect all known information and are always at fair market value.
Therefore, it is impossible to profit from trading, whether done by technical or fundamental analysis.
The fractal market hypothesis is an alternative view that states that the market is not completely random.
It can exhibit stable structures via the mechanisms previously mentioned.
Because it is not completely random, it is possible to profit from the markets.
Can The Market’s Direction Be Predicted With Enough Accuracy To Make Some Profit?
Yes, and no.
On small timeframes, the market moves are quite random and are difficult to profit from.
However, lengthening the time horizon increases the probability that some non-random structure appears.
Have you ever heard a longer-term investor say, “No, I don’t day trade because those shorter timeframes have too much noise.” What they refer to as “noise” is the randomness of the price action.
This is not to say that day trading can not be profitable.
Day traders would argue that they are not trading small timeframes. Small timeframes to them are 1-minute and ticks.
They are trading the longer-time frames, such as the 15-minutes to one-hour charts, in which they can see structures that they would not otherwise see in shorter one-minute timeframes.
Remember that markets are fractals, and hence they have self-similarity.
Below is the 15-minute chart that a day trader sees:
This is the weekly chart that a long-term investor sees
It takes nearly 2000 candles (1950 to be exact) in the first chart to make up one candle in the second chart.
Yet, one would be hard-pressed to tell them apart.
The day trader will say that trading by their charts is no different than the longer-term investor trading their charts.
They are the same.
It has been hypothesized that the longer-term trader will see just as many three-standard deviations moves as the day trader sees on their chart.
One difference between the two charts is the gaps because the regular trading sessions of equities and options markets are open only six and a half hours on weekdays.
There are overnight gaps in the first chart and weekend gaps in the second chart.
You will find that the overnight gaps on the 15-minute charts are typically larger than on the weekly chart.
That is one reason day traders don’t hold their trades overnight.
What About Option Traders?
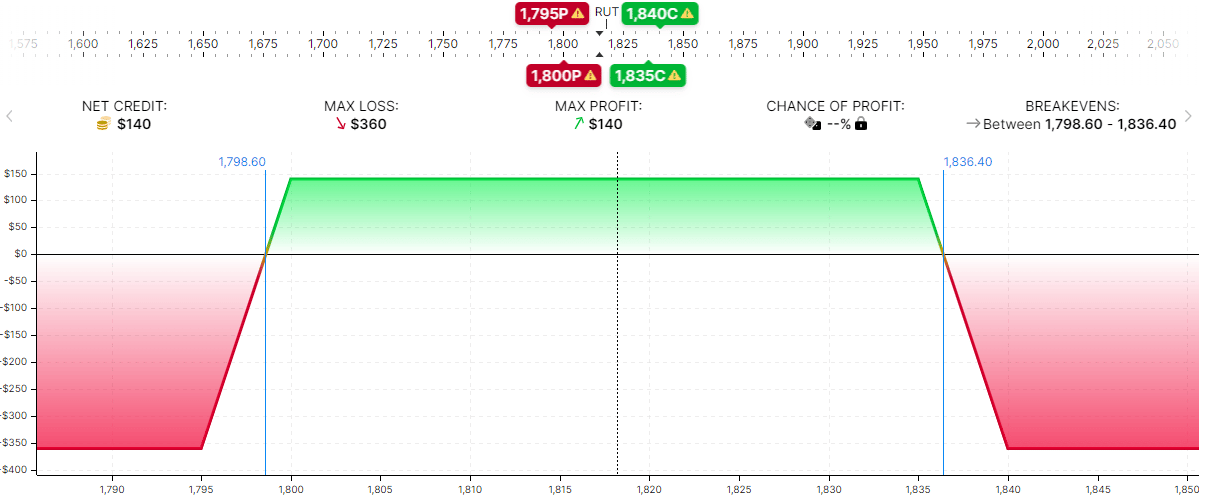
Now let’s look at the options trader.
Here is a risk graph of a zero-DTE (days to expiration) iron condor selling the shorts at the 18-delta and buying the longs at around the 12-delta.
Here is the risk graph of a 64-DTE iron condor selling and buying around the same deltas.
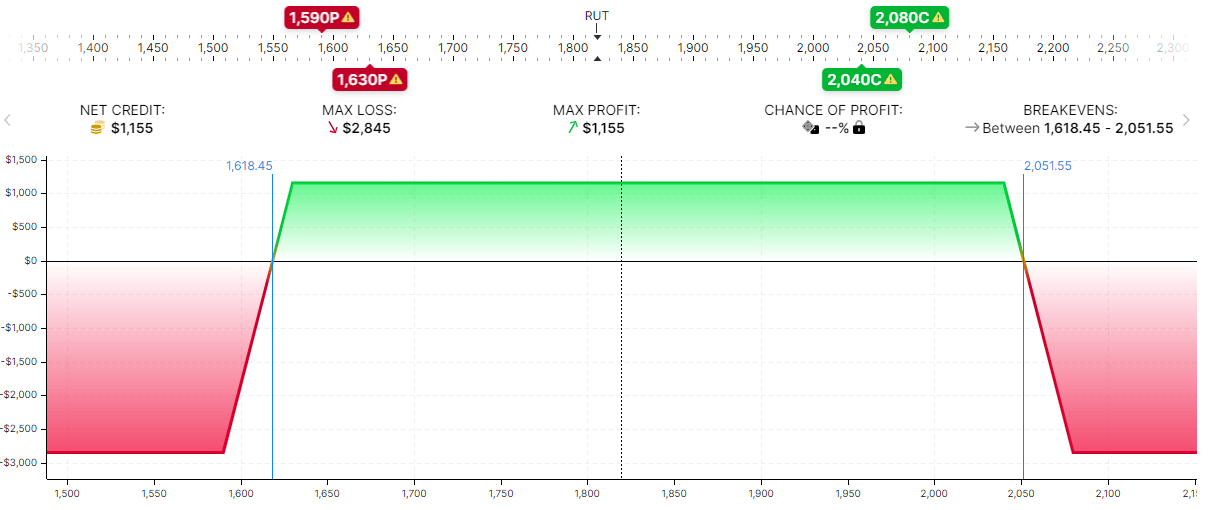
The graphs look quite similar. They both have a risk-to-reward ratio of 2.5.
The 0-DTE iron condor traders will say this is no different than trading the 64-DTE, except that things happen at a much faster timescale, so they must watch the chart constantly.
In contrast, the 64-DTE trader can monitor the chart daily.
We say that the market exhibits self-similar statistical structures.
Conclusion
A common question that is asked is whether markets are random.
Now you know the answer — that is, if you believe in the fractal market hypothesis.
A hypothesis is a proposed explanation that has not been proven.
So, we leave it up to you to decide.
We hope you enjoyed this article on the fractals trading.
If you have any questions, please send an email or leave a comment.
Trade safe!
Disclaimer: The information above is for educational purposes only and should not be treated as investment advice. The strategy presented would not be suitable for investors who are not familiar with exchange traded options. Any readers interested in this strategy should do their own research and seek advice from a licensed financial adviser.


