


Today we’re going to look at the bear call spread option payoff graph (a.k.a. bear credit spread or call credit spread). This is designed for beginners so they can develop a basic understanding how to read the payoff graphs.
We’ll look at:
Contents
- Bear Call Spread Option Basics
- Bear Call Spread Option Payoff Graph
- Different Scenarios At Expiration
- Payoff Graph At Interim Dates
- How Changes In Volatility Impact The Payoff Graph
- Bear Call Spread Option Payoff Summary
Bear Call Spread Option Basics
A bear call spread is one of the easiest option trades and a great place for beginners to start their learning journey.
It is a type of vertical spread and is the sister trade to the bull put spread.
A bear call spread is 2 contracts between a buyer and seller.
It is an options strategy that is used when the investor expects a moderate drop in the price of the underlying asset.
At worst, the trader believes that the stock will not rise by too much.
The strategy uses two call options to form a range consisting of a high strike price and a low strike price
Bear Call Spread Option Payoff Graph
Understanding payoff graphs (or diagrams as they are sometimes referred) is absolutely essential for option traders.
A payoff graph will show the option position’s total profit or loss (Y-axis) depending on the underlying price (x-axis).
Here is an example:
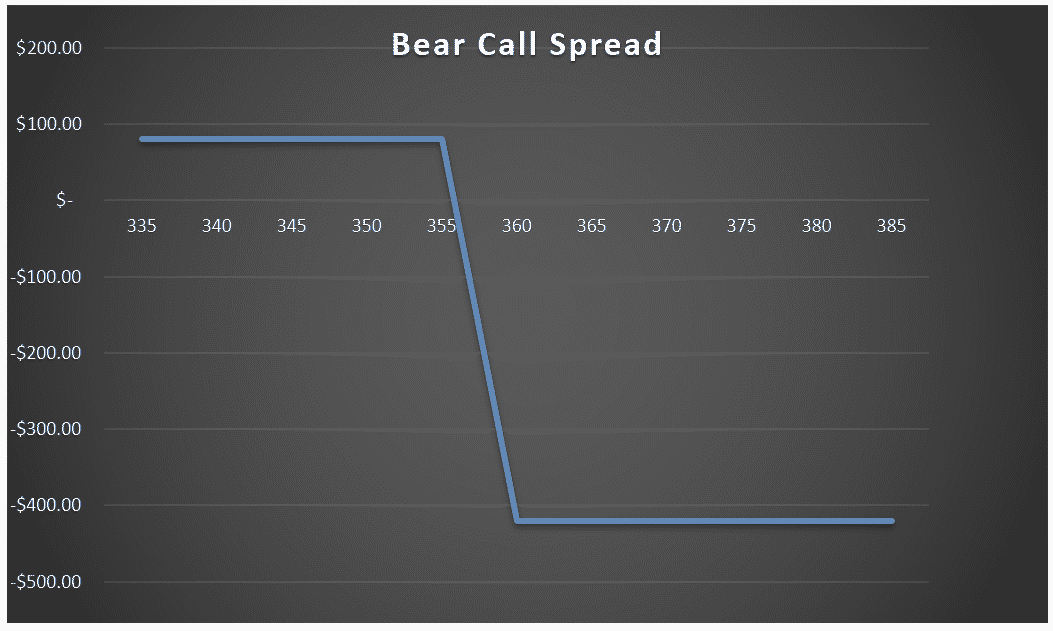
What we are looking at here is the payoff graph for a bear call spread option strategy.
In this example the trader has sold a $355 strike call and bought a $360 strike call for a net $0.80 per contract (or $80 for a standard option contract representing 100 shares).
The premium collected of $80 is the most the trade can profit. That occurs at an underlying stock price of $355 and below.
Above the strike price of $355, the line slopes downward as the payoff decreases in proportion with the stock price. At and above $360 is where the max loss is at expiration.
The lines crosses into loss at a certain point when the stock price rises above the breakeven point.
The breakeven point is simply the short strike price plus the premium collected. In this case it would be:
If the premium collected had been slightly higher at $1.50, then the breakeven price would be $356.50
Different Scenarios At Expiration
Four different scenarios can occur at expiration for a bear call spread trade.
-
Underlying stock price is below the short strike price
This is the ideal scenario that the trader was hoping for. If the underlying stock price is below the short strike price at expiration, the bear call spread will expire worthless.
The profit for the trade will be equal to the premium collected.
In our example, this would be $0.80 per contract or $80 in total.
The trader can either let the calls expire worthless or buy the spread back in the market for a profit.
-
Underlying stock price is above the short strike price but below the breakeven price
If the stock is above the short strike price at expiration, the trader may think the trade has a loss, but unless it gets above the breakeven price, it will not end in a loss.
For example, let’s say the stock ends at $355.50.
The $355 strike short put option has $0.50 of loss and the short leg option will be assigned to sell the underlying shares.
The $360 strike long call will expire worthless.
However, the $0.50 of loss is less than the $0.80 collected, so in this scenario, even though the short call option has a loss at expiration, the trader has profit $0.30 per contract.
-
Underlying stock price is above the breakeven price but below the long strike price
If the stock is above the breakeven price at expiration, the trader may think the trade has a max loss, but unless it gets above the long strike price, it will not end in a max loss.
For example, let’s say the stock ends at $357.
The $355 strike short put option has $2 of loss and the short leg option will be assigned to sell the underlying shares.
The $360 strike long call will expire worthless.
But, the $2 of loss is less than the max loss of $5 minus $0.80 collected, so in this scenario, even though the short call option has a loss at expiration, the trader has loss of only $1.20 per contract compared to max loss of $4.20.
-
Underlying stock price is above the long call price
If the underlying stock price is above the long strike price at expiration, the bear call spread will be in the money for both strikes. The loss for the trade will be equal to the width of the strike minus premium collected.
In our example, this would be $4.20 per contract or $420 in total.
The good thing about a bear call spread is that the loss is limited to the width of the spread minus premium collected, so it doesn’t matter how high the stock goes, the most the trader can lose is the $420 in this example.
Payoff Graph At Interim Dates
So far, we’ve only considered the payoff graph at expiration. The payoff graph at interim dates will look very different and will be impacted by factors such as time decay and implied volatility.
Calculating the profit and loss at expiration is quite simply, using excel or even in your head if you are half decent at maths.
Calculating profits and losses at interim dates is much more complex and requires more advanced software than just Excel.
Any decent options broker will have the ability to show option profits and losses at interim dates.
The below bear call spread option payoff is from Interactive Brokers.
The bear call spread option was an AAPL 125/130 strike call sold for $1 per contract or $100 in total. The breakeven price at expiration is $126 (short strike price plus the premium collected).
The blue line shows the expiration payoff that you are now familiar with and the purple line shows what is known as a “T+0” line.
T+0 simply means, what does the trade look like as of today?
Notice that the breakeven price as of today is the current AAPL price. This makes sense because we just sold the bear call spread so wouldn’t expect to have made or lost any money yet.
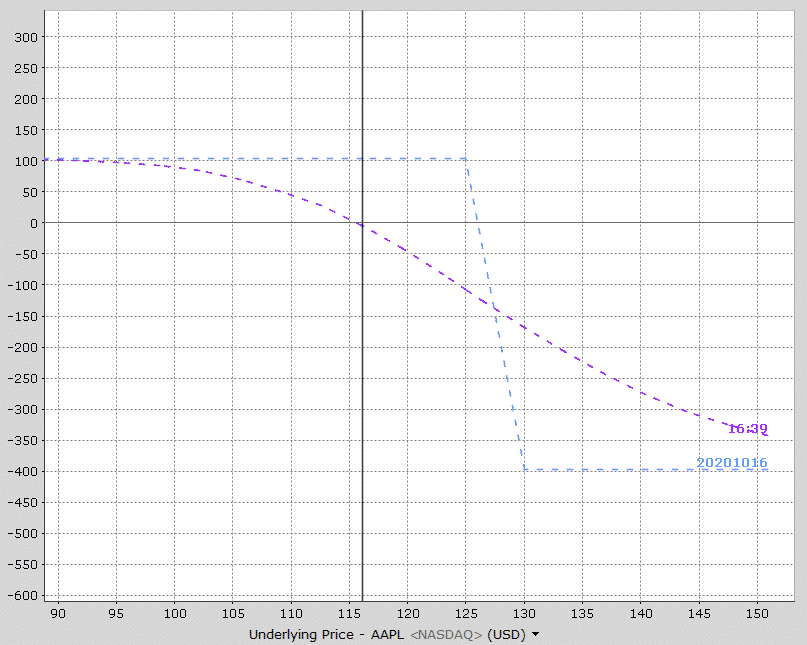
Notice also that loss occur much before the expiration breakeven price and below 125, the profits are not the maximum profit.
As time goes by, the interim line slowly moves towards the expiration line.
Here’s how the payoff diagram is estimated to look at one week before expiration.
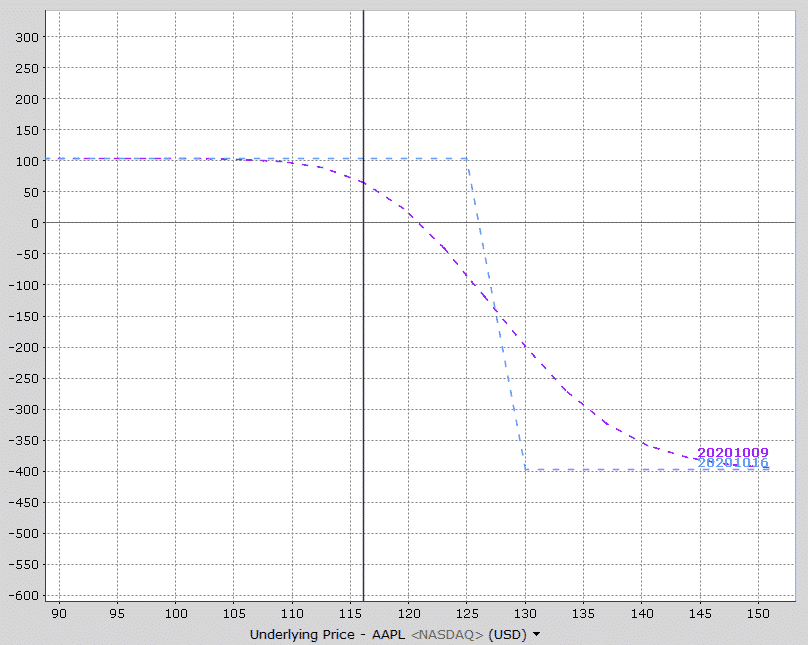
See how the purple line is now much closer to the expiration payoff line?
Most brokers will be able to provide this sort of graphical information for you.
I also like to use Option Net Explorer because they can show multiple interim date lines.
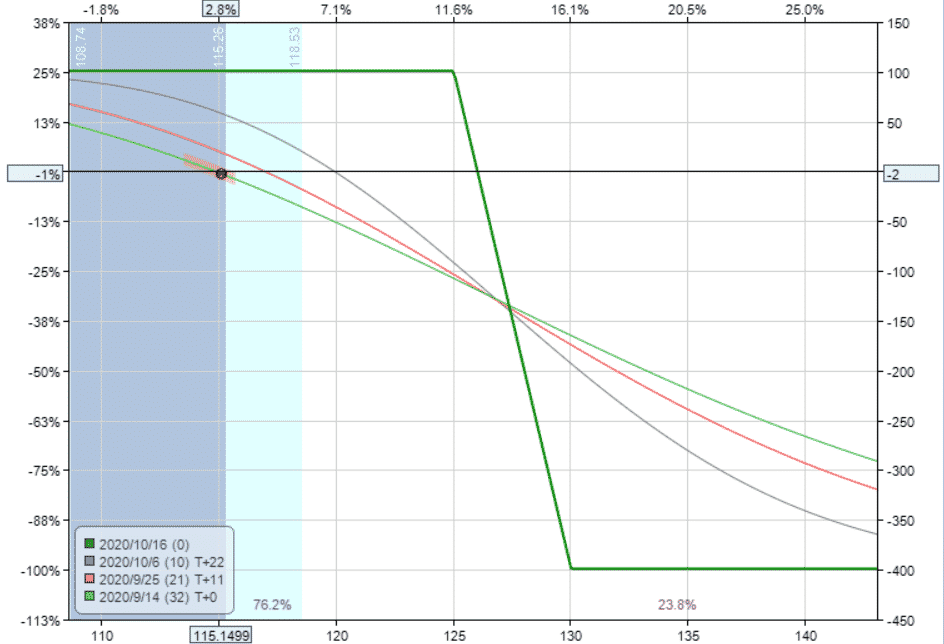
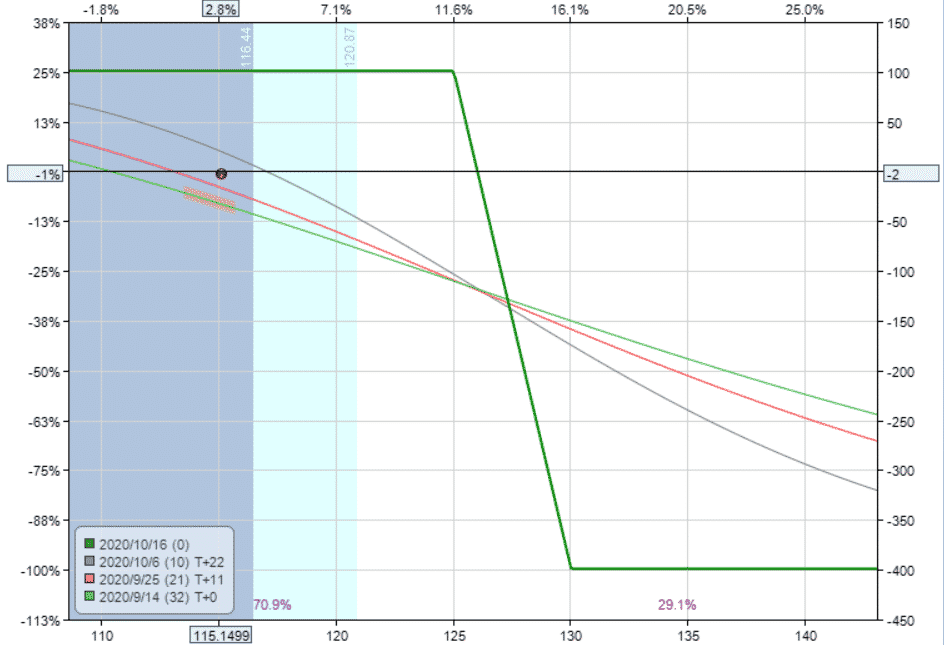
Looking at the payoff graph below, notice that there are three interim lines – T+0, T+11 and T+22. This gives the trader a good appreciation of how the trade will progress over time after 11 days and 22 days.
How Changes In Volatility Impact The Payoff Graph
Changes in implied volatility will not have any impact on the payoff graph at expiration, but it will impact the interim dates.
A bear call spread strategy has negative vega, meaning that it will benefit from an decrease in implied volatility after placing the trade.
This AAPL trade example has vega of -2 which means that for every 1% drop in implied volatility, the trade will make $2 with all other factors being equal.
The opposite is true if implied volatility rises.
Let’s take a look at how a 20% drop in volatility impacts the interim lines.
Notice that the expiration line hasn’t changed at all, but the interim lines have all moved higher.
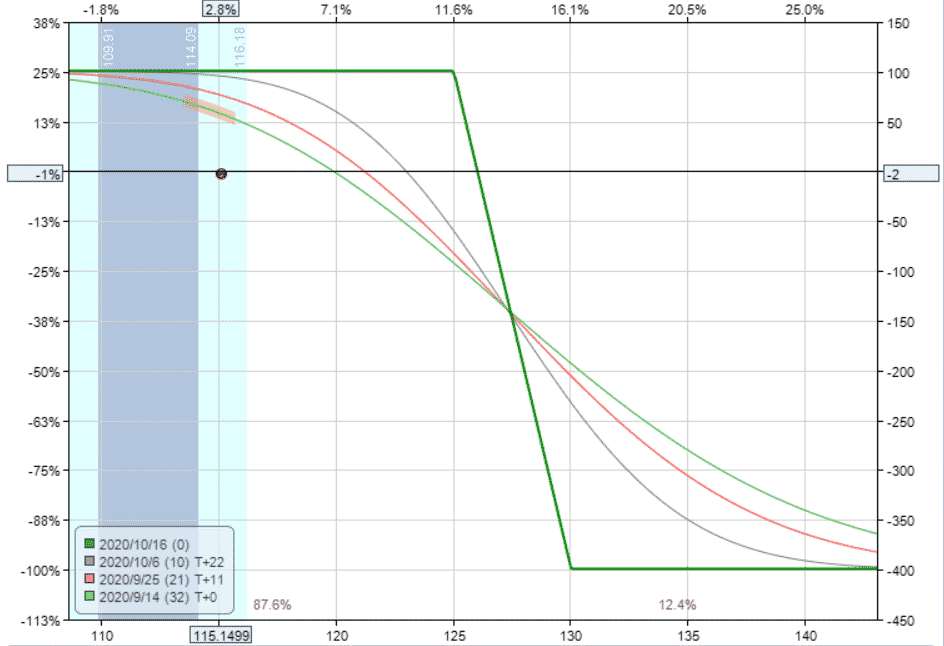
Now, let’s see how the diagram changes assuming a 20% rise in volatility. All the interim lines have dropped significantly.
With a bear call spread strategy, delta is the main driver of the trade, but we can clearly see that big changes in implied volatility will also affect the trade.
Bear Call Spread Option Payoff Summary
You should now be intimately familiar with the bear call spread option payoff graph. Let’s summarize some key points.
- Bear call spreads are a bearish strategy with limited risk and limited upside
- The maximum loss is equal to the width of the strikes minus premium collect
- The breakeven price is equal to the short strike price plus the premium collected
- The position will gain value as expiration approaches due to time decay provided the stock price is below the short call.
- Above the long call time decay begins to hurt the trade.
- As a negative vega trade, decreases in implied volatility will help the trade, but only at interim dates
If you’re still having trouble or want to learn more about these concepts, you can check out this 12,000 word beginners guide to options.
Trade safe!
Disclaimer: The information above is for educational purposes only and should not be treated as investment advice. The strategy presented would not be suitable for investors who are not familiar with exchange traded options. Any readers interested in this strategy should do their own research and seek advice from a licensed financial adviser.


