








Contents
- Broken Wing Butterfly On SPX
- Diagonal On SPX
- Result Of An Up Move 6 Days Later
- Broken Wing Butterfly In QQQ
- Diagonal In QQQ
- Broken Wing Butterfly In A Down Move
- Diagonal In A Down Move
- Pre-Earnings Trades
- When To Choose Each Strategy
- FAQ
The broken wing butterfly (BWB) option strategy and the diagonal option strategy may appear quite similar on an expiration payoff graph.
However, key differences emerge when you look at the option Greeks and how each responds to changes in volatility.
It’s also important to factor in how easily each strategy can be adjusted or exited.
Broken Wing Butterfly On SPX
The butterfly has three different option strikes expiring on the same expiration.
We sometimes say that it has three-legged options.
However, there are four contracts in the butterfly.
One long contract at the upper strike.
Two short contracts at the middle strikes.
And one long contract at the bottom strike.
All of these contracts can be structured entirely as puts or entirely as calls.
Let’s look at an all-put options broken wing butterfly on SPX:
Date: Jan 2, 2026
Price: SPX @ 6858
Buy one contract Jan 23 SPX 6675 put
Sell two contracts Jan 23 SPX 6790 put
Buy one contract Jan 23 SPX 6660 put
Net Debit: -$255
Max risk: $5255
Max reward: $7500
Reward-to-risk ratio: 1.4
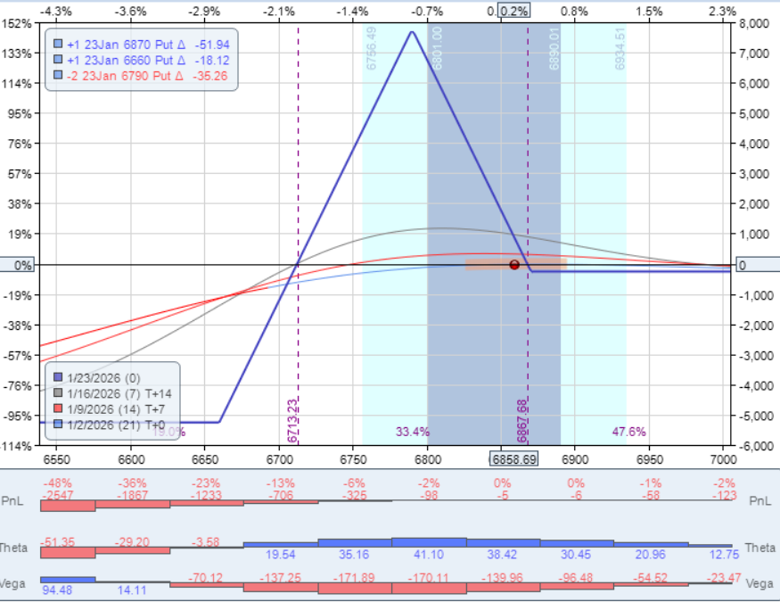
We are starting these trades delta neutral.
Both the butterfly and the diagonal profit from positive theta time decay.
Delta: 0.46
Theta: 37.31
Vega: -132.9
Note for later: the BWB has negative vega, which means the trade should benefit when implied volatility (IV) drops.
Diagonal On SPX
The diagonal only has two option strikes (two legs).
The two options have different expiration dates.
Date: Jan 2, 2026
Price: SPX @ 6858
Sell one contract Jan 23 SPX 6800 put
Buy one contract Jan 30 SPX 6780 put
Net Debit: -$1045
Max Risk: $3045
Max Reward: $2700
Reward-to-risk ratio: 0.9
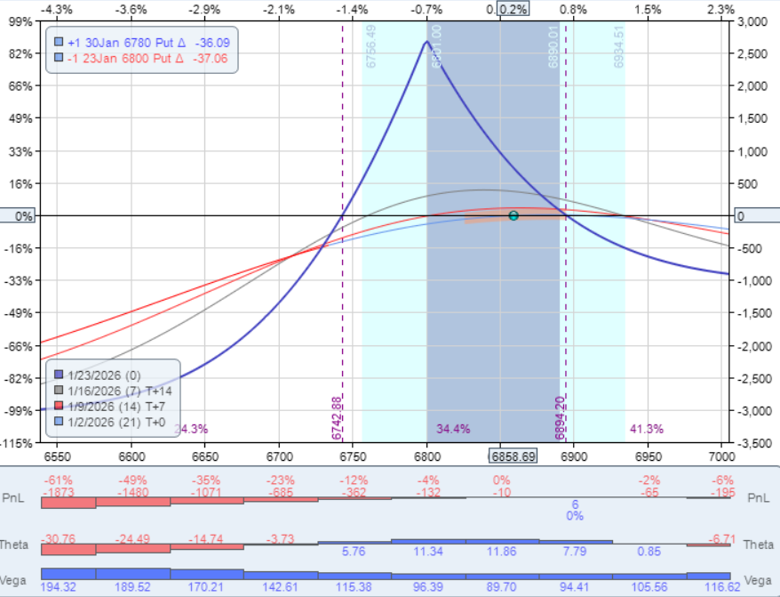
Delta: 0.97
Theta: 11.45
Vega: 89.80
The difference in the options Greeks is that the diagonal has positive vega, which, in theory, means that the trade benefits when IV goes up.
Result Of An Up Move 6 Days Later
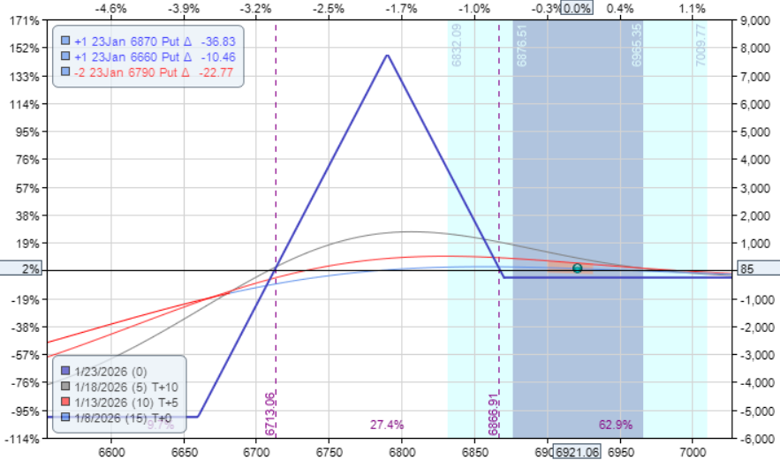
On Jan 8th, the BWB had $85 in profits and a 2% return on capital.
The diagonal had better returns, with an 8% gain and $240 in profit…
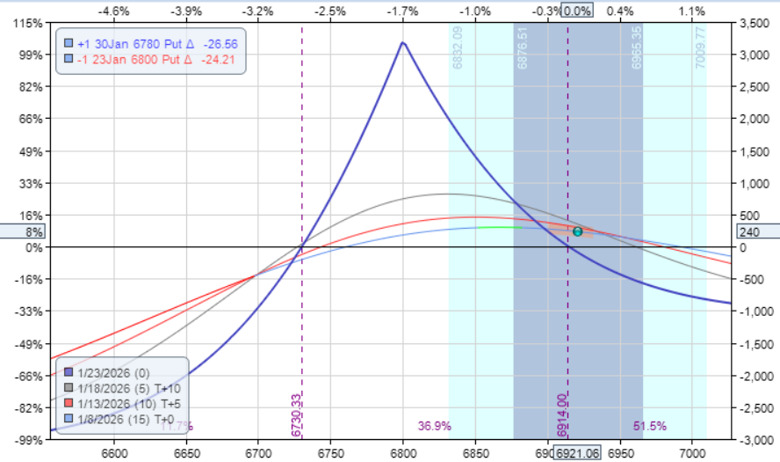
While the expiration graph on the BWB never changed, the expiration graph on the diagonal expanded over the course of the trade.
Note that the diagonal’s expiration graph had a peak reward of $2700 at the start of the trade.
Now, its graph shows a peak reward of $3200.
Its graph had lifted up, which had also pulled up the intermediary profit lines.
Options structures such as the BWB with all legs expiring at the same cycle will have fixed expiration graphs.
Time spreads, such as the diagonal with legs of varying expirations, will have expiration graphs that can change during the course of the trade – sometimes in our favor and sometimes against us.
In particular, its graph is affected by changes in implied volatility (IV) for the two legs: the near-term and far-term expirations.
One might think that as the price of the underlying goes up, the implied volatility would go down.
That’s generally the case, but not in this instance – perhaps because the IV is already near the bottom when the trade started.
In this case, when SPX went up, the IV, as measured by the VIX (the volatility index of SPX), also went up from 14.9 to 15.5 during the course of the trade.
The diagonal benefited from this increase in volatility, given its positive vega.
The theory assumes that both the short option and the long option IV change at the same rate, which in reality they sometimes do and sometimes don’t.
When the trade started:
IV of the short put: 11.51
IV of the long put: 12.51
6 days later:
IV of the short put: 12.75
IV of the long put: 13.87
The IV of the short put had increased 1.24.
The IV of the long put had increased by 1.36.
So in this case, both legs increased at about the same rate.
This increase in IV had lifted the profit lines, boosting the diagonal’s profits.
The BWB, which fixed expiration graphs, is less affected by volatility changes.
Broken Wing Butterfly In QQQ
Let’s look at another rally.
This time in QQQ (an ETF for the Nasdaq), volatility dropped as the price rose.
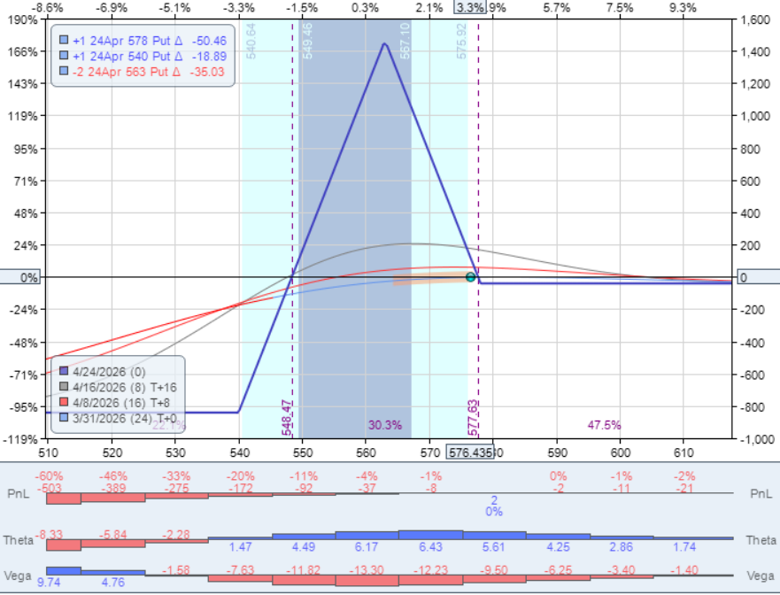
The BWB on QQQ:
Date: March 31, 2026
Price: QQQ @ $576.43
Buy one contract Apr 24 QQQ $578 put @ $14.71
Sell two contracts Apr 24 QQQ $563 put @ $9.56
Buy one contract Apr 24 QQQ $540 put @ $4.82
Net Debit: -$41
Max risk: $842
Source: OptionNet Explorer
Delta: 0.70
Theta: 5.99
Vega: -10.60
Diagonal In QQQ
Date: March 31, 2026
Price: QQQ @ $576.43
Sell one contract Apr 24 QQQ $550 put @ $6.51
Buy one contract May 1st QQQ $545 put @ $7.26
Net Debit: -$75
Max risk: $575
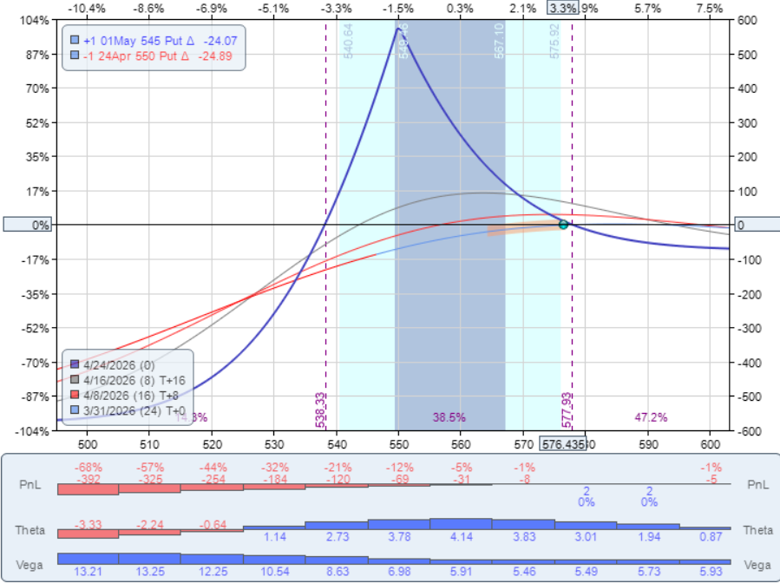
Delta: 0.82
Theta: 3.34
Vega: 5.44
Both trades begin with a near-neutral delta and positive theta.
The key difference is that the broken wing butterfly (BWB) carries negative vega, while the diagonal has positive vega.
However, since delta is the primary driver of P&L, the difference in vega didn’t have a meaningful impact in this case, even as volatility declined sharply during the trade – as we shall see.
Eight Days Later
QQQ moved up hard.
On the 8th day of the trade, it is already up by 26 points, which is more than a one-standard-deviation move.
Implied volatility had dropped significantly (as was expected in an up move).
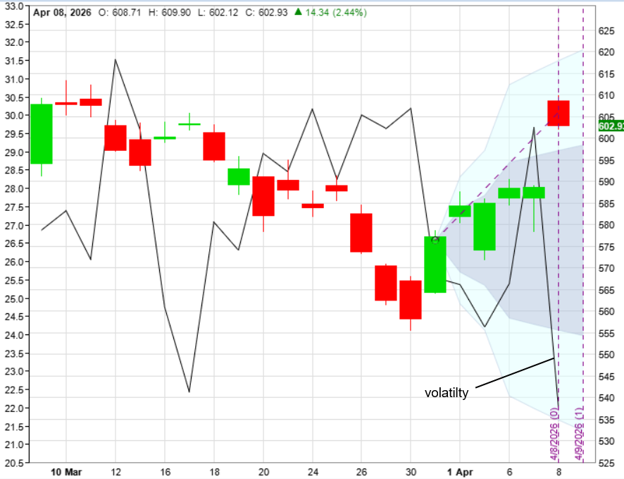
The BWB was at breakeven with a P&L of $2 as shown below…
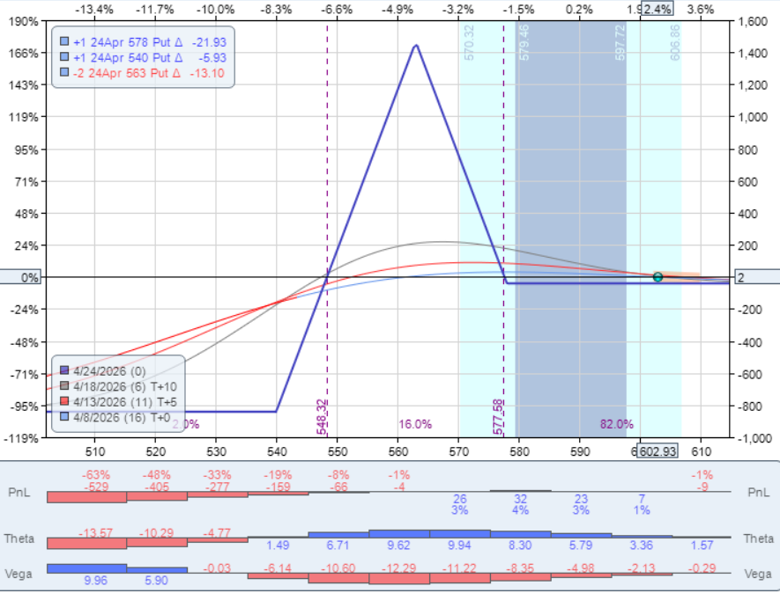
The diagonal had a similar P&L of $9…
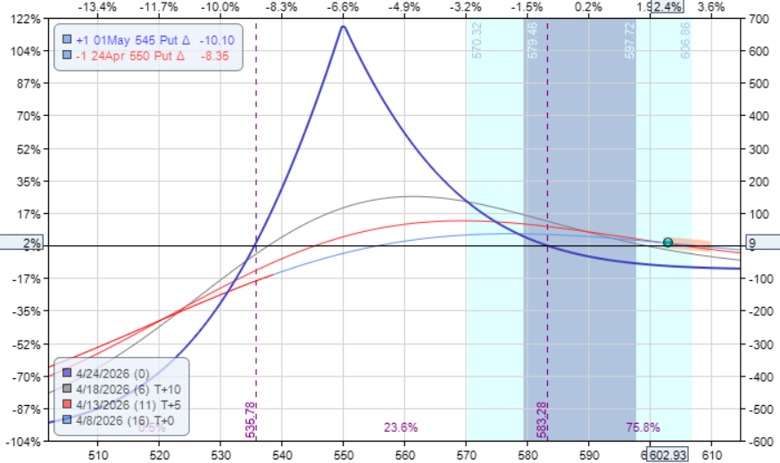
In both cases, the trader likely performs an adjustment at this point.
There are many ways to adjust both a butterfly and a diagonal.
Ultimately, it comes down to which approach the trader is more familiar with and their preferred method of adjustment.
Broken Wing Butterfly In A Down Move
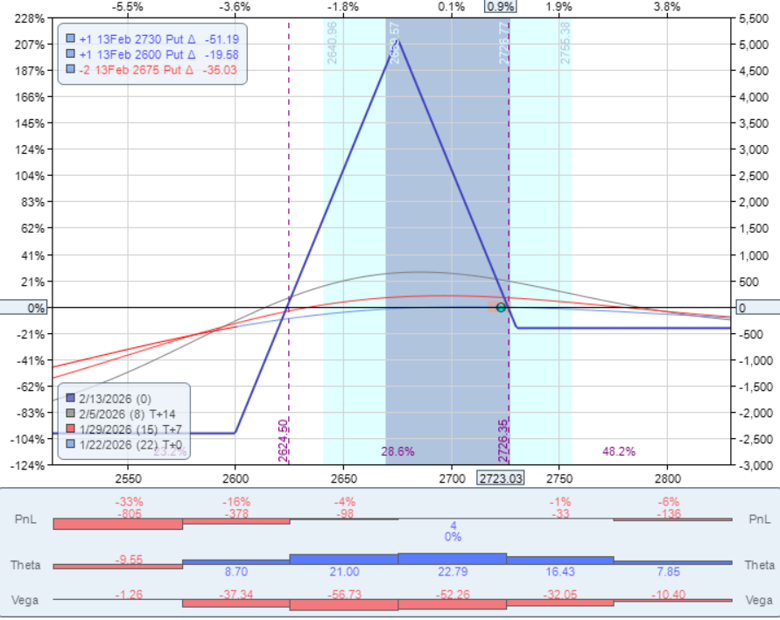
RUT (Russell 2000 index) made a downmove from January 22nd, 2026, to February 5th, and volatility had increased from an RVX of 21 to 26 – RVX being the volatility index for the RUT.
Let’s see how the BWB performed during that time.
BWB on Jan 22nd…
BWB on Feb 5th…
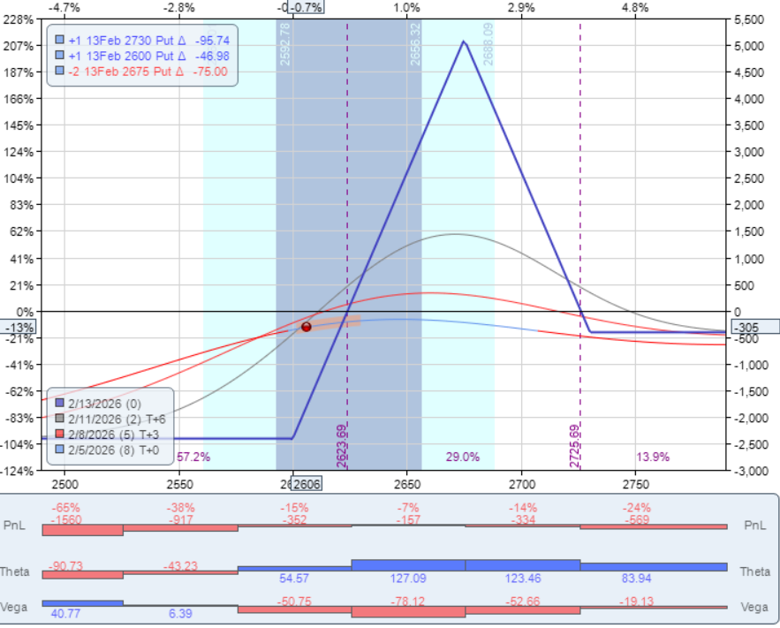
Down 13% with a loss of -$305.
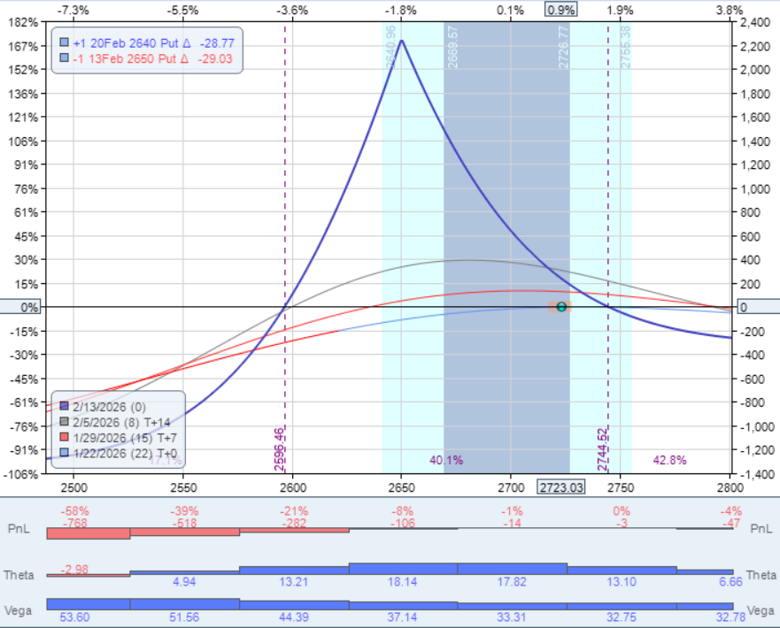
Diagonal In A Down Move
Diagonal on Jan 22nd:
Diagonal on Feb 5th…
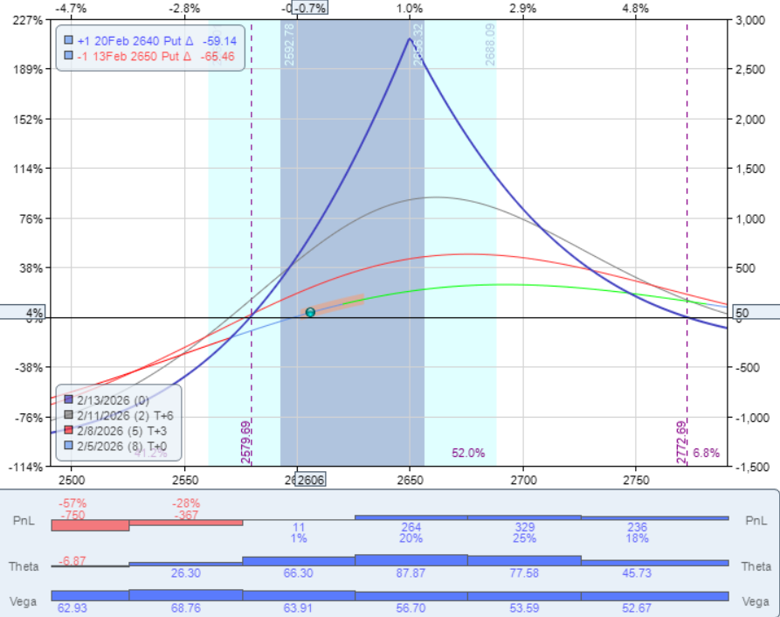
The diagonal survived the down move with a profit of $50.
Again, we see the expiration graph expand, and the diagonal benefited from the increase in volatility.
The peak of the expiration tent went from 2200 to 2700.
Pre-Earnings Trades
Since diagonals benefit from rising implied volatility, and IV tends to increase in the days leading up to an earnings announcement, we can explore whether a diagonal spread would be advantageous in pre-earnings trades – a strategy where we enter the trade about a couple of weeks before the announcement and exit before the actual event.
For this approach to work, both the near-term and far-term options must have expiration dates after the earnings date, so that the rise can influence both legs in implied volatility.
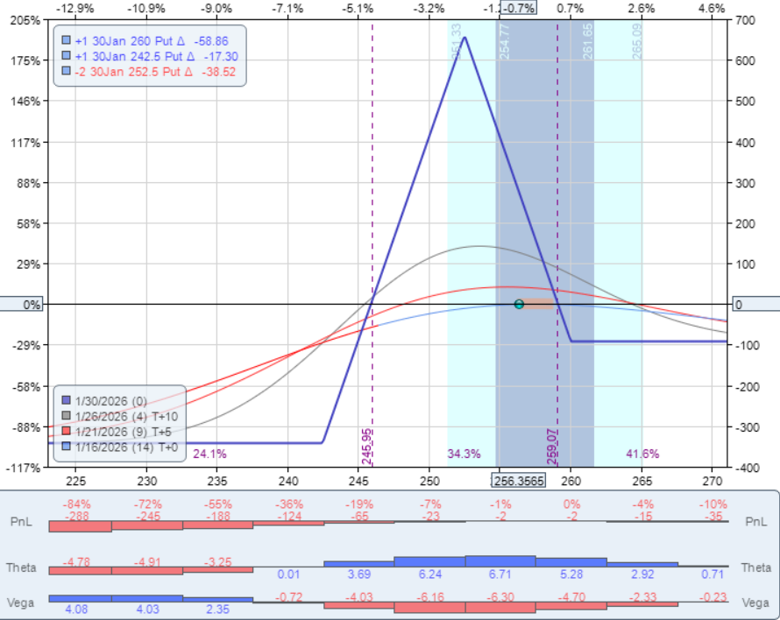
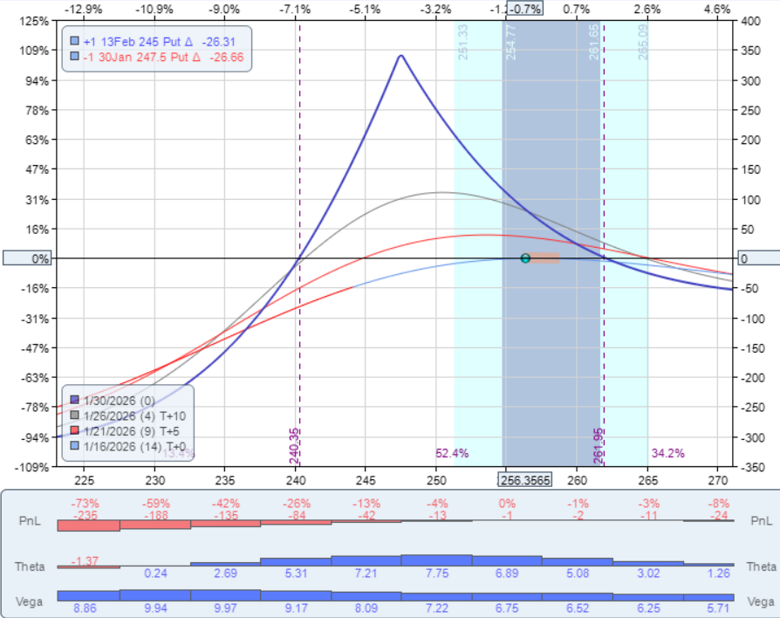
Let’s compare BWB and diagonal on Apple (AAPL), starting the trade about two weeks before its earnings announcement.
Here is the BWB at the start of the trade on Jan 16th:
And here is the diagonal on Jan 16:
If the trader exits on Monday, January 26, with 4 days to expiration, both the BWB and the diagonal are profitable, as shown below.
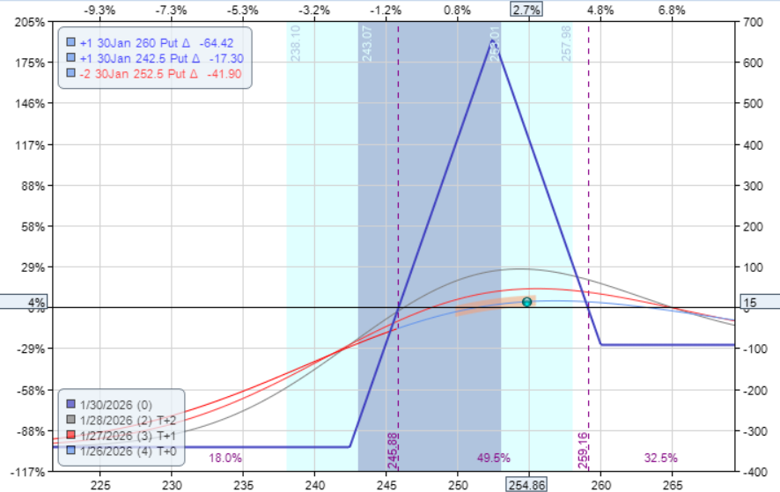
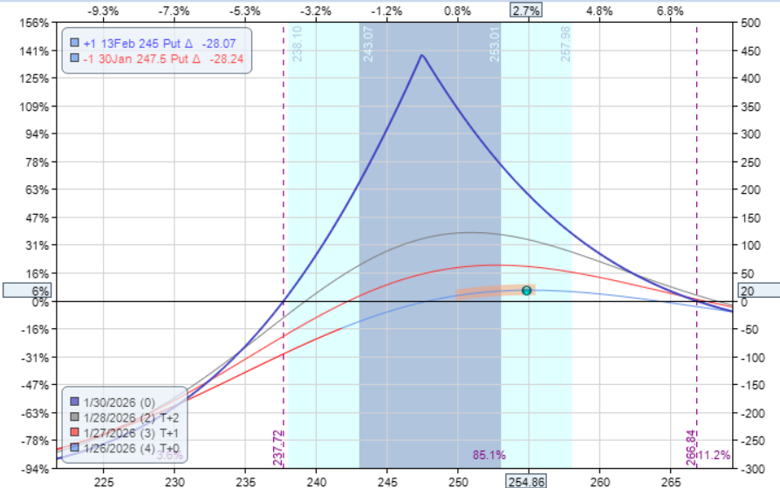
The butterfly made $15 while the diagonal made $20.
Not much difference, both around 5% return on risk.
During the trade running up to earnings, there was an increase in implied volatility…
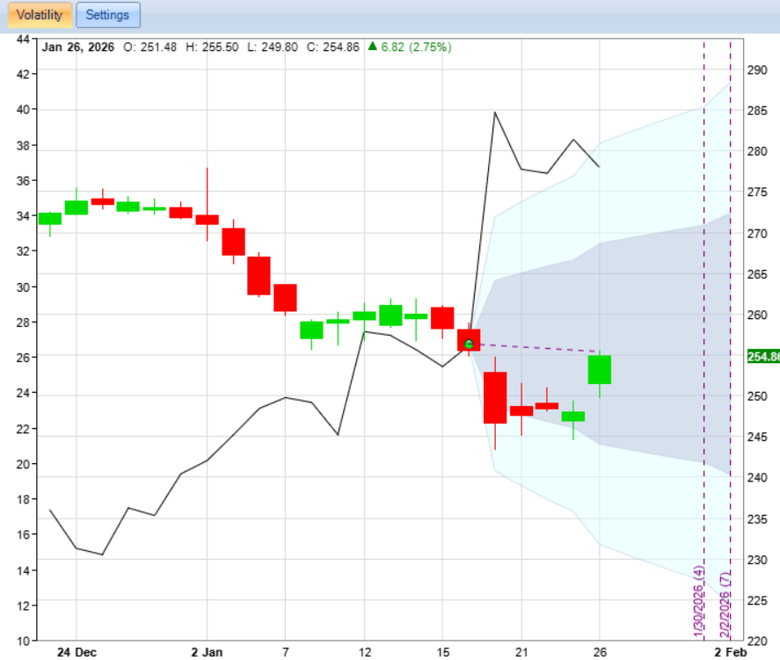
The diagonal benefited from that, as we see the peak of its expiration graph rise from the start to the end of the trade.
When To Choose Each Strategy
Choosing between the broken wing butterfly and the diagonal comes down to your market outlook and the current volatility environment.
Choose the BWB when IV is elevated and expected to fall.
The BWB’s negative vega means the position gains when volatility contracts.
Its fixed expiration graph makes it easier to model maximum risk and reward from the outset, and it tends to generate higher theta relative to capital at risk in high-IV conditions — which suits traders who prioritise income over flexibility.
Choose the diagonal when IV is low and expected to rise.
Its positive vega means the position benefits as IV increases, and the expanding expiration graph provides upside that a fixed-graph structure like the BWB cannot offer.
Pre-earnings setups, macro event plays, and environments where the VIX is near multi-year lows all favour the diagonal for this reason.
Neither strategy requires strong directional conviction.
Both the BWB and the diagonal are positioned to profit primarily from time decay, with the directional component managed through delta adjustment rather than outright prediction.
This makes them well-suited to traders who prefer systematic, defined-risk income structures over speculative positioning.
There are also practical execution differences worth considering.
Because the BWB has more legs, a full position in a less liquid underlying can incur significant slippage on entry and exit.
Traders running BWBs on individual stocks rather than liquid indices or ETFs should account for wider bid-ask spreads on the outer long strikes, which may erode the theoretical edge.
The diagonal, with only two legs, is generally cheaper to enter and easier to manage — though it introduces the additional complexity of tracking IV across two separate expiration cycles.
Adjustment complexity also differs in practice.
If a trader intends to adjust by layering in additional option structures, the BWB’s higher leg count can result in a combined position that cannot be exited with a single GTC order.
Since most brokers limit orders to a maximum of four different strikes, the trader would need to manually close each structure using separate orders.
The diagonal’s two-legged structure doesn’t have this limitation.
In summary: for the most part, the broken wing butterfly and the diagonal behave similarly — the primary driver of P&L in both cases is directional movement from delta.
The key distinction is vega.
The diagonal’s positive vega and expanding expiration graph give it an advantage when implied volatility is rising, as is often the case during a sharp down move or a run-up into earnings.
The BWB’s negative vega and fixed graph make it the stronger income vehicle when volatility is elevated and likely to contract.
Another type of diagonal trade is the poor man’s covered call.
FAQ
Which Is Better — Broken Wing Butterfly Or Diagonal?
Neither is universally better, they suit different market conditions.
The BWB is the stronger choice when implied volatility is elevated and expected to fall, as its negative vega benefits from IV contraction.
The diagonal is better when IV is low and likely to rise, or when a directional move is anticipated, as its positive vega and expanding expiration graph provide upside the BWB cannot.
For most income traders, having both in your toolkit and selecting based on the current IV environment is the right approach.
What Is The Main Difference Between A Broken Wing Butterfly And A Regular Butterfly?
A standard butterfly has equal widths between the upper and lower wings — the distance from the upper long to the short is the same as from the short to the lower long.
A broken wing butterfly has unequal widths, creating an asymmetric payoff profile.
The BWB is typically structured to eliminate or reduce risk on one side (usually the upside for a put BWB) in exchange for slightly reduced maximum profit or a small debit rather than a credit.
This asymmetry makes the BWB more suitable for directional income trades where you have a mild view on the underlying’s direction.
Why Does The Diagonal’s Expiration Graph Change Shape During The Trade?
Because the diagonal uses two different expiration dates, its P&L profile at any given moment depends on both the current price of the underlying and the implied volatility of each leg.
As IV changes, the value of the longer-dated back-month option changes more than the shorter-dated front-month option, which causes the overall P&L profile to shift.
This is the diagonal’s positive vega in action — when IV rises, the graph expands upward, increasing the potential profit.
A butterfly, with all legs sharing the same expiration, has a fixed expiration graph that doesn’t change shape regardless of IV moves.
Can You Adjust A Broken Wing Butterfly If The Trade Goes Against You?
Yes, but the adjustment is more complex than adjusting a diagonal because of the higher leg count.
Adding another structure to a four-legged BWB can create a position with six or more legs, which most brokers cannot close as a single order.
This is a practical limitation worth considering at entry — if you intend to adjust actively, the two-legged diagonal is easier to manage.
For BWBs, the cleaner approach is usually to close the entire position when the pre-defined stop is reached rather than layering on additional structures.
Is A Diagonal The Same As A Poor Man’s Covered Call?
A Poor Man’s Covered Call (PMCC) is a specific type of diagonal spread — specifically a long call diagonal where you buy a deep in-the-money long-dated call and sell a shorter-dated OTM call against it.
All PMCCs are diagonals, but not all diagonals are PMCCs.
The diagonal in this article uses puts rather than calls and is positioned neutrally rather than bullishly.
The same vega and expiration graph dynamics apply to both.
Want to Trade Both Strategies With a Systematic Approach?
Both the broken wing butterfly and the diagonal are covered in Options Income Mastery — including exact entry rules, strike selection, and when to use each strategy based on the current volatility environment.
We hope you enjoyed this article on broken-wing butterflies versus diagonals.
If you have any questions, please send an email or leave a comment below.
Trade safe!
Disclaimer: The information above is for educational purposes only and should not be treated as investment advice. The strategy presented would not be suitable for investors who are not familiar with exchange traded options. Any readers interested in this strategy should do their own research and seek advice from a licensed financial adviser.