
Today, we are discussing what is considered high implied volatility.
When trading options strategies, it is important to be aware of the implied volatility levels.
These levels determine which options strategies are more appropriate.
Contents
- What Is Implied Volatility?
- Implied Volatility vs. Historical Volatility
- How Does Implied Volatility Work?
- How Does Implied Volatility Affect Option Prices?
- What is the Difference Between IV Rank and IV Percentile?
- How to Use Implied Volatility?
- What Is Considered High Implied Volatility?
- How To Find Stocks With High Implied Volatility
- FAQ
- Conclusion
What Is Implied Volatility?
Volatility can be loosely conceptualized as how much a stock or an asset moves up or down.
High volatility means stock moves a lot.
There is a tendency for higher volatilities in bear markets and market sell-offs.
When markets are calm and gradually moving up, volatility decreases.
Implied Volatility vs. Historical Volatility
Implied volatility is the future expectation of volatility.
Historical volatility is the actual volatility as calculated by historical price data.
This can be determined by looking at the standard deviation of price from its mean.
There have been studies to compare implied volatility with historical volatility.
In general, implied volatility tends to be higher than historical volatility.
This is known as the variance risk premium.
That means that the actual price moves that the market makes tend to be lower than what the implied volatility had predicted.
There are exceptions, of course.
The most notable was during the 2008 financial crisis when the realized volatility did exceed the implied volatility.
This is why buying a put or buying a call is not profitable if the underlying makes the expected move.
They are profitable, however, if the underlying makes a greater than expected move.
Traders that can predict when those moves happen can make buying calls and puts profitable.
How Does Implied Volatility Work?
Each asset has its own implied and historical volatility.
The implied volatility of SPX (S&P500 index) is different from the implied volatility of the RUT (Russell 2000 index).
It is different from the implied volatility of an individual stock such as General Electric (GE).
The same goes for realized volatility.
However, these different volatility are correlated.
If the volatility of SPX is high, it tends to be high in the RUT and similarly in individual stocks.
When people speak of market volatility in general, they refer to the volatility of the SPX index.
The VIX index is the implied volatility of the SPX index.
The VIX is most often quoted as the implied volatility of the market.
The Black–Scholes equation is a model that gives the theoretical estimate of option prices based on the underlying asset’s price, the strike price, expiration, volatility of the asset, and the risk-free interest rate.
Since we know the prices of options from the options chain, we can solve the volatility equation.
This becomes the implied volatility of the asset. It is the volatility implied by the option prices.
Depending on your platform, sometimes implied volatility is calculated based on the Bjerksund-Stensland model, which some feel is more appropriate for American-style options (which can be exercised early).
In contrast, the Black-Scholes model is more suitable for European options (which can not be exercised early).
How Does Implied Volatility Affect Option Prices?
As the implied volatility increases, option prices increases.
Implied volatility can be conceptualized as how expensive options are.
Under high implied volatility conditions, option prices are expensive.
When implied volatility is low, option prices are cheap.
This makes sense when you consider the cost of a put option, which is an option that is purchased to protect against falling stock prices.
When markets fall, volatility increases, and put options prices increase as they are in greater demand.
Another way of saying it is that option premiums are rich when implied volatility is high.
An option price is composed of intrinsic and extrinsic value, the latter being the option’s premium.
At any given point in time, the intrinsic value is solely determined by the difference between the current price of the underlying and the strike price of the option.
Therefore, volatility affects the extrinsic portion of the option.
When volatility is high, its extrinsic value is higher than when volatility is low.
What is the Difference Between IV Rank and IV Percentile?
Implied volatility (IV) is a number that is different for each underlying asset.
You can not compare the IV value of Microsoft with the IV value of Johnson and Johnson because the range of IV values of the two are different.
What is more important to know is:
What is the current IV value of Microsoft in relation to its IV range for the past year?
This is the concept of IV Rank.
Say, for example, Microsoft’s IV value ranges from 50 to 90 within the past year.
If the current IV value of Microsoft is 70, then its current IV Rank is 50% because 70 is right in the middle of the range.
Let’s say the IV value of Johnson and Johnson ranges from 20 to 70, and its current IV is 30; then we say that its IV Rank is 20% because 30 is 20% of the distance from 20 to 70.
Mathematically, it can be computed as such.
(30 – 20) / (70 – 20) = 0.20 = 20%
IV Ranks above 50% are in the upper end of the range, and IV Ranks below 50% are in the lower half.
The IV Percentile is another way of measuring how high or low something is within its range.
Let’s say, for example, the IV Percentile of Apple (AAPL) is currently 25%.
That means that 25% of the days in the last year have had IV below the current IV level.
An IV percentile of 0% means its current IV level is the lowest it has been over the past year.
An IV percentile of 100% means its current IV level is the highest it has ever been in the past year.
How to Use Implied Volatility?
An IV percentile of 100% is abnormally high.
You would guess that we will get an IV that is lower at some point.
And you would be correct.
Because implied volatility has a mean-reverting characteristic, we expect a high IV to come down eventually.
And a low IV would eventually go up.
When IV is high, we want to trade strategies that benefit when IV comes down.
These strategies have negative vega, such as iron condors, credit spreads, and at-the-money butterflies.
When IV is high, option sellers benefit by being net sellers of options.
They are selling more extrinsic value than they are buying.
When IV is low, we want to use strategies that profit when IV increases.
These include buying calendars and buying calls and puts.
These are positive vega strategies.
What Is Considered High Implied Volatility?
When trading individual stocks, an IV rank or IV percentile above 50% is considered high enough to employ strategies that benefit from a drop in implied volatility.
When trading the SPX index or speaking of the market in general, a VIX above 20 is considered high.
In general, the optimal time to use iron condors and butterflies is when VIX is between 15 and 25.
If above 25, the price becomes a bit volatile for delta-neutral strategies.
However, experienced traders that feel comfortable can still successfully use them.
VIX less than 20 are good levels to be doing calendars, diagonals, and double-diagonals.
How To Find Stocks With High Implied Volatility
There are various tools out there for you to find options with high implied volatility.
Barchart Premier members (not free) have access to a filter to screen for stocks with IV Rank and IV percentile above or below a certain level that you specify.
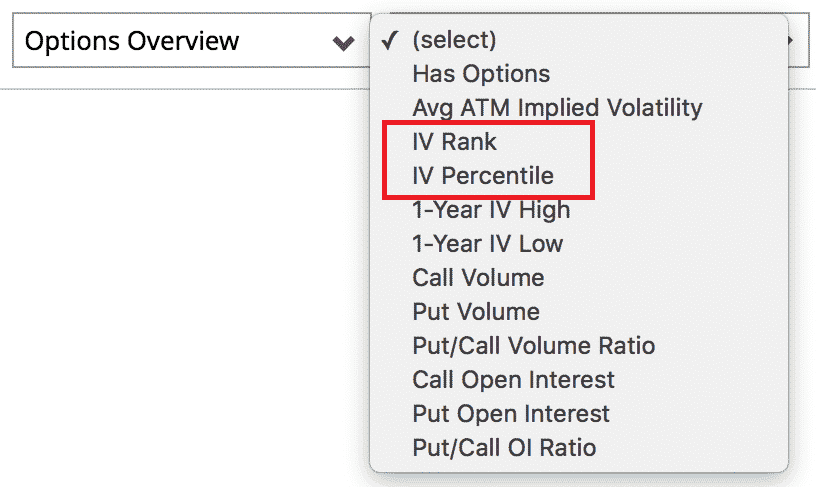
For Barchart free members, they don’t have access to that particular filter.
However, a workaround is to use a commonly available filter such as the market cap to get a set of results.
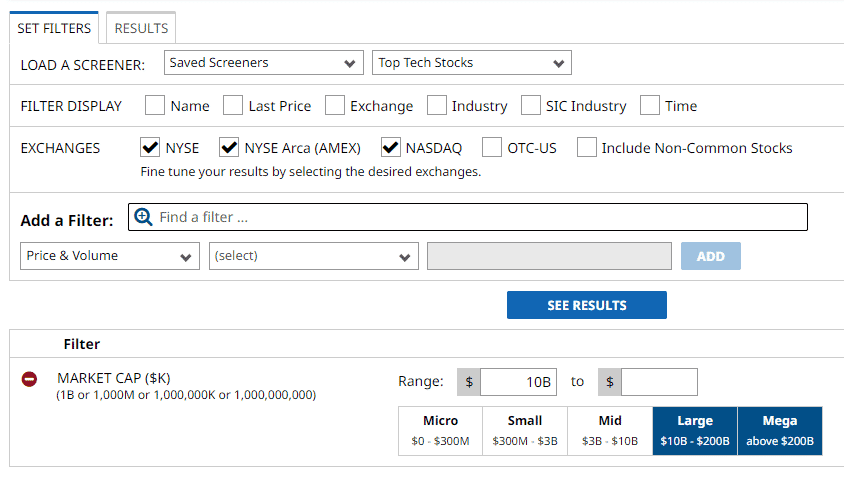
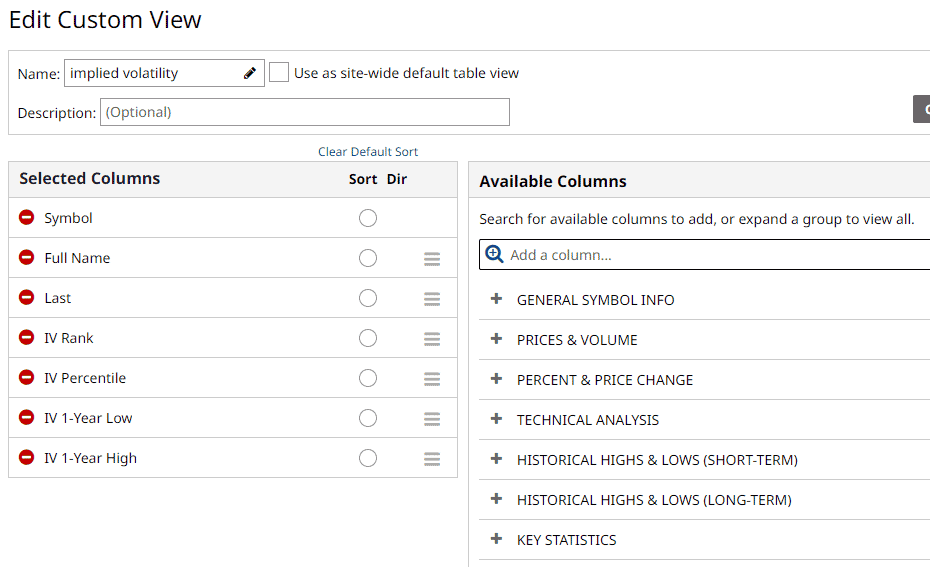
When you go to the results list, select a custom view that contains IV Rank or other columns of information that you want to see.
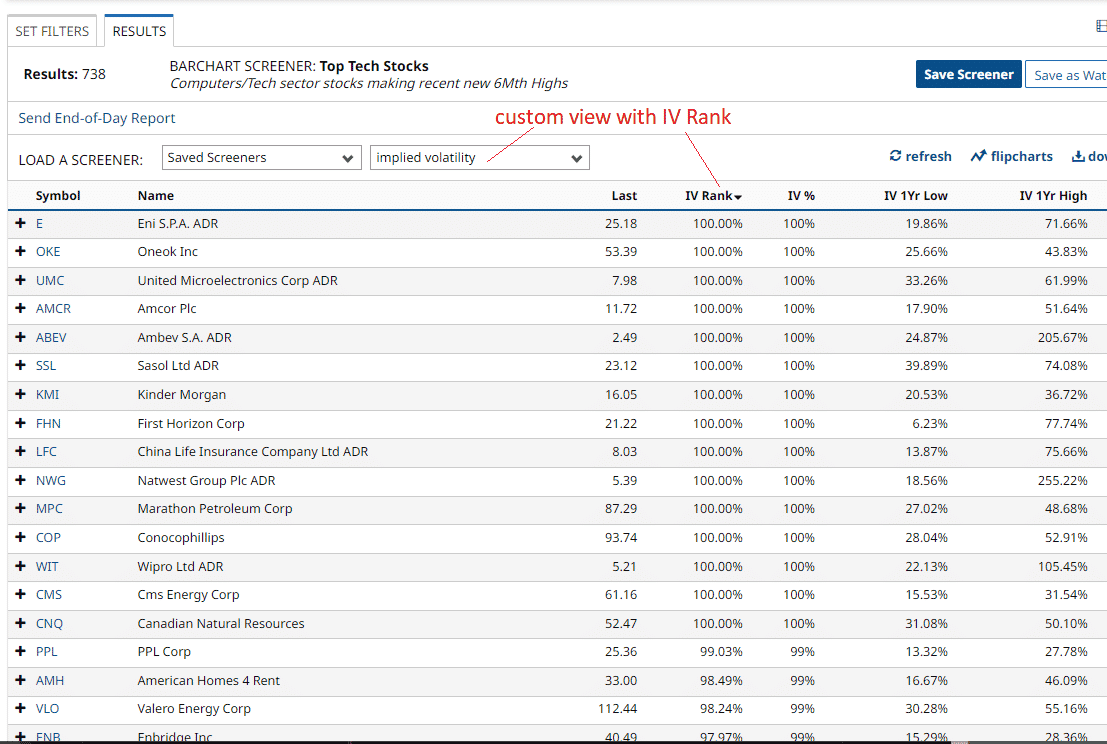
source: barchart.com
And then click on the column heading to sort by IV Rank.
This custom view had to be set up in advance by going to “Tools –> Custom View” and then adding the available columns you want to see in the results.
FAQ
Is high implied volatility good or bad?
High implied volatility is good for an option seller because they can sell options with higher premiums.
It also presents a higher risk when employing delta-neutral strategies because of the more volatile price movements.
But in general, they are getting paid well enough for the risk they are taking because it usually turns out that the realized volatility price moves are less than what the implied volatility predicted.
High implied volatility is generally bad for options buyers because they have to pay higher prices for the options.
But it can be profitable if a greater than expected move occurs.
What is a good range for implied volatility?
Under calm market conditions, a good range for the VIX is between 12 and 20.
In bear market conditions, it can range from 20 to 40.
If VIX hits 30, it tends not to stay up there for long.
Traders sometimes like to buy put debit spreads expecting VIX to fall and revert to the mean.
What options strategies are good for high implied volatility?
In general, credit spreads, iron condors, at-the-money butterflies.
These strategies benefit when implied volatility comes back down.
In these strategies, you are selling more extrinsic value than buying.
When IV is high, you have more extrinsic value to sell.
As an option seller employing these strategies, you are making money by selling extrinsic value embedded in options, with the understanding that all extrinsic value in all options will eventually decay to zero at expiration.
What is considered low implied volatility?
A VIX of 20 or lower.
This is when calendars and double diagonals are good strategies because they benefit when volatility goes up.
What does implied volatility measure?
Implied volatility measures the market’s expected movement of an underlying based on current option prices.
Conclusion
Understanding implied volatility is one of the core pieces of options trading.
Maybe it is not as important as understanding the Greeks.
But after that, it is the next layer of knowledge to add to your options mastery.
We hope you enjoyed this article on what is considered high implied volatility. If you have any questions, please send an email, or leave a comment below.
Trade safe!
Disclaimer: The information above is for educational purposes only and should not be treated as investment advice. The strategy presented would not be suitable for investors who are not familiar with exchange traded options. Any readers interested in this strategy should do their own research and seek advice from a licensed financial adviser.


