


Trading breakouts can be an extremely effective strategy for active traders looking to capitalize on the momentum in a particular security.
A breakout occurs when the price of an asset breaks above or below a key support or resistance level, signaling a potential major move.
This article will explore breakouts, how to identify them, and techniques for trading breakouts while effectively managing risk.
Learning to trade breakouts properly takes practice but can ultimately help traders profit from some of the largest directional moves in the market.
Contents
What Is A Breakout?
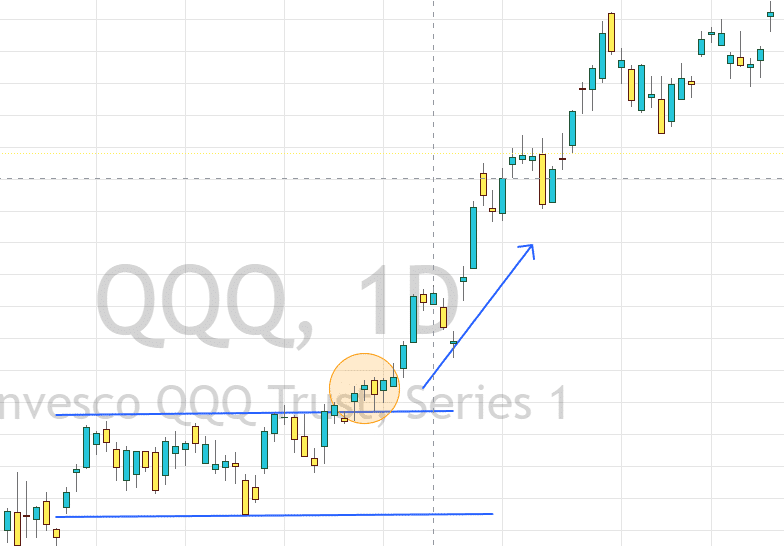
A breakout occurs when the price of a security pushes outside of a defined range where it had been contained or stuck.
Typically, these boundaries are formed by support and resistance levels but can also be channels, trendlines, or consolidation zones.
For example, if a stock has been range-bound between $10 and $12 for several weeks, a breakout occurs if the price breaks above $12 or below $10.
The idea is that breaking significant support or resistance signals a shift in supply and demand that could lead to a powerful move.
Breakouts happen when buyers overpower sellers or sellers overpower buyers.
As the price consolidates, buyers and sellers reach an equilibrium.
This balanced price action forms the support and resistance levels at the top and bottom, where buyers and sellers push back on price.
Eventually, one side gains control, and the price breaks out forcefully.
Breaking support shows selling pressure dominating, while breaking resistance shows buying pressure dominating.
Breakouts can occur in price, volume, and volatility.
You will need at least two of the 3 to confirm a breakout trade.
As the price moves below or above a level, you want to see volume following the price break.
Once You have confirmed it is more than a stop run with volume holding current, you can also look for volatility expanding in the name.
It is possible to have a breakout with high volatility and low volume; a news break is an example, but these are not as strong as volume-backed moves.
Identifying Breakout Opportunities
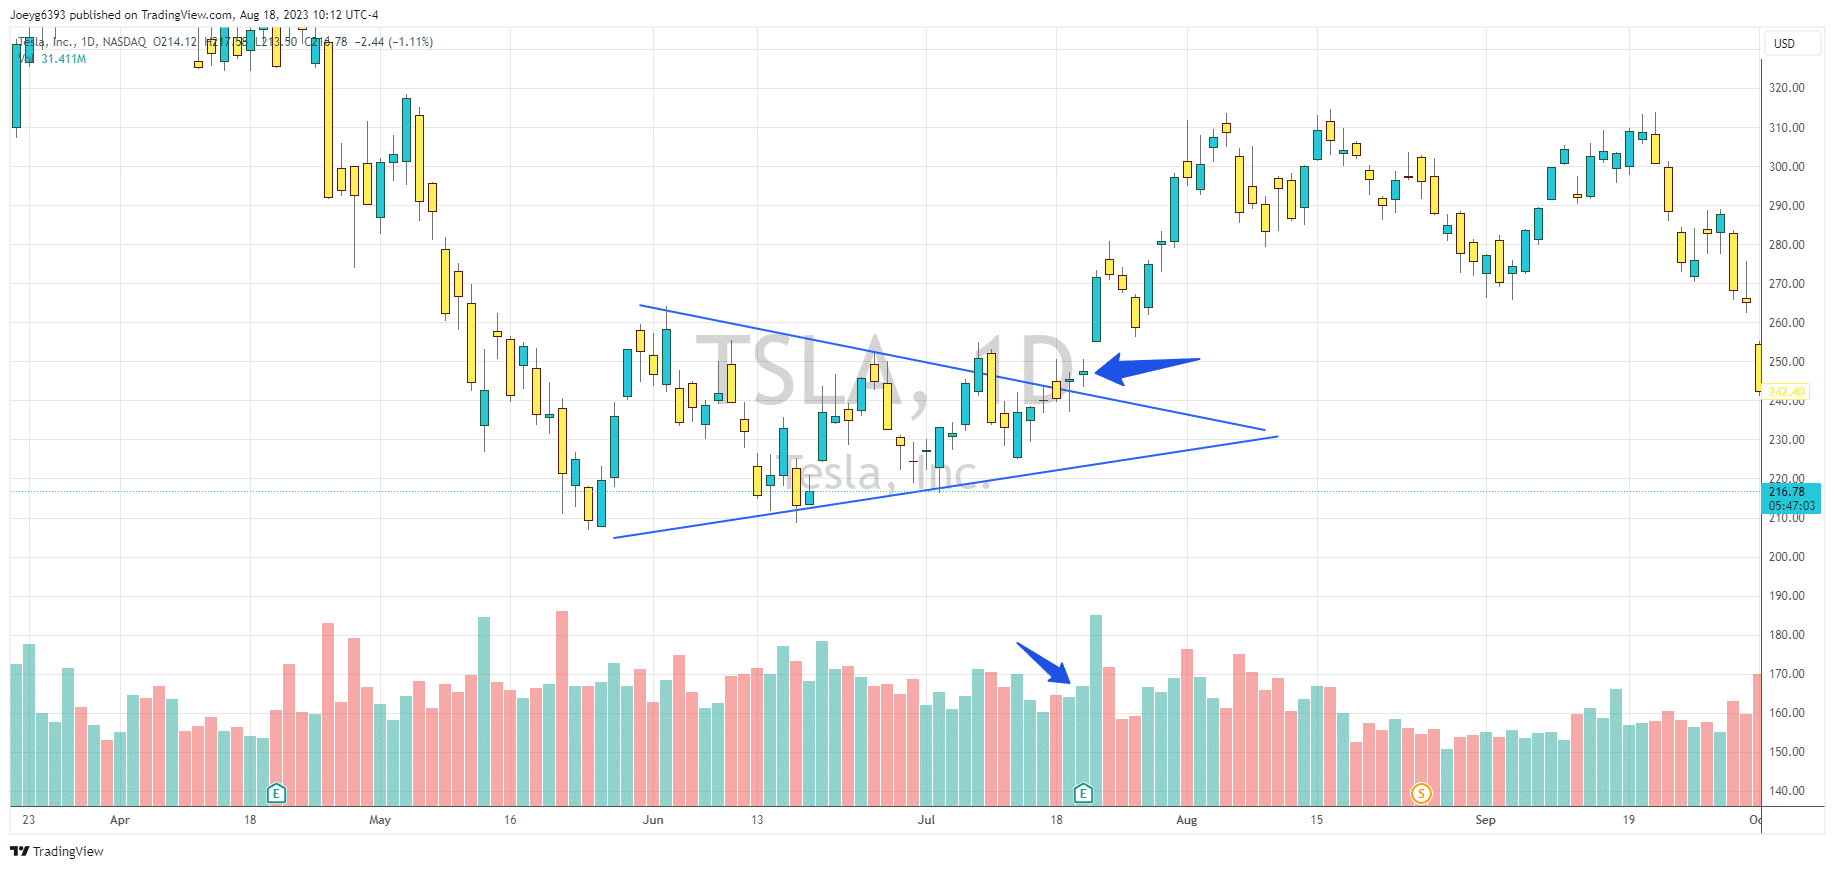
There are several indicators traders can look for to identify potential breakout setups. Watching for patterns like wedges, triangles, channels, flags, and pennants can tip you off to building pressure for an eventual breakout.
These patterns often form as the price consolidates and builds energy for its next move.
Often, the tighter and longer an instrument consolidates, the more energy it stores.
So now that we have what to look for as a setup next week, we need a catalyst for the move.
Keep an eye on news events like earnings, product releases, or merger announcements that could ignite increased trading volume.
Once the volume increases, look for the price to break your level.
Once this happens, look for acceleration in the direction of the trade.
Monitoring technical indicators like Bollinger Bands, ATR, RSI, or McClellan Oscillator can help identify when momentum has shifted and the trade you identified above is confirmed.
Types Of Breakouts
Now that we know what a breakout is and some ways to identify a breakout trade opportunity let’s look at some different types of breakout trades.
Continuation Breakouts
Continuation breakouts occur in the same direction as the prevailing trend.
A breakout above resistance when in an uptrend or below support in a downtrend.
Continuation breakouts are arguably the easiest to spot and trade since they move with the longer-term trend.
These setups are typically seen as Flags and Pennants as the price moves, then consolidates before continuing.
Reversal Breakouts
Reversal breakouts change the direction of the trend, breaking support in an uptrend or resistance in a downtrend.
Reversals indicate a shift in sentiment and momentum that can lead to a powerful change in trend.
These breakouts often occur after a move has seen volume declining and prices unable to continue to make new highs or lows.
Double tops/bottoms can help identify patterns to look for reversal breakouts.
These trades are arguably the hardest because identifying when a trend is over can be tough.
Usually, this is where the term “Catching the Knife” comes from in trading.
Consolidation Breakout
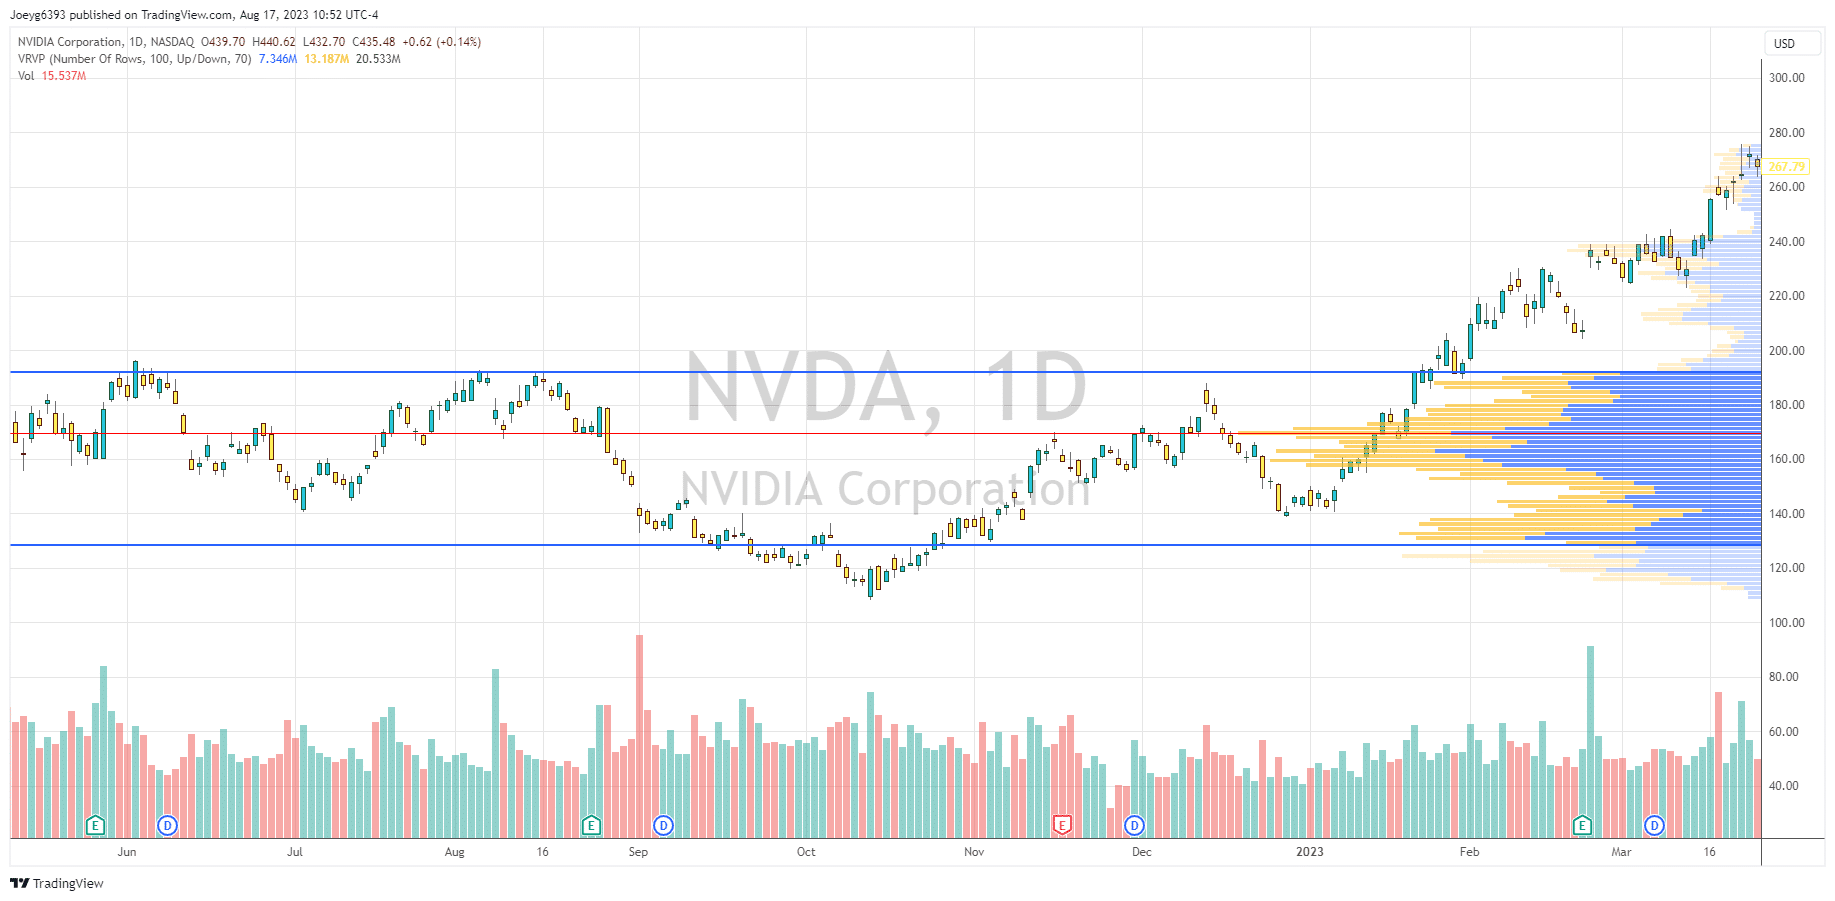
The consolidation breakout is a breakout that does not cleanly meet either of the other two types. While one can say that all breakouts are consolidation breakouts, this type usually occurs when there is no clear trend, and it hasn’t been for some time.
These occur most after a stock has been “range trading,” and there are multiple tops and bottoms to show solid edges.
Volume by price is a tool often used to help identify this type of breakout, as you will see a nice bell-looking curve to the volume, and once we break from it, it’s often a sign of momentum entering.
In the example above, notice how the price chopped around on nVidia between 190 and 130 for months and formed a nice large bell curve.
Once we broke out from it and headed up, there was no real looking back.
While you could have just as easily used channels, the Volume Profile helps adapt with volume where channels would need to be constantly redrawn.
Trend vs Consolidation Breakouts Differences
A few key differences exist between a Continuation/Trend Breakout and a consolidation/Reversal breakout.
Consolidation and reversal breakouts are typically more volatile than breakouts from established trends.
Consolidation represents a balanced trading area between buyers and sellers, so the price can move rapidly when the equilibrium breaks.
The same can be said with reversal breakouts as well.
Once the dominant trend is broken, there is often a quick exit from positions before they go underwater.
This leads to a quick shock in price and volume.
Breakouts from trends tend to be much slower and more methodical.
Once they break and continue in the direction of the trend, it’s possible to take significantly more time to move as there is no real rush to exit or enter a position.
Planning Your Entries
Timing is incredibly important in a breakout trade.
Being too early can lead to you getting stopped out and missing the move.
Being too late means there is not enough left to justify the trade risk.
A lot of practice is required to get good at breakout trading, but here are a few tips that will help shortcut your learning curve.
1. Watch the volume at the breakout point. You want to enter as close to the breakout as possible, but you may be in a fake out if there is no volume following the trade. Watching the volume on the breakout chart and a lower time frame can help confirm it for you.
2. Use alerts just above or below your entry lines. This will make it so you don’t need to constantly watch and cycle through charts to keep an eye out for entries. Once you get really good, even using buy/sell stop entries to automate the process is an option.
3. Consider scaling into a position to help remove the pressure of timing it perfectly. You can take a lot more risk on a ⅓ of your position than you can on the entire thing. This is where the above-mentioned buy/sell stops come in really handy. You can enter on the initial break on a smaller position size so you don’t risk being left out of the trade, but you can add to your position and tighten your risk as you gain confidence in the trade.
Managing Risk on Breakouts
Having a trading plan in place before entering breakout trades is vital.
The natural volatility of breakouts means managing your risk can be the difference between a great trade and a missed trade.
Know where your stop-out points are before you enter the trade.
Typically, smaller support/resistance levels make great points to manage risk.
You can also use the breakout point +/- a certain % as a fixed stop.
This will keep you from blowing up in the long run.
As a breakout continues in your favor, look to trail stops higher/lower to lock in open profits while still allowing room for normal volatility.
Developing some form of trailing stop method works well for this.
Some examples can include using a certain period moving average, parabolic SAR, or previous highs/lows.
This will help maximize profits while still managing your risk.
Taking partial profits is also a good idea to help keep you profitable.
As you would scale into a position, scaling out is great.
Unless you have specific prices that you are looking for, such as previous resistance levels or previous all-time highs, using a fixed-risk reward keeps things simple.
An example would be to take ⅓ of the position off at a 2:1 risk to reward, take another ⅓ off at a 3:1 risk to reward, and finally let the last ⅓ run using the trailing stop methods above.
Finally, which may be the most important, is keeping your overall portfolio risk in check.
Most traders use a 3-5% max position size based on their portfolio value.
So, if you have a $100,000 portfolio, you never have more than $5,000 invested in any single trade.
Tying It All Together
Trading breakouts takes skill and discipline but can be very profitable.
Doing your homework to scout setups, identify clear risk points, and being patient will help stack the odds in your favor.
When used properly, trading breakouts can produce outsized returns by capturing large directional price movements when significant levels are breached.
It is a strategy every active trader should have in their playbook for when the time is right.
We hope you enjoyed this article on trading breakouts.
If you have any questions, please send an email or leave a comment below.
Trade safe!
Disclaimer: The information above is for educational purposes only and should not be treated as investment advice. The strategy presented would not be suitable for investors who are not familiar with exchange traded options. Any readers interested in this strategy should do their own research and seek advice from a licensed financial adviser.


Productive info-thanks.