


Today we’re looking at how to trade breakouts.
Breakouts are when the price breaks out of a zone, breaks out of consolidation or breaks out of a price congestion area.
It is important to first understand support and resistance because the price often will break out above resistance.
Or it often will break down below support.
Today, we will go through the evolutionary stages of a breakout trader.
Each stage adds a new level of complexity to the way you think.
Contents
Stage 1
Stage one of a breakout trader is what everyone thinks.
When the price breaks out to the top, buy it.
When the price breaks out to the bottom, sell it.
This chart shows resistance at a nice round price level of $200.
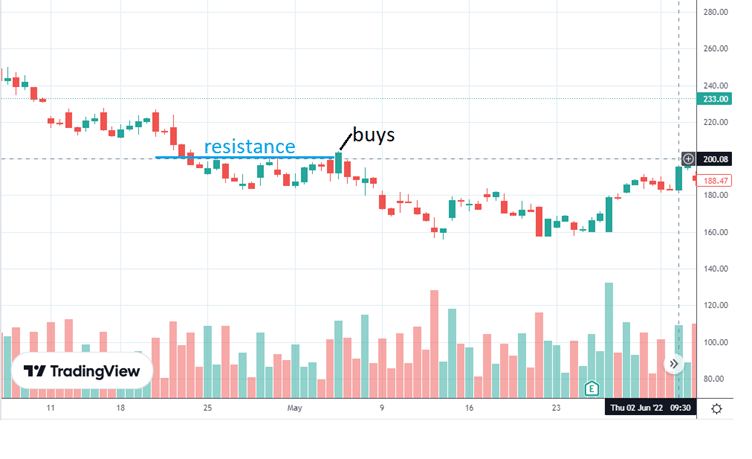
source: TradingView.com
The trader in stage one buys right away at the first candle that goes one penny above $200.
The problem is that resistance is a zone.
It is not at a particular price.
Just because the green candle closed at $203.41 does not mean that it had broken above the resistance zone.
That resistance zone could be anywhere from $195 to $205.
Stage 2
Okay, the stage two breakout trader waits patiently until the price clearly breaks out of the zone.
There is believed to be a support zone around the area from $92 to $96.
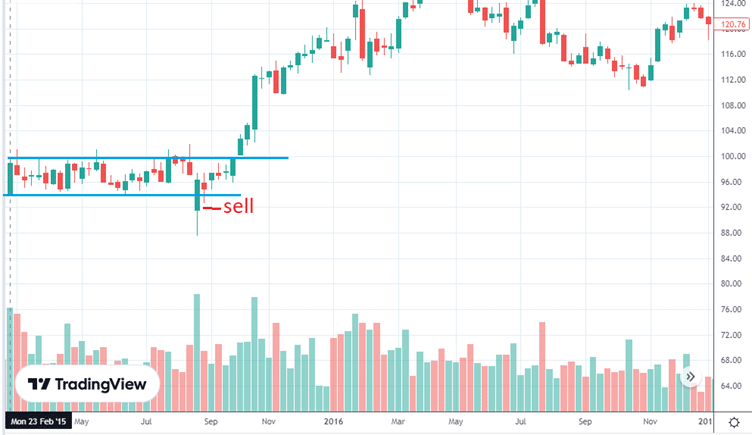
The candle shown clearly went all the way down to $88, which was when the breakout trader sold.
The price when down and then came back into the range.
This is what traders call a “false breakout,” “fake-out,” a “probe,” or whatever name they give it.
False breakouts are common.
In fact, some traders say false breakouts are more common than true breakouts.
It probably depends on what market you are trading in.
In the Forex market, where the support and resistance are strong, it is difficult to break support and resistance. So it may be the case there.
In stocks, the walls are weaker, and breakouts might be more common.
Some traders will not trade the first sign that price breaks the wall.
They watch what happens. Is it a true breakout or a false breakout?
If it is a false breakout, then what should have happened did not happen.
Do the opposite.
In our example, there is a false breakout to the downside.
They would go long instead. And it happens to work in this case.
Stage 3
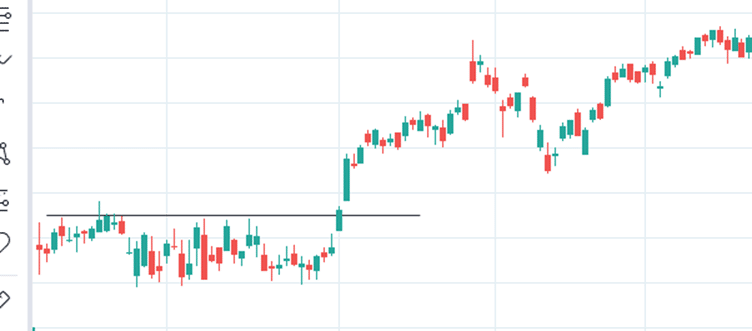
At stage 3, the breakout trader is becoming more sophisticated.
They are waiting for the re-test and confirmation:
Here they see resistance is broken.
But they did not buy the first candle that broke resistance.
They need to see if resistance becomes support.
The need to see how the price reacts when it re-tests support.
If it looks like support is holding, then they are ready to buy.
They want a good price.
They try to buy when the price comes back down as close to support as possible.
That way, they can put their stop loss below support and not have a wide stop.
It improves their reward-to-risk ratio.
Elephant Bars
Before getting to the stage 4 breakout trader, we must know what the long-time day-trading veteran Oliver Velez means by “elephant bars.”
Elephant bars are big red or green candles that have very little if any, wick.
They are often fully solid red and green and very tall.
Oliver says that an elephant bar that happens to clear three or more previous bars of the opposite color will have an 87% follow-through rate.
This means that 87% of the time, the price will continue in the direction of the elephant bar.
The three bars of the opposite color do not necessarily have to be in sequence.
He gives a downside breakout example in this video.
I would encourage anyone not to just take someone’s word at face value.
Look through a bunch of stocks for this breakout pattern and note in a spreadsheet how often it works and how often it fails.
Come up with your own statistics.
Stage 4
In the below chart, I have pointed out three green elephant bars and one red elephant bar.
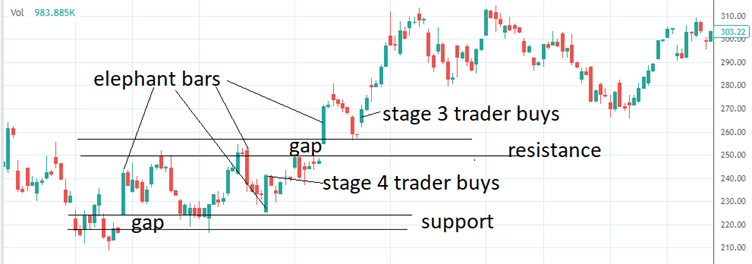
Note that the elephant bars often will emanate from a support or resistance zone.
The stage four breakout trader notices a big green elephant bar that clears the three red bars before it.
The trader buys at the close of that bar while the bar is still inside the range.
The trader is getting in early, anticipating a breakout to the upside.
To manage the trade, the trader will put a stop below support.
As the price continues up to the resistance area six bars later, the trader may take half the position off for a small profit.
Then move the stop on the other half to the break-even price.
Now the trade is in a risk-free trade, waiting to see if the price breaks resistance.
If it does not, the trader will be stopped at break-even.
If it does, the trader rides the profit to see how much the market can give.
Let’s give numbers to this example. Suppose the trader buys two shares at $240 with a stop-loss order at $210.
When the price reaches $250, sell one share at $250. That is a $10 profit.
The remaining share can lose $10, and still, the trade will be at break even.
So the stop is moved for the remaining share to $230.
There is no stop-out at $230.
The price on the remaining share goes up to $270, at which point the trader can exit and take home a profit of $40.
But the trader does not do this.
This trader is at stage 4, where he can read the price action.
Seeing that the resistance is broken with an overnight gap up, forming a big green elephant bar, he knows that big buyers are present.
Resistance is broken with force, momentum, and with emotion.
This means it is likely that resistance will turn into support.
Price comes down, bounces off support with a doji, and the stock is off and running.
The trader possibly might get out at $300 when the red topping tail bar formed.
That would be a net $70 profit on both shares — a 15% return on capital on a stock trade.
This chart is a four-hour chart on Telsa (TSLA).
The two hypothetical shares were purchased at the end of the morning session on July 13, 2022.
And the trade ended on August 1 at the end of the morning session. So the trade took about two weeks.
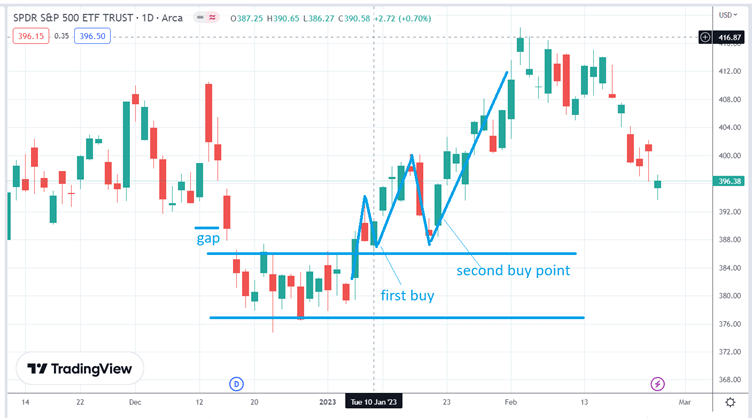
Note also the gaps in prices.
Gaps tend to form support and resistance zones. In this example, the consolidation range is almost like an island isolated by gaps from the rest of the chart at the two ends.
FAQs
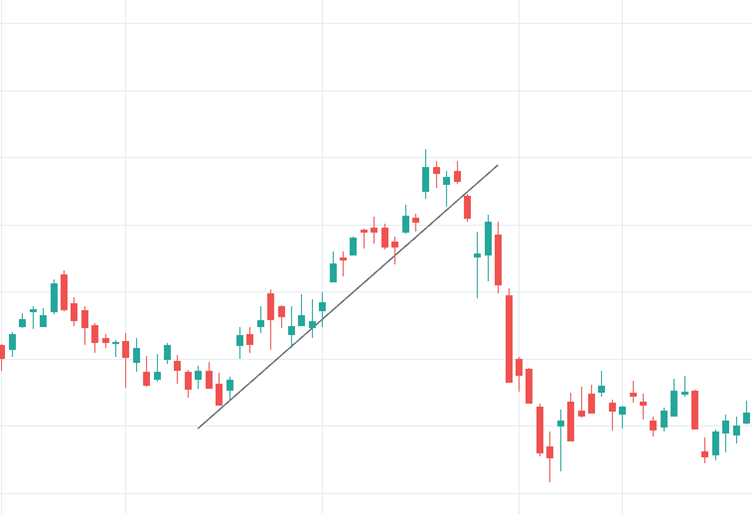
Can breakout occur on diagonal trendlines?
Yes, it can.
Is it possible for the stock to break out and go without a reset?
Yes, it is.
Conclusion
Trading breakout is not as simple as just buying or selling when the price breaks out of a range.
It involves understanding support and resistance, reading price action, and trade management.
We hope you enjoyed this article on how to trade breakouts.
If you have any questions, please send an email or leave a comment below.
Trade safe!
Disclaimer: The information above is for educational purposes only and should not be treated as investment advice. The strategy presented would not be suitable for investors who are not familiar with exchange traded options. Any readers interested in this strategy should do their own research and seek advice from a licensed financial adviser.


