


Contango and backwardation refer, in general, to the shape of the structure of a forward curve.
The forward curve could be plots of any asset price across time.
However, we are only concerned with the contango and backwardation of the VIX futures term structure curve.
Why this particular curve? Because it tells us whether the equities market (and, by implication, the options market) are in normal market condition or whether there is unusually high fear in the market.
Contents
- Introduction
- Contango
- Contango Is Normal
- Backwardation
- Mixed
- Bad Things Happen In Backwardation
- FAQs
- Conclusion
Introduction
The VIX is an index that represents the volatility of the S&P 500 index (SPX).
The precise definition is that it represents the market’s expectations for volatility over the coming 30 days based on SPX index options.
But don’t worry about precise definitions. Just understand that it is a gauge of the market sentiment. A high VIX implies fear in the marketplace. Low VIX represents complacency.
This is why the media often refers to the VIX as the “fear” index.
You will often see the VIX go up when SPX goes down. And vice versa. Generalizing, VIX goes up when the market is down for the day.
And VIX drops on a market up day. Not always, but typically.
The question is, at what level of VIX should we consider as being high?
And what level of VIX is considered low?
If you ask ten investors, they will likely give you ten different answers.
Also, markets change. A VIX level that was considered high five years ago might be considered low today.
While watching the VIX is good, watching for contango and backwardation in the VIX futures term structure provides added information to the investor.
When you see the curve in backwardation, that indicates that the market is in such a heightened state of fear that it is near panic, plus the signals are more clear.
If you ask ten investors whether we are in backwardation or not, you are more likely to get the same answer.
Contango
The simplest way to know whether the market is in contango or backwardation is to look at www.vixcentral.com.
As I am writing this, here is what I see on their homepage today, February 19, 2023:
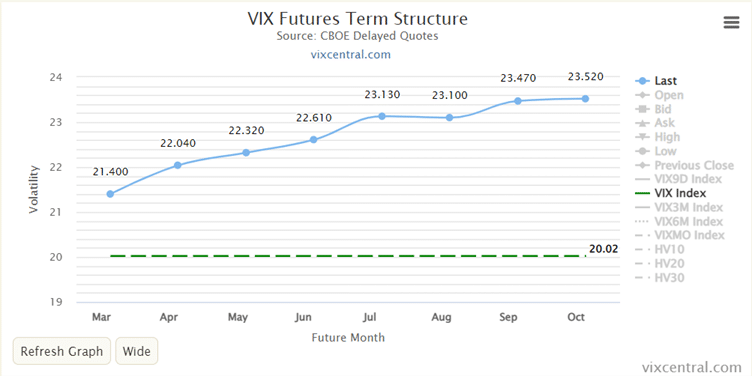
source: vixcentral.com
This curve is in contango.
The volatility of subsequent months is higher than the previous months — with the slight exception of the July and August months.
The vertical axis shows volatility.
The values are from the CBOE and are delayed prices. Nevertheless, they are good enough for our purposes.
The horizontal axis shows months going forward.
The leftmost dot (March in our example) is the upcoming month.
The dot after that (April) represents the month after that.
These two dots are known as the “front two months.”
Some investors prefer to see how much contango there is during the first two months.
The numbers are highlighted here:
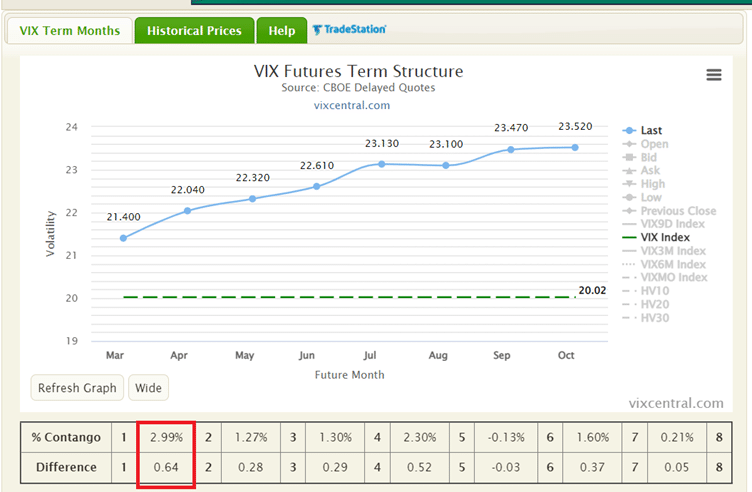
You can think of this as the steepness of the curve for those two months.
Contango Is Normal
The market is in contango the majority of the time because that is the default state of the market.
If you see contango, you know that the market is “normal.”
It is normal for the volatility of the future months to be higher than near months because there is more time for bad things to happen and more time for larger moves to be made.
Backwardation
If you see a curve that looks like this:
The market is in backwardation.
The subsequent months are lower in volatility than the near months.
This means that there is an event happening or an impending event that is about to happen that is causing heightened volatility in the near month.
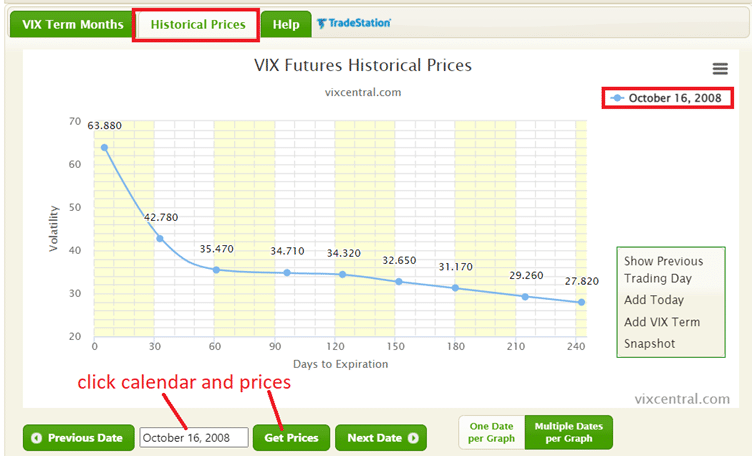
I pulled up this chart by clicking on the “Historical Prices” tab and setting the date to October 16, 2008 (in the midst of the global financial crisis).
You can go back in time to see the contango/backwardation status of any day in the past (till March 26, 2007) by clicking on the calendar and the “Get Prices” button.
Or you can go day by day with the “Next Date” button.
You will note that on the historical charts, the horizontal axis changed to say “Days to Expiration.”
No matter, it is the shape of the curve that we are looking at.
Mixed
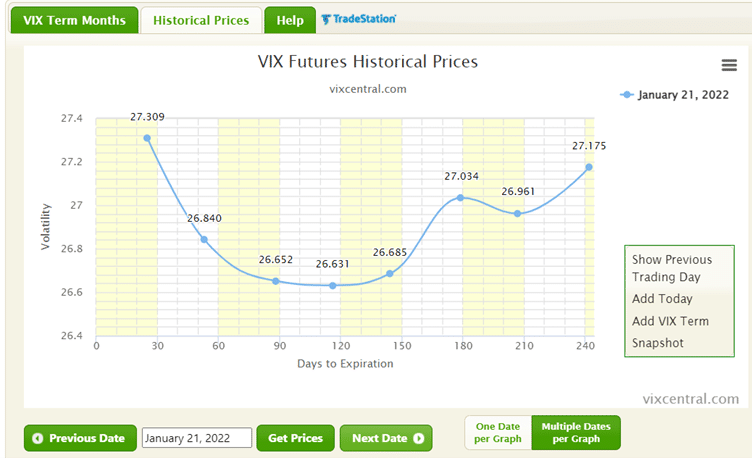
When the term structure is mixed as here:
We would rather say it as “mixed.” Because a mixed curve does represent a slightly abnormal market and we would be reluctant to say that it is in full contango.
However, if we were forced to say whether it is contango or backwardation, then we would look at the curve for the front two months — as these are the two months most immediate to us.
If the second month is higher than the first month (as in the above chart), we would reluctantly give our answer as “contango.”
Although in our minds, we know to be wary since the market is not in full contango.
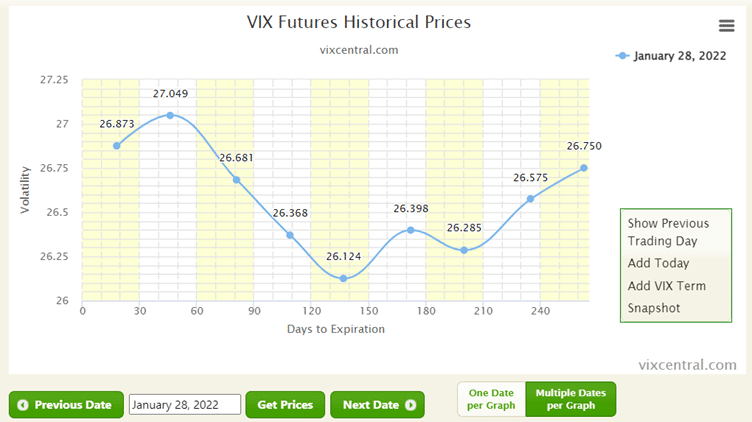
If the second month is lower than the first month (as in the below chart), then we can say backwardation.
The market will sometimes go through a mixed state as it transitions from contango to backwardation and vice versa.
Bad Things Happen In Backwardation
A saying that helps as a reminder is that “bad things happen in backwardation.”
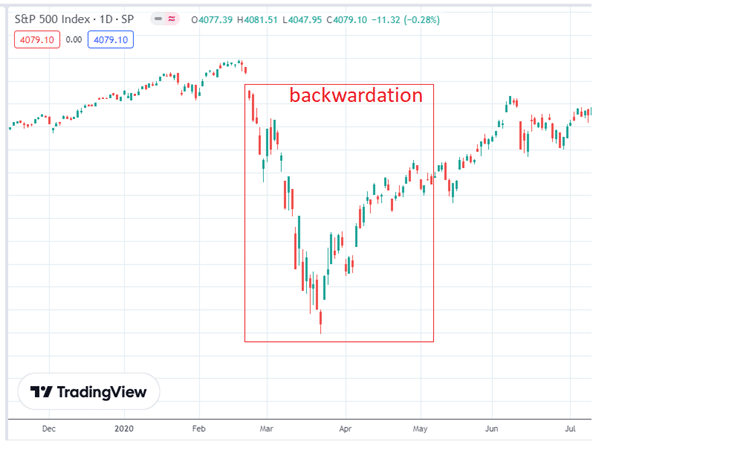
Would backwardation have told us that the Covid crash of February 2020 was not just a normal dip in the market?
Backwardation showed up on February 24, 2020 (a few days after the start of the drop). Backwardation continued without any contango days all the way until May 7, 2020, when we got back into contango.
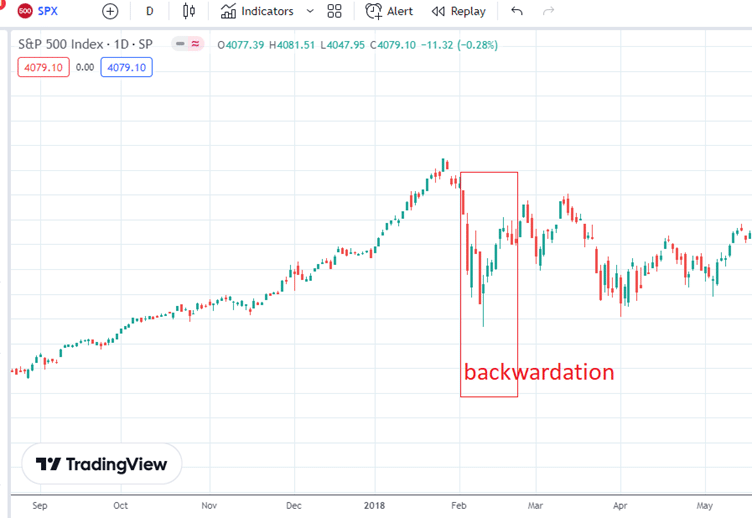
Would backwardation have foretold of Volmageddon, the day on February 5, 2018, when the DOW index lost 1500 points intraday?
The market was in backwardation the trading day before, on Friday, February 2, 2018. And continued in backwardation up until February 22.
What about the Flash Crash of May 6, 2010?
The trading day before was not in backwardation.
But the day of May 6 was. And the next couple of days after that as well.
FAQs
What percentage of the time is the market in contango?
On a yearly basis, the market is in contango the majority of the time.
The exact percentage depends on the given year.
In bullish years, the percentage of trading days that the market is in contango will be higher.
As an example, consider the bullish year of 2021; the market was in backwardation only on two trading days: January 27, 2021, and December 3, 2021.
Assuming that a typical year has 252 trading days on average, the year 2021 was in contango 99% of the time.
On a bearish year like 2022, it has 63 trading days in backwardation.
Hence, the year 2022 was in contango only 75% of the time.
Conclusion
The VIX futures term structure gives us information on market sentiment.
If we see backwardation in the term structure, we might consider lightening up our positions or taking profitable positions off the table.
For those trading using the Greeks, one might consider reducing the total amount of positive deltas or making adjustments to increase negative deltas — as an example.
Those trading range-bound strategies may want to check to ensure the market is not in backwardation before initiating a trade.
Backwardation often comes with large market moves.
These strategies, in particular, do not like for the market to make big moves.
Before making a trade or adjustment, the trader can also use contango and backwardation to gauge the state of the market.
We hope you enjoyed this article on how contango and backwardation.
If you have any questions, please send an email or leave a comment below.
Trade safe!
Disclaimer: The information above is for educational purposes only and should not be treated as investment advice. The strategy presented would not be suitable for investors who are not familiar with exchange traded options. Any readers interested in this strategy should do their own research and seek advice from a licensed financial adviser.


