
Order flow trading is a buzzword thrown around in the trading community lately.
But it’s a legitimate trading style among short-term traders.
Order flow trading refers to a set of trading strategies that aim to predict short-term price movements by analyzing the current dynamics of the markets.
This is done by looking at supply and demand, volume, time and sales, and resting orders (if you have that level of access).
This information is then used to try and discern which side has the most urgency and is the most aggressive.
The goal is to try to get in front of the larger orders and benefit from the momentum as their orders are filled.
Order flow trading has evolved over decades as markets have become more sophisticated and tools have evolved to fit their needs.
While the concepts date back to pioneers like Jesse Livermore reading ticker tapes, current order flow approaches use fast-moving charting platforms, high-powered algorithms, and often stunning visualizations to show who controls the tape.
The techniques are so powerful that many big banks have entire teams working on quantitative techniques to trade these strategies, but you don’t need any of them to become proficient in them.
You just need a few tools, a market data feed, and the patience to learn to read the market.
Contents
What Is Order Flow Trading, And How Do You Do It?
The basic tenant of order flow trading is reading the time and sales or “tape,” as it is colloquially called.
You can combine this with other tools like level 2, which we will discuss shortly, but you only need the tape.
By watching the tape, you are trying to discern who is ‘winning” in the battle of buyers vs. sellers.
If orders keep coming through on the bid, and the bid keeps getting filled lower, then it’s safe to say there is more sell pressure than buy pressure.
The same can be said for the opposite direction.
These methods are so powerful that you can see the instant the market temperature changes.
For instance, let’s say the bid keeps getting hit lower and lower, and then suddenly, a huge offer comes in and keeps getting filled at the same price.
Liquidity starts to dry up, and price starts to reverse.
Now, fills are going off of the offer/ask.
This would be a clue that the sellers are done in the short term.
Now add to this the market depth (level 2) to see where some larger offers are sitting, and you can start to build out a thesis about support and resistance levels based solely on where liquidity is sitting.
Changes in market depth over time also indicate shifts in supply and demand.

Primary Tools Of Orderflow
As discussed above, time and sales or tape are vital to order flow traders.
This and level 2 are the primary tools traders use to gauge market sentiment, direction, and momentum for their trading.
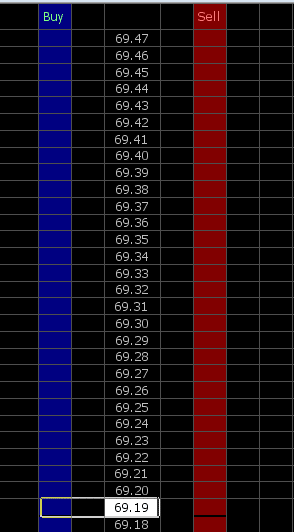
Some platforms combine these into what is called a ladder, combining bid side and ask side offers and a live look at which side the most recent orders have been executed.
An example is the CL (crude) ladder on the right.
Another popular tool now is the volume by price/volume profile.
This tool shows how many lots/contacts/shares have been executed at each price level.
This is critically important to order flow traders because it shows where previous interest in trading occurred, where many contracts are traded (proving liquidity), and where there are low levels of volume traded, showing possible areas of support and resistance.
These tools are fairly new but have been adopted almost universally by order flow traders.
Orderflow Setups
Now that we have looked at the basics of order flow and some of the tools of order flow trading let’s look at a few common setups that traders can utilize to trade the market.
The first setup we will look at is a common one but requires extensive experience to spot and trade. That is the “iceberg” or refreshing order.
For this setup, a trader will watch a tape or ladder and see that the price is trending in a specific direction.
Let’s say crude oil prices are coming down to the 71 price level.
The trades mostly go off the bid, and the bid keeps trading lower.
Eventually, it hits 71, and the price stops going lower.
You see orders filling at 71 and 71.01 at increasing volume.
Then it happens: you see several orders sweep upward towards 71.05, and then more and more orders start to go off the ask.
This is a sign the trade is on; you enter around 71.05 and ride the trade for ten ticks to 71.15.
While this is a drastic oversimplification, it’s the basics of the setup.
The second setup we will look at is called the ledge break and requires the volume profile.
This trade can work on any timeframe that you can plot a volume profile. In this trade, you look for an area where volume is extremely low.
As the price approaches, you want volume to stay strong at that level.
The trade is active once the price pops through the level and closes there.
You can see an example below on the SPY.
Price bounces off of the 420 level several times until it finally breaks.
Once it does, it zips up, consolidates, and then continues.
This is a form of a breakout trade.

Requirements And Pitfalls
The only real requirement for order flow trading is access to the data.
Most brokers and platforms now have some form of volume profile you can trade with.
In addition, you can buy additional level 2 data (also called market depth) for a monthly subscription.
If you can obtain these two things, you can trade orders on a technical level.
There are some pitfalls to it, though.
First is the time requirement.
Most order flow traders spend significant time watching the tape, the level 2, the price ladder, and the volume profile for the instrument they trade.
This trading technique requires you to know what you are seeing.
It takes time to build confidence that you are reading the market correctly, and it takes a lot of time to learn how to watch the raw flow of transactions and learn to pick out what is relevant for your trading.
Finally, and perhaps most prohibitive to this method, is that it is highly instrument-specific.
Highly liquid stocks will trade differently than low-liquidity stocks.
If futures are your instrument, then every type of future respects volume and price levels differently.
This is probably the largest detractor from this method.
Even with that being a large issue, though, once you learn on one instrument, the skills are transferable to all of them.
You just need to spend a few days reviewing how price responds to levels and volume.
Wrap Up
In summary, order flow trading represents a very specific type and style of trading.
It can apply to almost any instrument and, depending on how you trade it, can work on any timeframe.
It takes a significant amount of time to learn and understand, but once you do, no one can take that skill away from you.
If you can learn how to trade order flow efficiently, you will have learned the language of the market and will become a more profitable trader.
From a technical perspective, several new advancements can and most likely already are being applied to this type of trading.
Machine learning is being applied to large quantities of market data and provides an area of significant potential in the realm of trading.
As these neural networks process more training data, they will uncover more subtle patterns not detectable to human analysts.
This will open up faster trading signals that will be more profitable to the owners of the machines.
The problem is that these models must be retrained once a market paradigm shifts.
This is where the human wins.
If you know how to read order flow, you can quickly adapt and profit.
This makes you the superior trader to the machines.
We hope you enjoyed this article on order flow trading.
If you have any questions, please send an email or leave a comment below.
Trade safe!
Disclaimer: The information above is for educational purposes only and should not be treated as investment advice. The strategy presented would not be suitable for investors who are not familiar with exchange traded options. Any readers interested in this strategy should do their own research and seek advice from a licensed financial adviser.


