


Uncover the ‘Tom King 112 Income Options Strategy’—a reliable approach for generating income in options trading.
In this post, we’ll delve into the intricacies of this strategy, exploring its principles, implementation, and potential benefits for investors looking to bolster their income portfolios
Contents
In mid-2023, options trader Tom King (with 30 years of trading experience) published this video explaining his favorite strategy, known as the 1-1-2.
It is called the 1-1-2 because it consists of one out-of-the-money long put option, one short put option below that, and two short put options below that.
Yes, that’s correct.
You have two naked short-put options.
Or preferably, it should be cash-secured put options.
The trade is meant to run to expiration unless it reaches its exit loss trigger first.
Potentially, you would be obligated to purchase stock at the strike price should the short put expire in the money.
Although, this would be an unlikely scenario.
Based on how the trade is set up, it has a theoretical win rate of 95% (because the two short puts are typically out at the 5-delta location).
Nevertheless, you should do this trade on liquid assets where you don’t mind purchasing the stock at a discount.
This is akin to the first step of the Wheel strategy.
If you get assigned, take the stock and sell covered calls, exit, or whatever you like.
While most of the time, when the stock is not assigned, you collect regular credits.
This is a trade initiated for a credit to achieve no upside risk.
Let’s look at the analysis graph. While Tom King likes to trade this on futures, we are doing this example on SPY (the S&P 500 ETF).
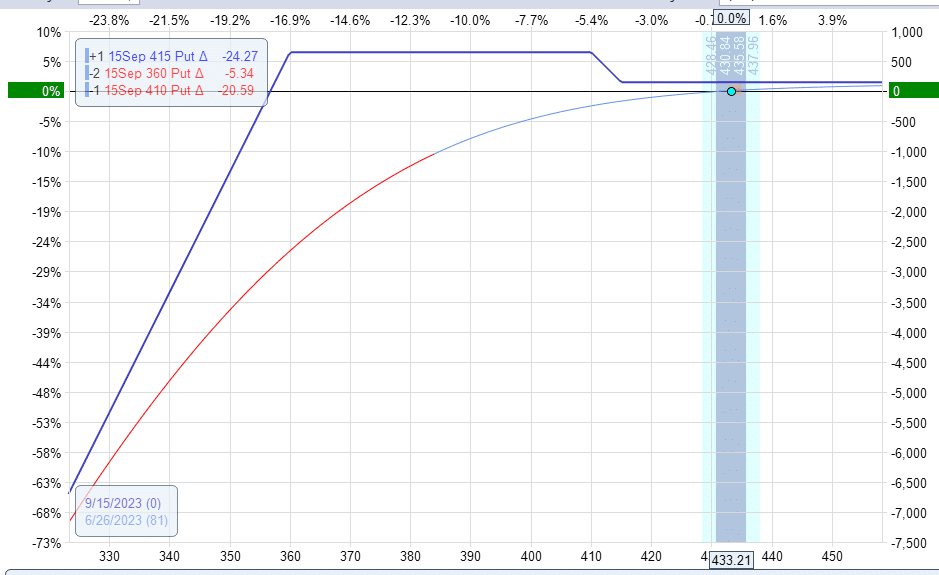
The graph was constructed with an out-of-the-money put debit spread at around the 25 delta, And then the sale of the two short puts further out-of-the-money to get a net credit.
Trade Details
Date: June 23, 2023
Price: SPY @ $433
Buy one Sept 15 SPY $415 put @ $5.06
Sell one Sept 15 SPY $410 put @ $4.34
Sell two Sept 15 SPY $360 put @ $1.10
Net credit: $147
The proceeds of the short puts need to be greater than the cost of the put debit spread so that we get a net credit, which in our case is $147.
The net credit is what makes the trade have no upside risk.
You would keep this credit if all the put options expire out of the money.
If the price expires in the trap (the high hump on the expiration graph), the trade will make about $650, about four times the credit.
The buying power reduction depends on your account and broker, but a trade like this typically uses up $7273 of buying power.
$147 / $7273 is 2% in 81 days, up to 9% annualized. This example trade has been configured for a smaller profit potential than what Tom King would do. But it is more conservative for a bearish market.
Tom King tries to target at least 3% per month, or 36% annualized.
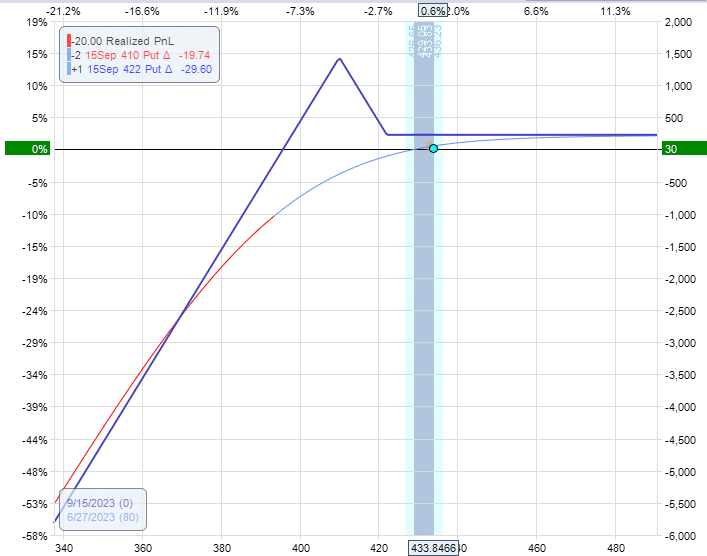
Flexible Structure
The structure is flexible enough so that you can adjust the strikes depending on how bullish or bearish you feel.
If more bullish, then set it up with greater upside credit.
This credit is seen in what is known as the “tail” of the expiration graph.
If more bearish, then set it up with a larger downside trap.
The hump in the expiration graph is known as the trap because if the price falls in there at expiration, your gains can be 3 to 4 times as large as what you get at the tail.
Alternatively, you can view the trade as selling premium from the short puts hedged by a put debit spread.
If the short puts have gained 95% of their potential profit, buy back the short puts to close them.
Now you just have a free hedge for your portfolio in case of a black swan crash.
Exit Loss Trigger
If the trade loses an amount equal to the max potential profit of the trade at the trap, exit the trade before losing any more – unless you are willing to take assignment on the underlying and keep it as a long-term holding or use it for the Wheel strategy.
You can also consider rolling the short put out in time to receive a credit and potentially delay or prevent the assignment.
Hold To Expiration
Otherwise, hold the trade to expiration (or at least very close to expiration) to capture the full profit potential of the trade.
This is not a hard rule.
If, for example, the price is in the trap and you see the price about to rally out of the trap, you might want to close the trade to lock the profit instead of taking the smaller profit of the tail.
Alternatively, you can lock in profits by narrowing the width of the put debit spread.
Days To Expiration
We have used 81 DTE (days to expiration) in this example. You can do the 1-1–2 anywhere from 45 days or higher DTEs.
There are advantages to using an even longer term, although I know some of you may not be used to these super-long DTE trades.
Tom King is using 120 DTEs.
How to Set Up the 1-1-2: Step by Step
Step 1 — Choose your underlying. The 1-1-2 works best on liquid underlyings you’d be comfortable owning if assigned. SPY, QQQ, and broad index ETFs are the most common. Tom King primarily trades futures (/ES, /MES) where the margin treatment is more favourable. For retail equity traders, SPY and QQQ are the most practical starting points as well as highly liquid stocks such as AAPL, AMZN, NVDA etc.
Step 2 — Set your DTE. Tom King uses 120 DTE. The original article example used 81 DTE. Most practitioners suggest 45–120 DTE — longer duration gives the short puts more time to decay, reduces the day-to-day Greeks sensitivity, and gives more time to manage if the underlying moves lower. Avoid very short DTE (under 30 days) as the naked puts carry significant gamma risk close to expiration.
Step 3 — Build the put debit spread. Buy an OTM put at approximately 20–25 delta. Sell a lower strike put to create the debit spread. The spread acts as your hedge — it caps your downside loss if the market falls sharply. Width of the spread is typically $5–$10 for SPY, $100–$200 for SPX.
Step 4 — Sell the two naked puts further OTM.Place both at approximately 5 delta — roughly 2–3 standard deviations below the current price. These are the income generators. The premium from both naked puts must exceed the cost of the debit spread so that the overall trade is entered for a net credit.
Step 5 — Verify your net credit and risk. Confirm the trade is entered for a credit. This credit is your profit if all options expire OTM. If the underlying falls into the “trap” zone at expiration, your profit can be 3–4 times the initial credit. Your maximum loss is undefined to the downside if the naked puts are breached — manage this with your exit loss trigger.
Step 6 — Set your exit rules before entering. Define your profit target (full credit, or close short puts at 95% profit), your stop loss (typically equal to the max profit of the trap), and your assignment plan (are you willing to take stock? Will you wheel it? Or will you always close before assignment?).
The 1-1-2 Family: Variants Worth Knowing
The original 1-1-2 is the foundation, but Tom King and others have developed several variants that address specific trader concerns. Here’s an overview — each links to a more detailed article:
The Defined-Risk 1-1-2 replaces the two naked short puts with put spreads. This eliminates the undefined downside risk and reduces the margin requirement, at the cost of reduced premium income.
It’s better suited to traders who can’t or don’t want to hold naked short puts, or who want to trade on cash-settled indices like SPX where assignment isn’t possible. See the Full guide here.
The Calendarized 1-1-2 separates the legs across different expirations: the put debit spread at 150 DTE and the naked puts at 30 DTE. By having shorter DTEs for the naked puts, they can come off earlier, leaving the put debit spread in place as a long-term hedge.
By layering these trades at various time intervals, the portfolio can reach a ratio of five put debit spreads for every two naked puts. See the Full guide here.
The 1-1-1 uses one naked put instead of two — a more conservative version with lower income potential but reduced assignment risk. Suitable for traders who want the strategy’s structure but are uncomfortable with the double naked put exposure.
New to options income strategies?
Before adding the 1-1-2 to your portfolio, make sure you’re comfortable with the foundational income strategies it builds on. Download the free Bullsh*t Free Guide to Iron Condors — 74 pages of systematic income trading principles that apply directly to the 1-1-2 approach.
Capital Requirements and Position Sizing
One of the most common questions about the 1-1-2 is how much capital you need and how to size it.
The buying power reduction for a standard SPY 1-1-2 is typically $5,000–$10,000 per trade depending on strikes, broker, and whether you’re using a margin or cash account. For SPX futures the margin treatment is more favourable, which is partly why Tom King trades it on /ES.
Tom King’s own position sizing rules are worth noting: he risks no more than 2% of his portfolio in any single trade, uses only half his account for trading, and never allocates more than 30% of that trading capital to any single strategy.
Applied to a $100,000 account that means a maximum of $15,000 deployed across all 1-1-2 positions — roughly 2–3 concurrent trades at standard SPY sizing.
For traders with smaller accounts, the defined-risk version or the 1-1-1 variant are more capital-efficient starting points.
Frequently Asked Questions:
How is the 1-1-2 different from selling a strangle?
Both are non-directional premium-selling strategies making money as time passes.
The short strangle is more efficient because it can generate greater income with less buying power.
It is more efficient because the strangle has no hedges (hence no “friction”).
However, it has risks on both sides should the market go up or down significantly.
The 1-1-2 is a more conservative trade with no risk on the upside.
It has a debit spread as a hedge. By being safer, it has less return potential.
How is the 1-1-2 different from a cash-secured put?
A cash-secured put and the 1-1-2 are undefined risk strategies with unlimited risk on the downside.
However, the 1-1-2 has a put debit spread hedge; the cash-secured put does not.
This makes the 1-1-2 downside risk further out; hence, some would say it is a more conservative trade.
How is the 1-1-2 different from the put-ratio spread?
It is very similar to a put-ratio spread in that both can be constructed with no upside risk.
And both have unlimited downside risks.
The difference can be seen on the expiration graph, where the ratio spread has a triangular peak.
The 1-1-2 has flattened out that peak so that its max potential profit is less but has a wider range in which it can profit.
How Does The 1-1-2 Compare To The Wheel Strategy?
The first leg of the wheel (selling a cash-secured put) is structurally similar to the naked short puts in the 1-1-2.
The key difference is that the 1-1-2 adds a protective debit spread above the naked puts, which reduces net income but provides a downside buffer.
The 1-1-2 is better suited to traders who want lower probability of assignment; the wheel is better suited to traders who are comfortable owning the underlying and want to systematically generate income through assignment and covered calls.
In fact, if your 1-1-2 short puts do get assigned, transitioning to the wheel is a natural next step — take ownership of the shares and begin selling covered calls.
Is The 1-1-2 Suitable For Small Accounts?
The standard 1-1-2 with naked puts requires meaningful buying power.
For accounts under $25,000 the defined-risk version (using put spreads instead of naked puts) is more appropriate, as it has a lower and capped margin requirement.
Traders with very small accounts ($5,000–$10,000) should look at simpler defined-risk strategies first, such as bull put spreads or iron condors, before adding the complexity of the 1-1-2 structure.
What Is The Best Underlying For The 1-1-2?
Tom King trades /ES and /MES (S&P 500 futures) primarily, which have favourable margin treatment and 60/40 tax treatment.
For retail equity traders, SPY and SPX are the most common alternatives.
SPX has the advantage of cash settlement (no assignment risk) and 60/40 tax treatment.
SPY allows for assignment which connects naturally to the wheel strategy.
For individual stocks watch out for earnings risk and gap risk.
Conclusion
This is a nice income-style strategy to add to your portfolio.
However, as Tom King mentioned in his video, he does not risk more than 2% of his portfolio in any single trade.
He uses only half of his account size for trading.
And he never allocates more than 30% of that to any trading strategy,
We hope you enjoyed this article on the Tom King 1 1 2 income strategy.
If you have any questions, please send an email or leave a comment below.
Trade safe!
Ready to Build a Systematic Income Portfolio?
The 1-1-2 is one of several income strategies worth understanding as an intermediate options trader. Options Income Mastery covers the complete framework — from foundational credit spreads through to iron condors, the wheel, and more advanced structures — with the exact entry rules, position sizing, and management discipline that makes income trading consistent over time.
Disclaimer: The information above is for educational purposes only and should not be treated as investment advice. The strategy presented would not be suitable for investors who are not familiar with exchange traded options. Any readers interested in this strategy should do their own research and seek advice from a licensed financial adviser.


There is an occasional mention of Discord chat, How can I sign up for that?
Hi Bruce. That’s part of my Accelerator Program. The next enrollment period will open in late Aug/early Sept. I will email you when it opens.