


I know you have heard about risk management so many times before.
So today, we will talk about a concept in risk management that I don’t see mentioned much on the internet.
Do you know your personal P&L distribution curve?
Your P&L (profit and loss) distribution curve must be of a certain shape to be profitable.
If you are not profitable, you need to reshape this P&L distribution curve.
Contents
This article will discuss two ways to affect this distribution curve.
First and foremost, you must change the way you handle risk.
The second step is to let your winners run.
Managing Risk
I know that all of you reading this are already managing risk.
I don’t have to tell you that managing risk is essential whether you are trading options, futures, Forex, or stocks.
But are you managing risk enough?
The P&L distribution curve will tell you if you are or not.
What do I mean by the P&L distribution curve?
Consider the following bull put credit spread, which received a credit of $170 on entry.
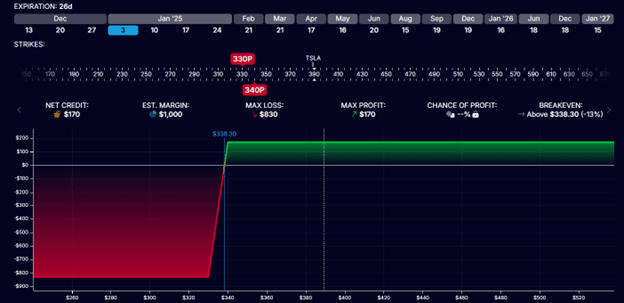
While the underlying ticker is not important, you probably can see it in the graph near the $389 price mark that the underlying is currently trading.
With a max risk of $830 and a max potential reward of $170, this trade has a risk-to-reward of 4.8, which is acceptable and typical of such out-of-the-money credit spreads.
Imagine a trader who likes to trade these spreads and takes profit at around 50% of the credit received, which is not uncommon.
In this case, his profit target is $85.
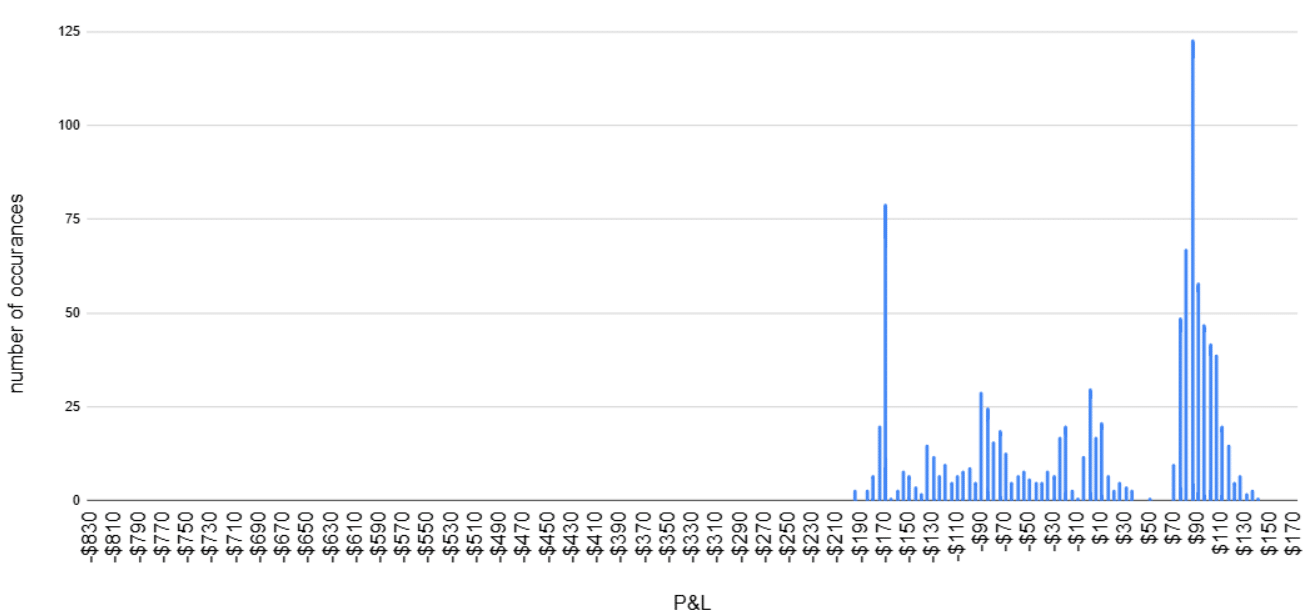
After 1000 trades, he uses a spreadsheet to plot the P&L of each trade in a histogram like this:
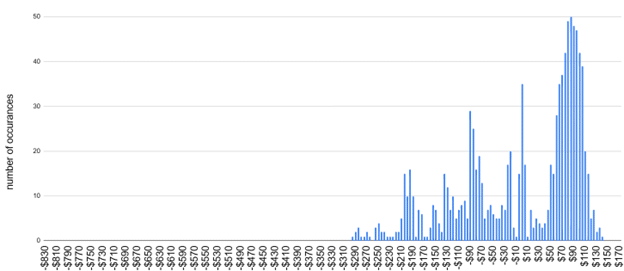
The P&L is shown on the bottom horizontal x-axis.
The number of occurrences of that P&L is shown in the vertical y-axis.
This is what I mean by the P&L distribution curve.
It tells you how your profit and loss are distributed.
Do you have lots of wins in comparison to losses, or vice-versa?
And how large are each?
For example, of the 1000 trades, he had 50 trades that made a profit of $85.
You see this in the graph as the highest histogram bar with the highest number of occurrences.
This is expected because he is taking profits when the spread makes $85 (half of the credit received).
We see a high number of wins clustered in the $70 to $110 P&L range.
Another cluster of trades broke even at a P&L of zero.
These might have been losing trades that came back to breakeven, and he decided to close them without taking a loss, which is also a valid option trading risk management strategy.
There will, of course, be some losing trades.
He knows better than to take a maximum loss on a credit spread.
So, he exits the trades he does not think will return to profitability.
There is a cluster of losses around the negative -$85 loss level.
This is because he knows not to let the dollar amount of his losses be too much larger than his wins, which is also a valid strategy for managing risk in options trading.
Now the question is:
Looking at this distribution graph of wins and losses, do you think this trader is profitable?
Okay, I’ll give you more info by showing you the P&L of each of the 1000 trades:

Additional hint:
There are 553 wins and 412 losing trades.
Thirty-five trades were at breakeven.
If you accumulate all the P&Ls over the number of occurrences, you will find that this distribution profile is NOT profitable despite having more wins than losses.
The net loss from all of the 1000 trades was -$2005.
While the trader made good attempts at managing risk, the risk control was still not tight enough for his particular take-profit level.
Without tracking the wins and losses, he would not have known this and would not know that he needed correcting.
In fact, he might even think he is doing good with more wins than losses.
After all, the largest loss was only -$295, which is nowhere near the maximum loss of $830 possible for the spread.
One problem is that he did not have a specific exit loss trigger in place.
He just said that he would exit the trade if he “thinks” that the trade would not come back into profitability.
This is too subjective, and is too easy to have trades end up with large losses.
Options trades such as this out-of-the-money credit spread are “high probability trades.”
That does not mean high profitability trades.
It just means that statistically, you will have more wins than losses.
Just because you have more wins than losses does not mean you will be profitable, especially if you don’t manage the risks.
The long protective put is not going to manage the risk for you.
By the time this long put caps the risk, the risk would have gotten so big as to wipe out five max win trades.
The only way to be profitable is to cap the risk ourselves with our mental stop loss and to exit the trade at the appropriate loss level.
Manage Risk By Cutting Large Losses
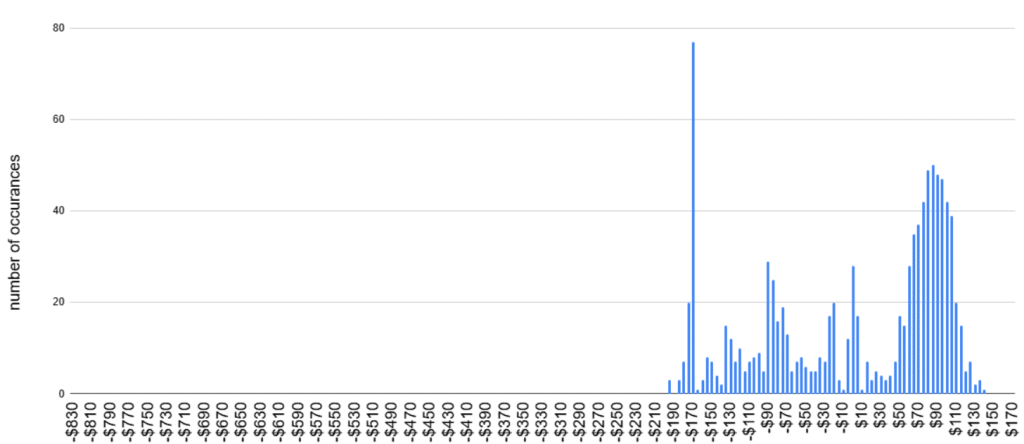
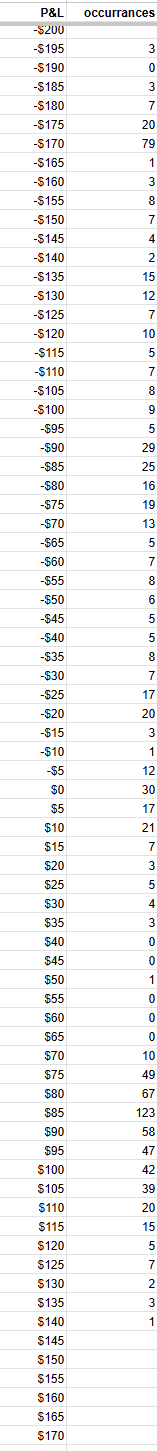
Let’s help this trader become profitable by putting a rule in place to exit the trade whenever the loss exceeds twice the take-profit level.
Since he had set his take-profit level at $85, he would exit the trade whenever the loss reached $170 without exception.
No more saying, “I’ll give this trade more time because the technical levels say it should bounce.”
No more saying, “I’ll make this one exception.”
With this rule in place, the P&L profit distribution might look like this:
What do you think?
Do you think this new distribution is profitable now or not?
There are many losing trades at the -$170 loss level – 77 trades to be exact.
This is because all the previous trades with losses greater than $170 are being cut short and exited at the -$170 loss level.
A few trades exceeded the -$170 loss level due to slippage, not being at the computer, overnight gap risks, etc.
Nevertheless, there were no trades that lost more than -$195.
It is true that when you tighten the stop loss, you will get slightly more losing trades.
Because some of the previously losing trades had come back to breakeven, you now have locked in their loss without possibly returning to breakeven.
This time, the spreadsheet had 419 losses and 28 breakeven trades – more losses and fewer breakeven trades:
We didn’t touch any of the 553 winning trades.
This new profile distribution is profitable.
Not by much (only profitable by $215) – but profitable nevertheless.
Don’t Cut Winners
Let’s see how we can make this trader even more profitable.
Last time, many trades had profits between $40 and $75.
This is because the trader was taking profits early.
If the trade shows a $70 profit, one has to ask why the trader is closing the trade before hitting the profit target.
Sometimes, it is necessary to exit early due to technical issues and changing conditions.
It is often because the trader fears that the profit will slip away.
As Peter Lynch said in his 1989 book One Up On Wall Street:
“You won’t improve results by pulling out the flowers and watering the weeds.”
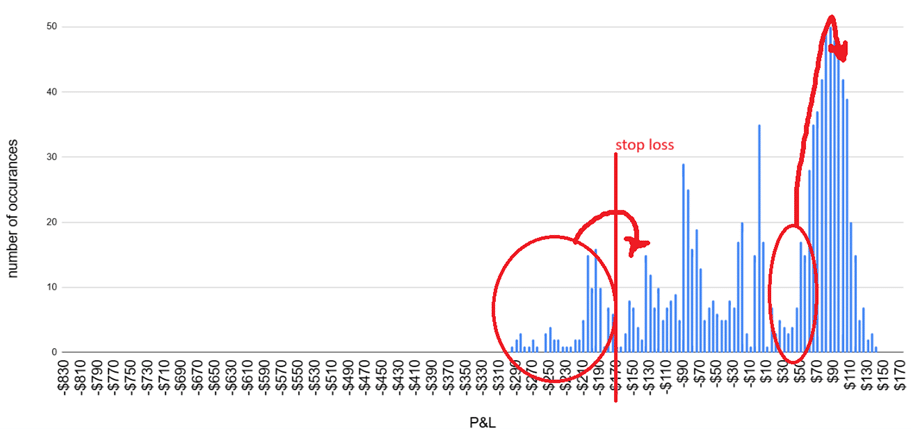
So, after the trader trained himself not to take profits early, this is the new P&L distribution:
This time, the histogram has noticeable gaps around the $40 to $75 profit levels.
By holding these trades longer, many of them reached the $85 profit target level.
It is true that when a trade is held longer, it is more likely to encounter an adverse event, and profits will be lost.
Let’s say that in this hypothetical situation, four of the trades were like that.
Two of them had profits that slipped to zero, and two of them slipped all the way to stop loss.
So now we have two extra occurrences at the -$170 loss level and two more breakeven trades.
However, many more trades showed up at the $85 profit target.
The resulting tally is that there were 421 losing trades, 30 breakeven trades, and 549 winning trades.
This last profile had more losing trades and fewer winning trades than the previous two.
Do you think this is a profitable distribution?
Well, it is, and it is the most profitable of the three.
The net profit from the 1000 trades is $1200.
Summary
As illustrated by our example, one aspect of options trading risk management is to cut losses short and let winners run.
But as we all know, trading is not as simple as that.
There is always a balance.
We can not set our stop losses too tight or let our winners run forever.
We need to track our wins and losses to find that balance.
You may not need to go as far as graphing it out in a histogram.
But at least know the number and size of wins to the losses.
And don’t let the losses be too much bigger than the wins.
By “bigger,” I don’t mean just the dollar amount; it is the combination of the number and the size of the loss.
First and foremost, in options trading, risk management is to eliminate large losses.
You have probably heard this elsewhere before.
But did they show you the P&L distribution curve?
No?
Well, perhaps that is a good thing.
Because you saw it here may give you an edge over those who have not seen it.
By visually seeing this concept in action via the P&L distribution curve, you understand why cutting those losses is essential.
You are cutting off the left tail of the distribution curve.
And you are shifting the bulk of the histogram to the right side.
And that is how to reshape the P&L distribution curve to become profitable.
We hope you enjoyed this article on options trading risk management.
If you have any questions, please send an email or leave a comment below.
Trade safe!
Disclaimer: The information above is for educational purposes only and should not be treated as investment advice. The strategy presented would not be suitable for investors who are not familiar with exchange traded options. Any readers interested in this strategy should do their own research and seek advice from a licensed financial adviser.


