


Today, we’re looking at an ichimoku trading strategy. We will show you what to look for to tell you when the price is in a strong trend.
Contents
- The Five Parts
- Basic Principles
- The Kumo
- Sanyaku Koten means Three Positive Signs
- When To Exit
- Trading The Consolidation
- Backtesting Is A Bit Difficult
- Conclusion
When some traders turn on the Ichimoku indicator, they turn it off because all they see is a jumble of lines.
The system of indicators is known as “Ichimoku Kinko Hyo.”
It is often called “Ichimoku” or “Ichimoku Cloud” due to its cloud-like appearance on the chart.
The Ichimoku Cloud was invented by the Japanese chart analyst Goichi Hosoda, who used the nickname Ichimoku Sanjin.
Born in 1898, he was reading charts at the age of 10.
He invented the system in 1935, but it was not known to the public.
In 1950 he taught the system to only three people, who had paid him good money to learn it from him.
“Good money” means enough money at the time to build a new house.
In 1960, he decided to publish seven books on the system.
Four volumes can be purchased in Japan, but the other three must be read at the National Tokyo Library.
The Five Parts
This is a prototypical example of a bullish trend:
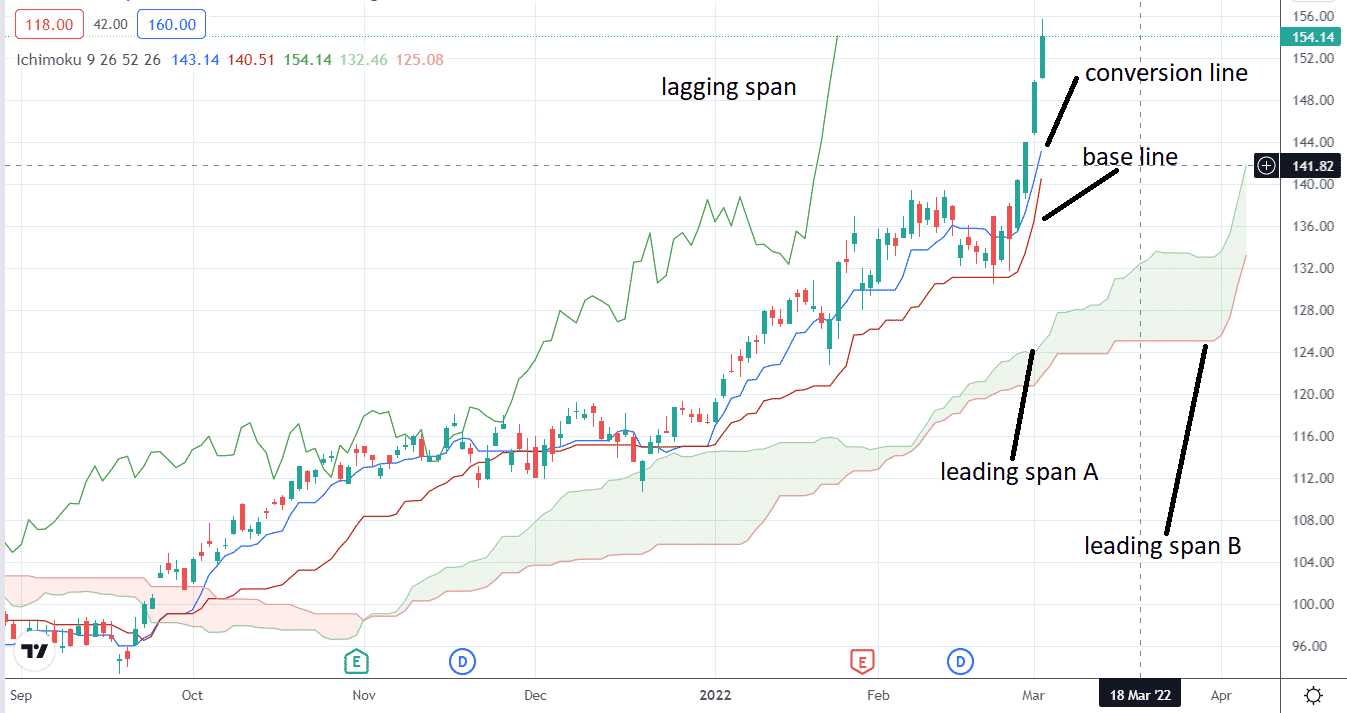
source: tradingview.com
Note that each of the five components is fairly spread out.
- Tenkan-sen (Conversion Line): It is the midpoint price of the highest price and the lowest price over the last nine days. When the price is at this line, buyers and sellers are in balance in the 9-day time cycle.
- Kijun-sen (Base Line): It is the midpoint of the highest and lowest prices over the last 26 days. When the price is at this line, buyers and sellers are in balance in the 26-day time cycle.
When the price continues to be bullish, the conversion line will act as support for the price. The secondary support will be the base line.
These two lines behave like faster and slower moving averages.
- Senko Span A (Leading Span A): The average of the Conversion and Base lines plotted 26 periods ahead of the candles. In an uptrend, this line forms the top edge of the cloud. When price cross this line into the cloud, take warning.
- Senko Span B (Leading Span B): It is the midpoint of the highest price point and the lowest point over the last 52 days. It is also plotted 26 days ahead and forms the bottom edge of the cloud. It is the equilibrium point between buyers and sellers over a long-time frame. When the price is above Leading Span B, buyers are still stronger than sellers. But if the price breaks below this line, it means that the price has gone down through the cloud. Seriously consider closing the long positions at this point.
- Chiko Span (Lagging Span): The current closing price plotted 26 candles back. When this line is above the candles, it is bullish. The further above the candles, the more bullish it is.
It is recommended that you do not change the default system of the indicator’s settings.
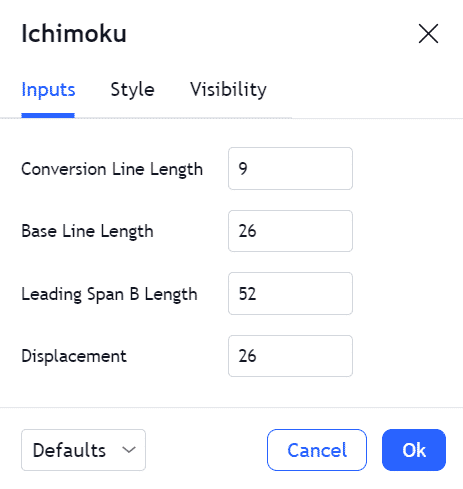
source: tradingview.com
The 9, 26, 52 periods are chosen based on Ichimoku’s time theory.
He felt that time is very important. It is, after all, the second axis on the price chart.
In the above descriptions, I use the word “days” as in “26 days”.
This is 26 trading days, not calendar days.
Ichimoku was plotting the charts by hand on the daily timeframe (no computers back then).
Some traders do find the Ichimoku indicator to work best in this timeframe.
However, it can be used in other timeframes.
And when doing so, then the words “26 candles” or “26 periods” would be more accurate.
Basic Principles
- Price above the cloud is bullish. A Price below the cloud is bearish. The thicker the cloud, the stronger the trend.
- Price inside the cloud can go in either direction. Most trend traders will not initiate a trade when the price candle is inside the cloud. If the price is an airplane, you don’t want to fly inside the cloud.
- If the leading edge of the cloud is green, that is bullish. A leading edge red means bearish.
- When the conversion line crosses the base line from below, that is bullish. It’s even more bullish if the cross happens above the cloud, vice versa for bearish.
- When the tip of the lagging span is above the bullish price — more so if the tip is above the cloud. Opposite for bearish.
- When all five lines are interacting right next to each other, price is in consolidation. When all five lines are separated and spread out, price is in a trend.
The Kumo
Some people say, “kumo cloud.” That’s okay.
But know that they are saying “cloud cloud”, since kumo means cloud in Japanese.
Kumo is the dominant feature of this very visual indicator.
When the cloud is angle is up with both leading spans pointing up (or at least neither is pointing down), that is a bullish sign.
When the cloud is long, the trend is stable.
It is less likely to change the trend when the cloud is thick.
When the cloud is getting thin, there is a probability of a kumo twist where the cloud changes color.
A kumo twist is not enough to say there is a trend change.
However, it is a warning that the current trend may have ended.
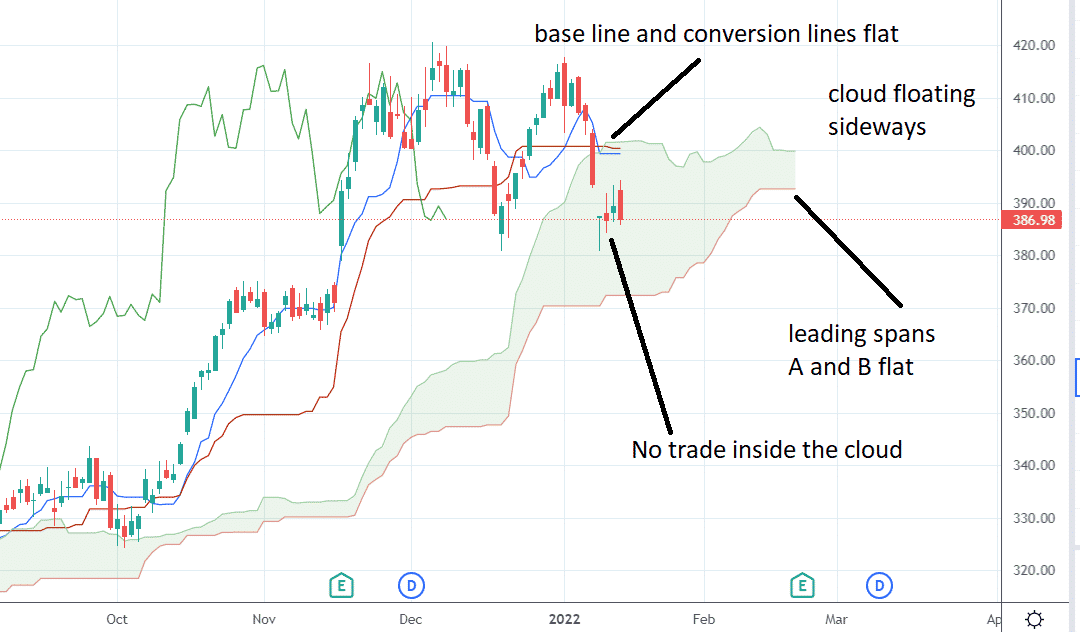
Here is an example where the kumo is thin, short, and has no angle.
There is no trend — difficult to trade.
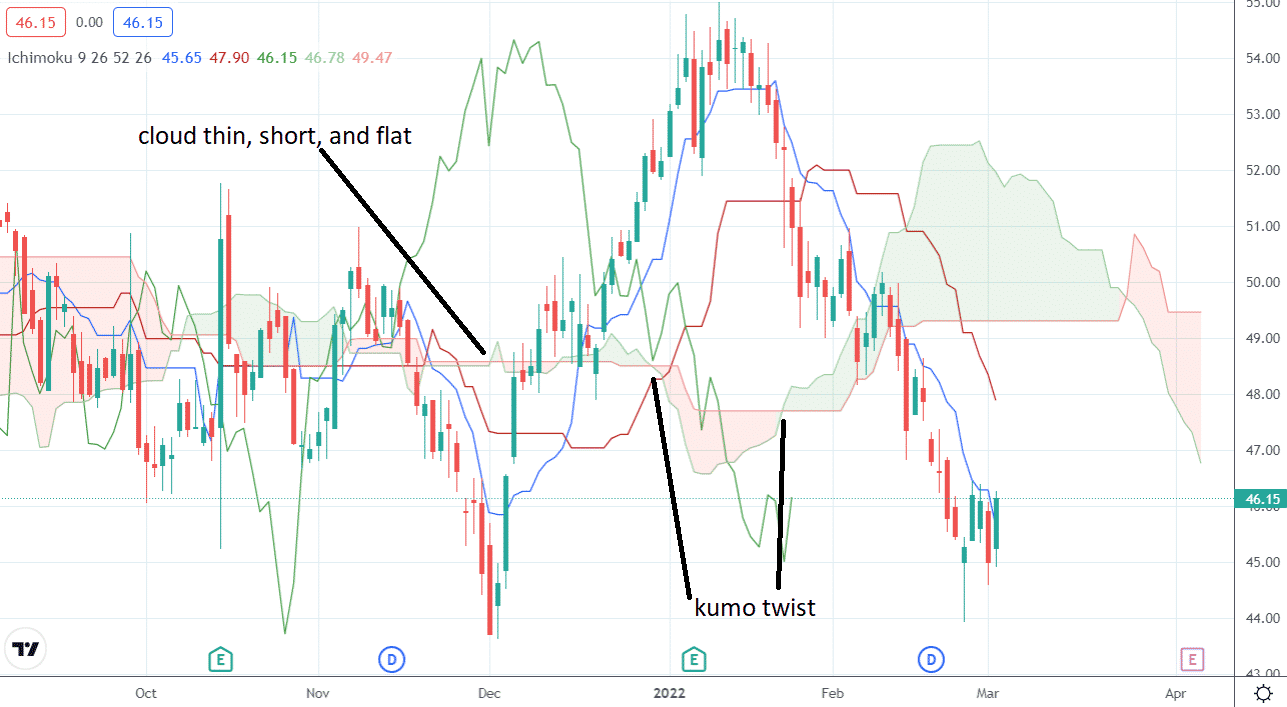
Note what a jumbled mess the lines make instead of the clean bullish trend showed previously.
Sanyaku Koten means Three Positive Signs
As you might expect with such a complex indicator, there are many different trading strategies.
So we look to YouTube to find an expert specializing in the niche subject of Ichimoku trading.
There is a Japanese Forex trader who goes by the name Forex Kei who had learned the Ichimoku Kinko Hyo system from the great-grandson of the original inventor.
He has read the original Japanese volumes written by Ichimoku and currently uses Ichimoku as his primary strategy in his full-time trading.
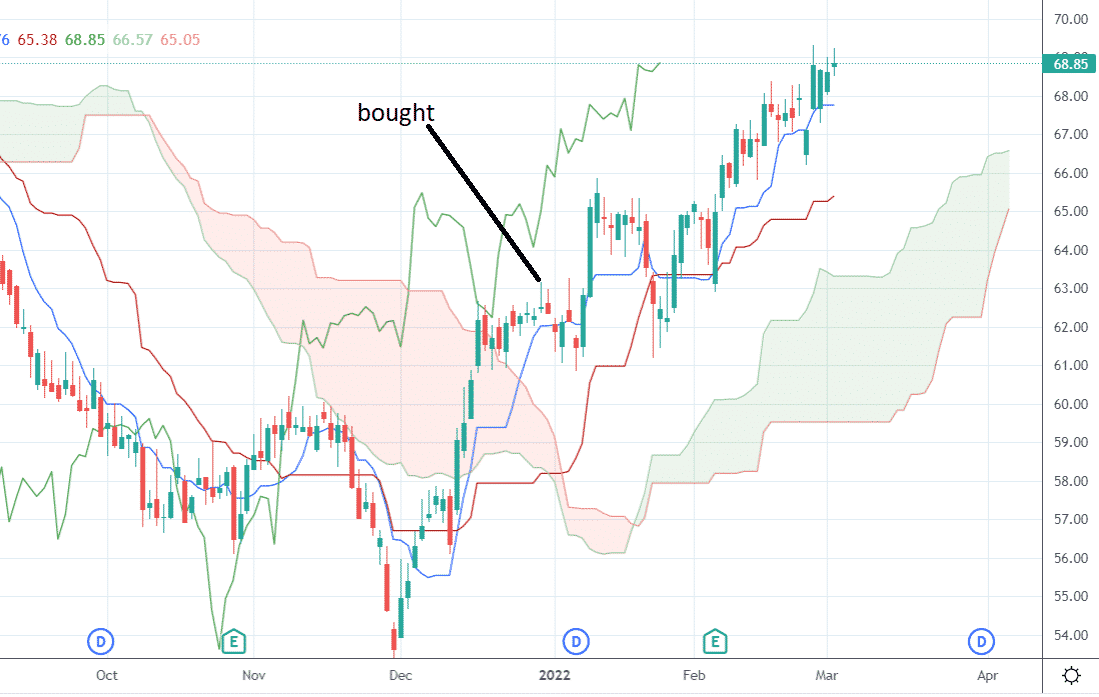
Kei describes a condition called “Sanyaku Koten” that signals the possible start of a bullish trend.
- Conversion line crosses base line from below.
- Lagging span goes above the price.
- Price breaks above the cloud.
Here is an example of a bull trend forming:
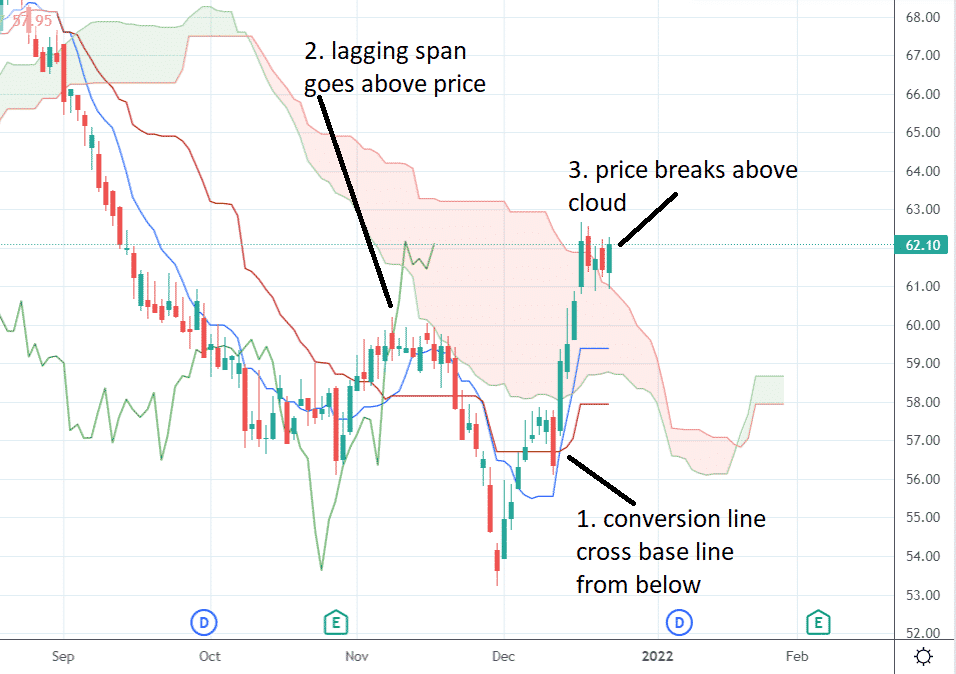
Some traders will also look at the color of the leading edge of the cloud.
In this case, the red cloud has just turned green at the far left edge of the chart.
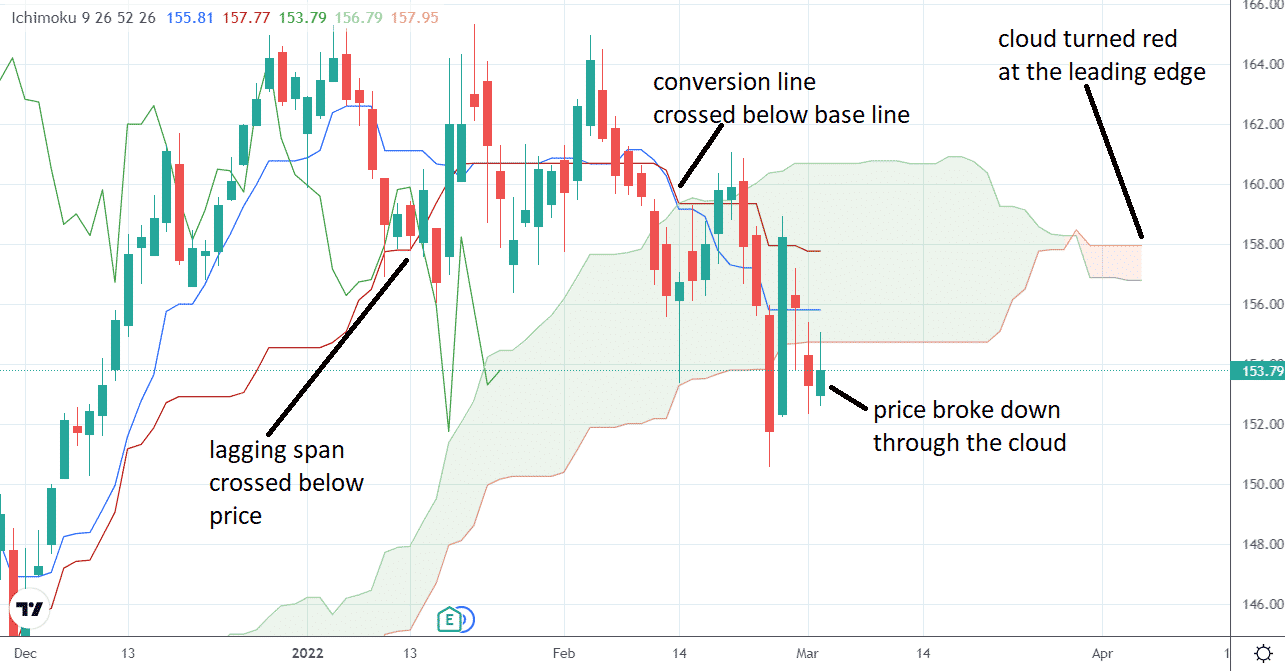
The start of the bearish trend will be the reverse, which I’ll illustrate with this picture:
Kei’s five-part videos go into the Ichimoku technique in greater depth.
For some traders, just having the “Sanyaku Koten” condition is not enough of an edge to take a trade.
Kei will also wait for the cloud angle and the base line angle to align with the trend before hopping onto the body of the trend.
He is not interested in capturing the very bottom or the very top of the trend.
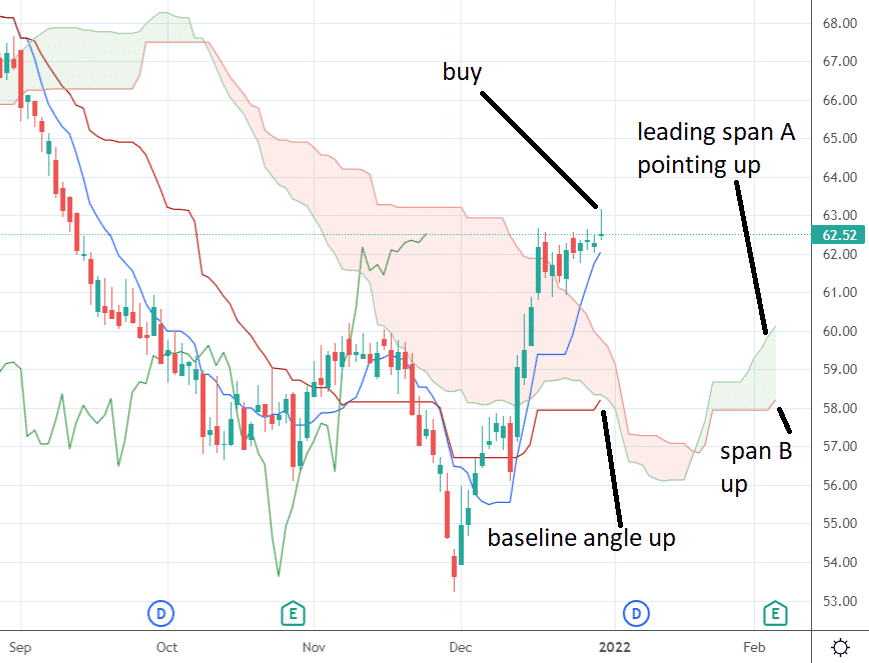
In this case, the trade would have worked out.
When To Exit
Different traders will use different signals for the exit.
The signals will typically be the reverse of the entry signals.
For example, one can exit when the conversion and base line re-crosses in the opposite direction, when the lagging span comes back to its candle, or when price goes back inside or back through the cloud, and so on.
Using TradingView’s bar replay feature, here was how I saw the following bull trend end:
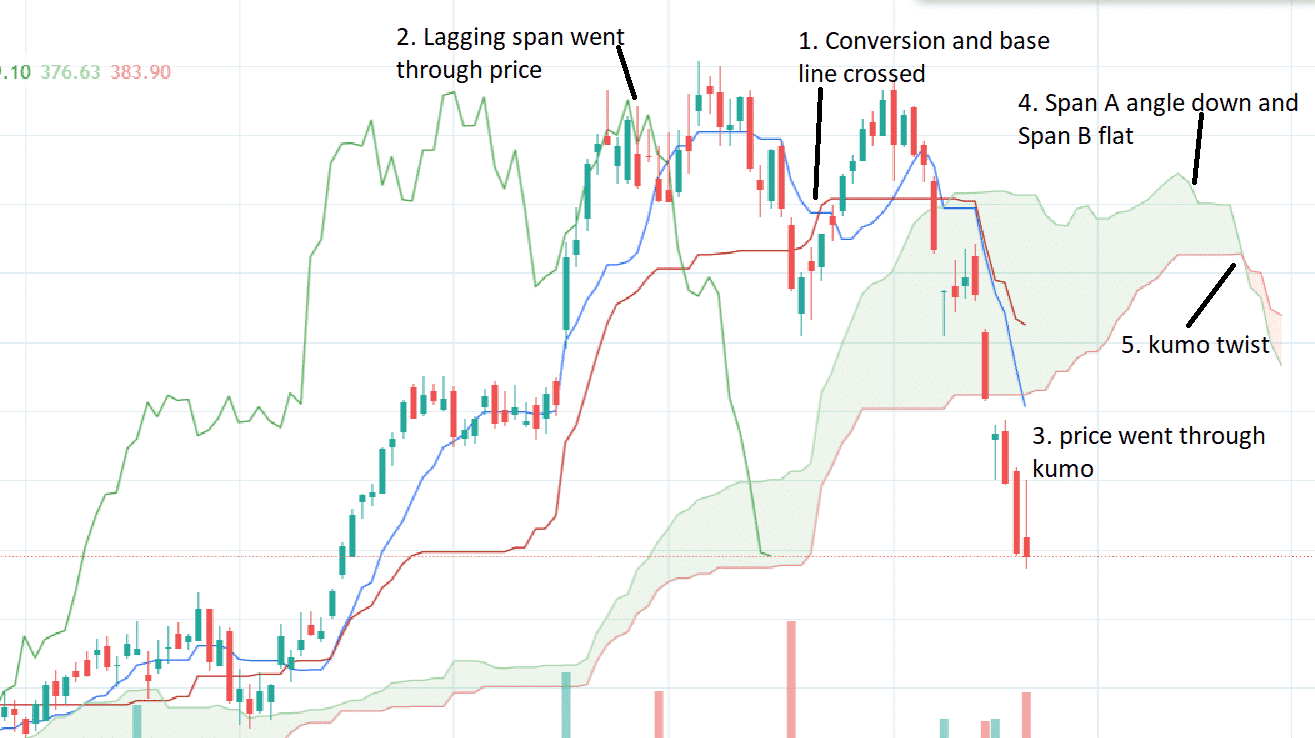
source: tradingview.com
Trading The Consolidation
The base line must be at an angle to have a trend.
A flat base line means the price is in consolidation, which is what the underlying is doing most of the time.
The trend-trader will not trade it during that time.
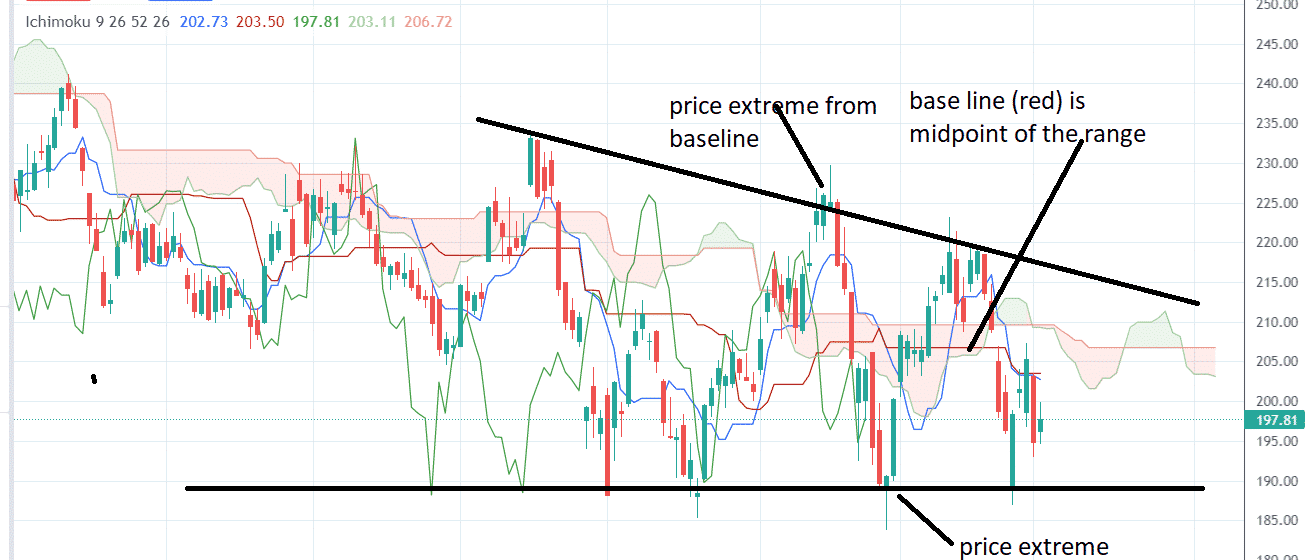
Here is one possible technique for the mean-reversion traders that want to trade during consolidation.
The base line (red line) marks the midpoint of the consolidation.
See how far away price deviates from this midpoint.
At price extremes, try to capture moves back to the midpoint or to the other edge of the consolidation as per the bounding trendlines.
The conversion line, base line, leading span A, and leading span B are all known as “mid-price lines”.
Unlike moving averages, these mid-price lines can be completely flat as in a shelf.
The base line marks the mid-price of the highest and lowest point on a 26-period range.
When it is flat, it means that the highest and lowest point of this range is not being broken.
Backtesting Is A Bit Difficult
Because the Ichimoku indicator consists of leading spans plotted 26-period ahead of the current candle.
And the lagging span plotted 26-periods behind the current candle.
It isn’t easy to read where they are when looking at historical charts.
This makes backtesting difficult, so I leave it up to others who have done it.
Trade Pro backtested it on 100 Forex trades using TradingView bar-replay feature, which hides the forward-looking candles.
This manual backtest simulates what he would do on live trades without knowing what candles would come next.
Although he used slightly different rules, he found that the Ichimoku indicator did quite well, ranking #3 out of all of the 54 different strategies he had tested so far.
As he says, “this strategy is no slouch.”
Conclusion
With five moving parts, there are a lot of nuance interpretations possible for this indicator.
However, if you want to start, turn all the lines except for the kumo.
Now even a six-year-old can tell you the trend at a glance when you ask them,
“Are we above the clouds or below the clouds?”
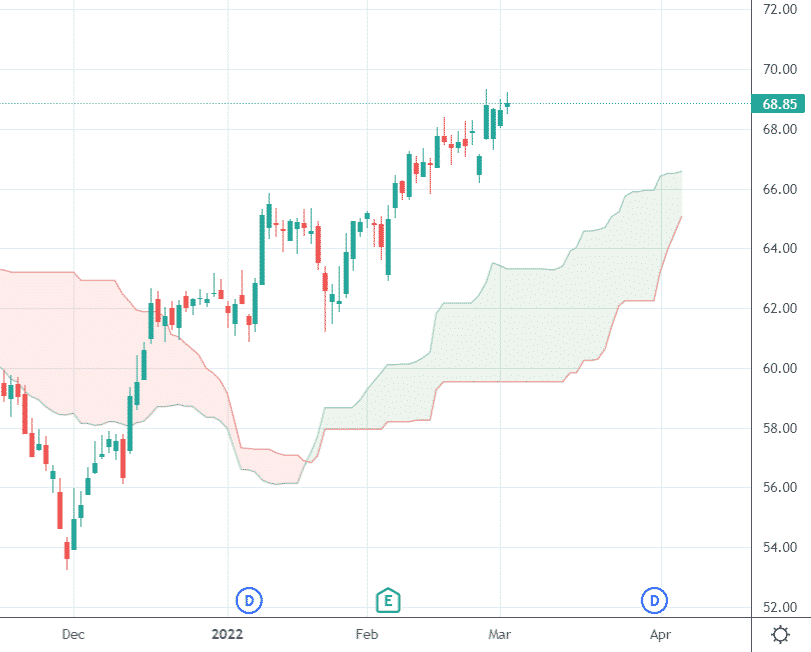
They might tell you, “We are above the clouds, and the skies are clear.”
Give it a try and see if this indicator resonates with you.
For some, it does. And for others, it doesn’t.
Trade safe!
Disclaimer: The information above is for educational purposes only and should not be treated as investment advice. The strategy presented would not be suitable for investors who are not familiar with exchange traded options. Any readers interested in this strategy should do their own research and seek advice from a licensed financial adviser.


