
Today, we’re looking at the long legged doji candlestick pattern.
We’ll look at some specific examples and discuss how to trade them.
Contents
- Introduction
- What Is A Long Legged Doji Candlestick?
- Understanding Long Legged Doji Candlesticks
- Long Legged Doji Candlestick Examples
- How To Trade Long Legged Doji Candlesticks
- Tips For Trading Long Legged Doji Candlesticks
- Bottom Line
Introduction
Periods of consolidations and indecision are a common occurrence in the capital markets.
These periods are characterized by a balance between buying and selling pressure, resulting in tight price ranges.
A long-legged doji candlestick pattern is one such pattern that affirms the market has entered a period of indecision with no viable direction in price action.
What Is A Long Legged Doji Candlestick?
A part of the Doji family, a long-legged doji candlestick is formed when the opening and closing prices are the almost the same.
Therefore, the resultant candlestick has long wicks on both sides, up and down, and a small body.
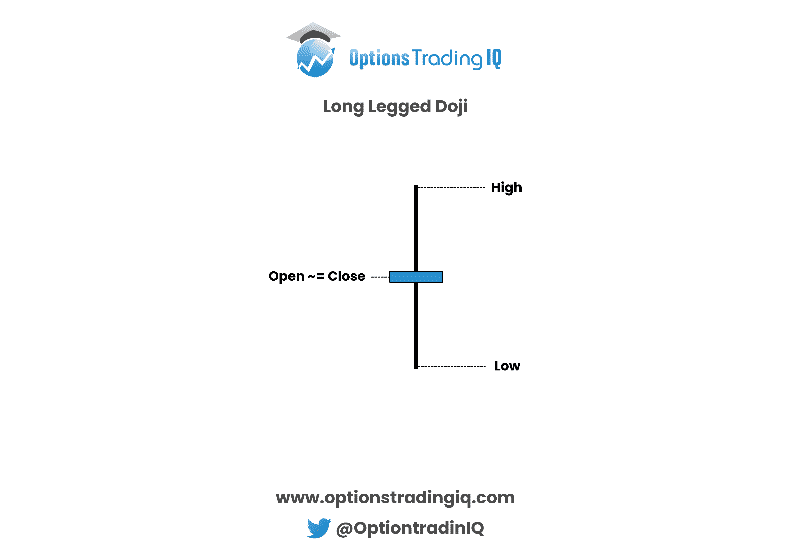
The long-legged doji occurs whenever there is a balance between buyers and sellers in the market.
The lack of imbalance results in the price of the underlying security losing a sense of direction.
Similarly, if the price was trending up or down, it may resort to a wide range for some time until an imbalance occurs.
Understanding Long Legged Doji Candlesticks
The long-legged candlestick pattern indicates that neither buyers or sellers are in control. With no outright winner between the two, price does not change much.
In this case, a candlestick will open and close almost at the same price.
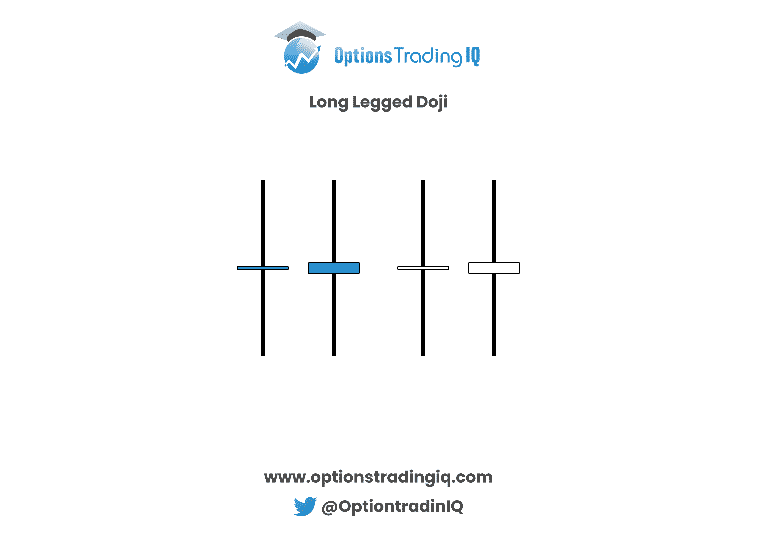
A long-legged candlestick pattern signals indecision about the future price action.
Given the balance between buyers and sellers, it becomes extremely difficult to predict the direction price will move.
At times, the candlestick pattern may signal the start of consolidation in the market whereby price moves in a tight range oscillating between support and resistance levels.
The long-legged dojis are most important when they occur after strong trends either on the upside or downside.
When they occur, they may signal equilibrium between buyers and sellers is nearing.
Likewise, a consolidation can come into play, after which price might continue moving toward the underlying trend.
Additionally, the candlestick pattern can result in trend reversals.
Long Legged Doji Candlestick Examples
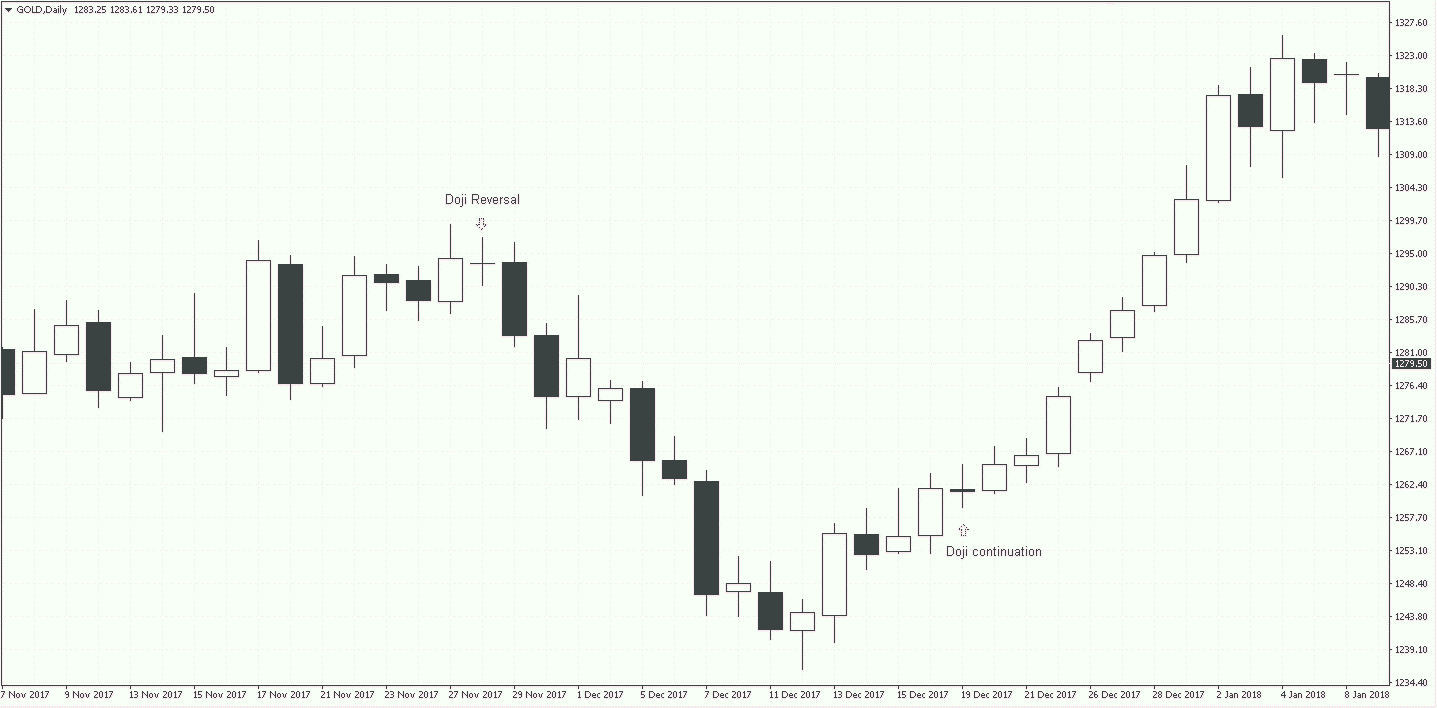
The chart below indicates the occurrence of a long-legged doji candlestick at different stages of price action.
For instance, the first long-legged doji candlestick is immediately followed by price reversal from an uptrend.
Source: Perfecttrendsystem.com
Price reversed and continued to edge lower because the candlestick immediately after the long-legged doji closed below it.
By closing below, the long-legged doji, the following candlestick signaled sellers have resumed control, therefore, pushing prices lower.
The second long-legged candlestick does not result in a reversal from the small uptrend. Instead, it results in trend continuation once buyers regain control.
The candlestick immediately after the long-legged doji candlestick closed higher.
The closing higher signaled that bulls in control after the consolidation thus likely to continue pushing prices higher.
From the two examples, it is important to build market context once the long-legged doji happens.
Treating the pattern in isolation can be disastrous for anyone looking to predict the direction price is likely to move afterward accurately.
How To Trade Long Legged Doji Candlesticks
High and low prices characterize long leg doji patterns.
However, given the rejection that comes into play, the price often closes near where it opened, resulting in long wicks on the candlesticks.
Given that the long-legged doji candlesticks occur in smaller time frames compared to larger time frames, it is important to be patient and wait for confirmation signals.
The best trading opportunities will come into play once the dust settles.
So, pay close watch to the candlesticks following the long leg doji.
The candlestick will shed light, signaling who is in control.
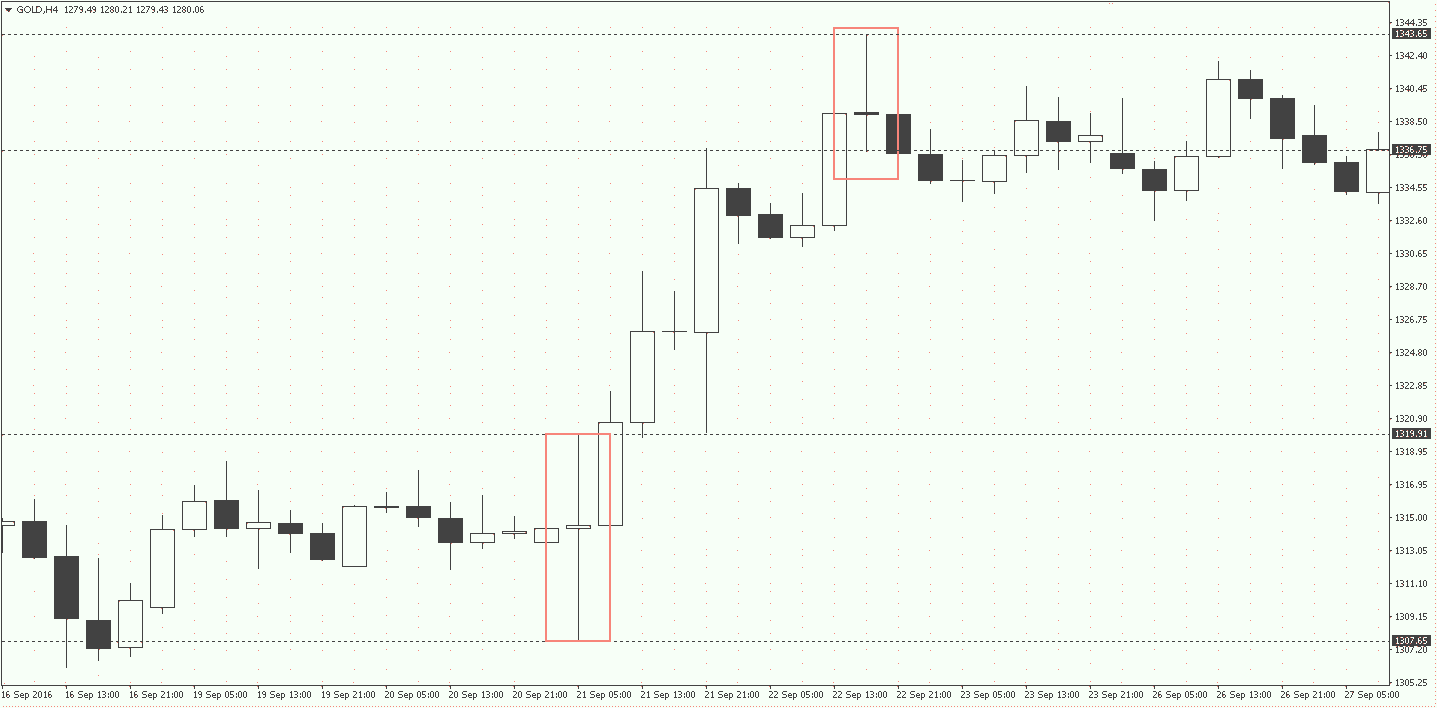
Source: Perfecttrendsystem.com
In the chart above, a long-legged candlestick occurred, at the bottom, showing a period of indecision between buyers and sellers.
However, the next candlestick provides the much-needed hint on the direction price is likely to move. The candlestick closed above the doji, signaling buyers are in control
At the top of the uptrend, a long-legged doji candlestick appears and ends up closing at the same point that the previous bullish candlestick closed.
The next candlestick after the long leg doji clearly indicates that the bullish trend has lost momentum and that a reversal is in play.
The candlestick’s closing much lower than the long-legged doji candlestick signals bears are in control and likely to push prices lower.
Tips For Trading Long Legged Doji Candlesticks
While trading, it is important to be extremely cautious on the emergence of long-legged doji candlestick near support and resistance levels.
The appearance of these candlesticks could signal price rejection. If they were to appear near resistance levels, a reversal could emerge, resulting in price dropping from an uptrend.
Similarly, a reversal could result in the price starting to trend upwards if it were to occur near a support level.
Bottom Line
A long-legged doji candlestick is an indecision candlestick that signals a period of uncertainty in the market. Its appearance in price action can signal different things.
For starters, it could signal a potential price reversal from the previous trend. It could also signal consolidation, after which price breaks out in the direction of the underlying trend.
Therefore, the long-legged doji candlestick should always be analyzed while considering the overall market structure and not in isolation.
Watch for confirmation candles as well.
Trade safe!
Disclaimer: The information above is for educational purposes only and should not be treated as investment advice. The strategy presented would not be suitable for investors who are not familiar with exchange traded options. Any readers interested in this strategy should do their own research and seek advice from a licensed financial adviser.


