








Heikin Ashi candles smooth out market noise and make the overall direction of a stock easier to see.
This can help traders stay with the trend and avoid being shaken out by short-term volatility and erratic candles.
However, there are a couple quirks in Heikin Ashi charts that can be confusing if you are not aware of them.
Contents
- The Next Day
- Heikin Ashi Chart
- How Is The Heikin Ashi Candle Formed
- Wicks On Heikin Ashi
- Using Heikin Ashi Signals For Options Entry Timing
- FAQ
- Conclusion
We start our example by looking at the daily chart of Qualcomm (QCOM) in a standard candlestick chart:
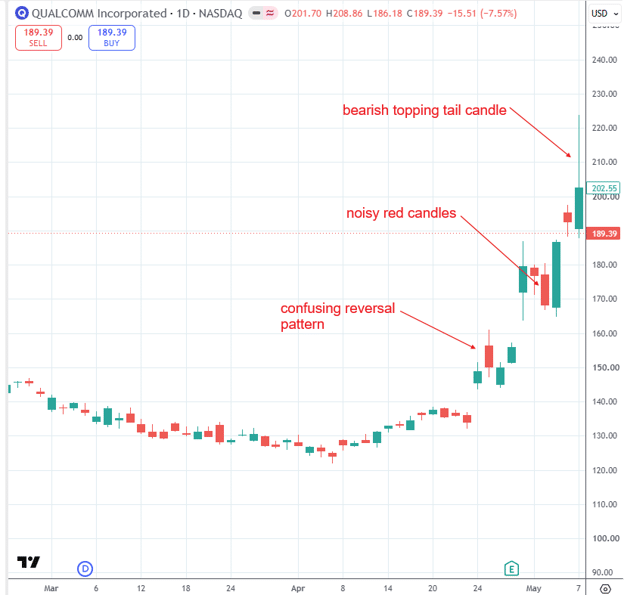
Let’s say a trader goes long on the breakout and gap up on April 24th, 2026.
The next day, a red candle forms closing lower than it opened (see chart above “confusing reversal pattern”).
This makes him nervous, especially when the following day, the candle gaps down and opens lower than the close of the previous day’s red candle.
Yes, the stock did make a small pull back.
But how was the trader to know that the pull back was a small one and that the major uptrend was still intact?
Okay, let’s say that some traders were not shaken out by the “confusing reversal pattern”.
They follow the trend up to see two “noisy red candles”.
Thinking the trend is ending, they exit the long trade and take profits too early.
The trend continues up without them.
Near the close of session on May 7th, a bearish topping tail candle was formed.
With standard candlesticks, this is bearish because it suggests that price got all the way up to $224 and the bears pushed the price back down to $202.
The buyers lost a lot of ground and the bears are strong.
It also suggests that the market rejected prices above $202, because it went up to take a look at price $224, didn’t like it, and came back down.
Some traders might even go short here thinking that a downward reversal is imminent.
But that would be a mistake if they relied solely on the candlestick pattern without other confirming indications such as RSI, overbought/oversold indicator, or lower timeframe analysis.
While the candle suggests the possibility of bearish price action does not mean that it will always result in a bearish action.
If the trader had looked at the one-hour chart, the price has not broken the trend yet:
This is the multi-timeframe confirmation rule: if price is going to reverse on the daily chart, it will typically show weakness on the hourly chart first.
Until the lower timeframe confirms the reversal, the daily chart signal alone is insufficient reason to exit or reverse.
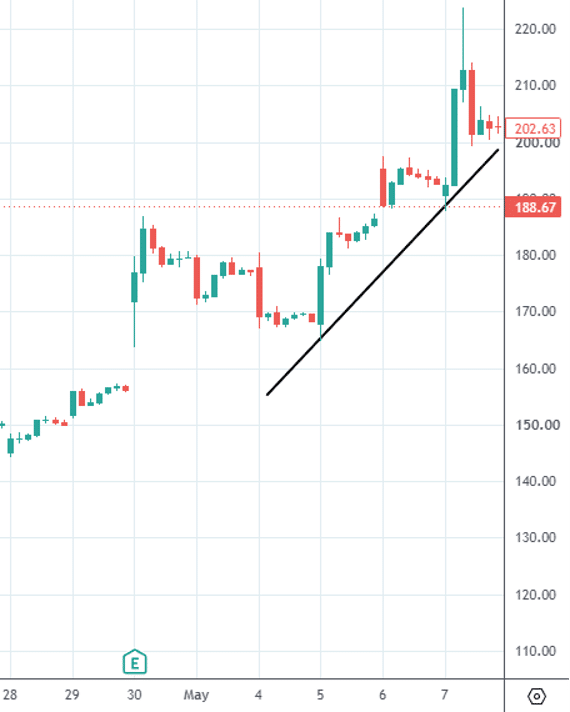
If price is going to go down on the daily chart, it would have started to go down on the hourly chart first.
And this has not happened.
At least wait until the opening of the next day before deciding.
The next day, May 8th, the price opened higher and went up.
Anyone who had shorted the stock the day before would have been wrong.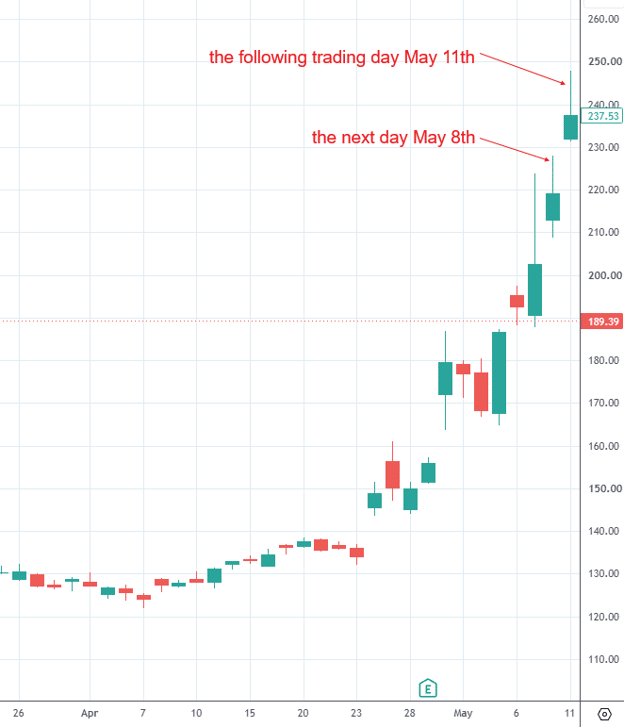
The following trading day May 11th saw another topping tail candle appear.
Could this be the top?
Learning from the lessons before, don’t short yet.
The trend still has not been broken on the one-hour chart:
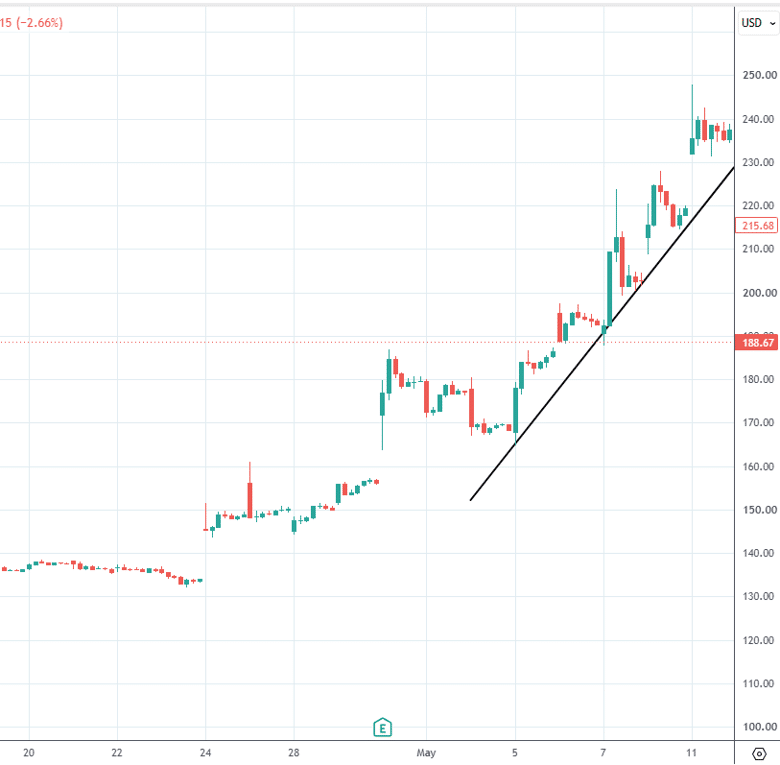
And at least wait for confirmation after the open the next day.
The Next Day
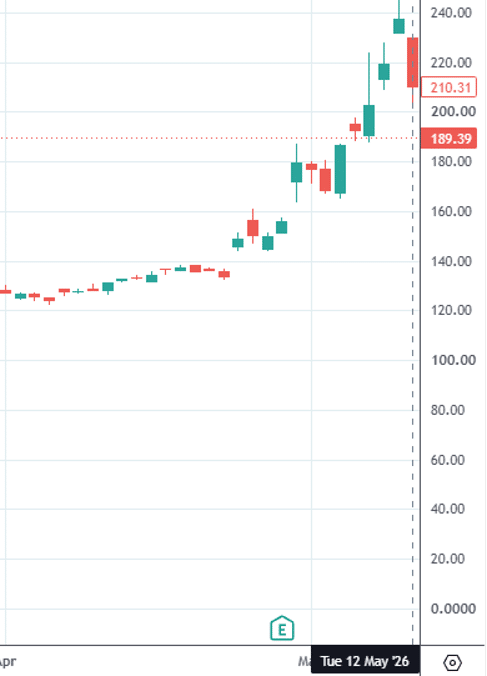
The next day, May 12th, the price did opened lower and continued lower all day:
And the lower one-hour timeframe did confirm a trend line break:
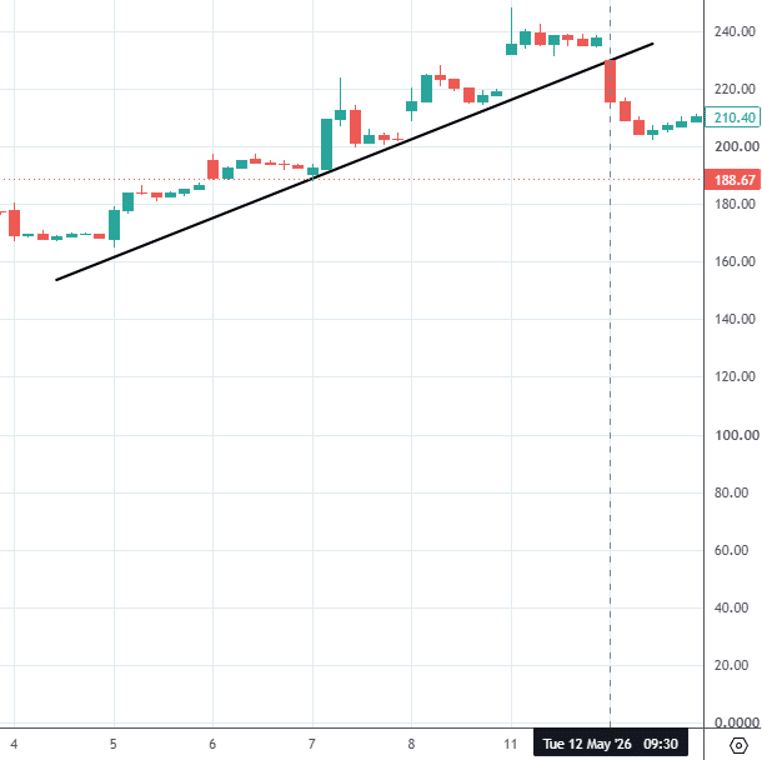
So May 12th would be a good time to exit the long position.
For those traders wanting to go counter-trend short on the reversal on May 12th would have made a bit of profit:
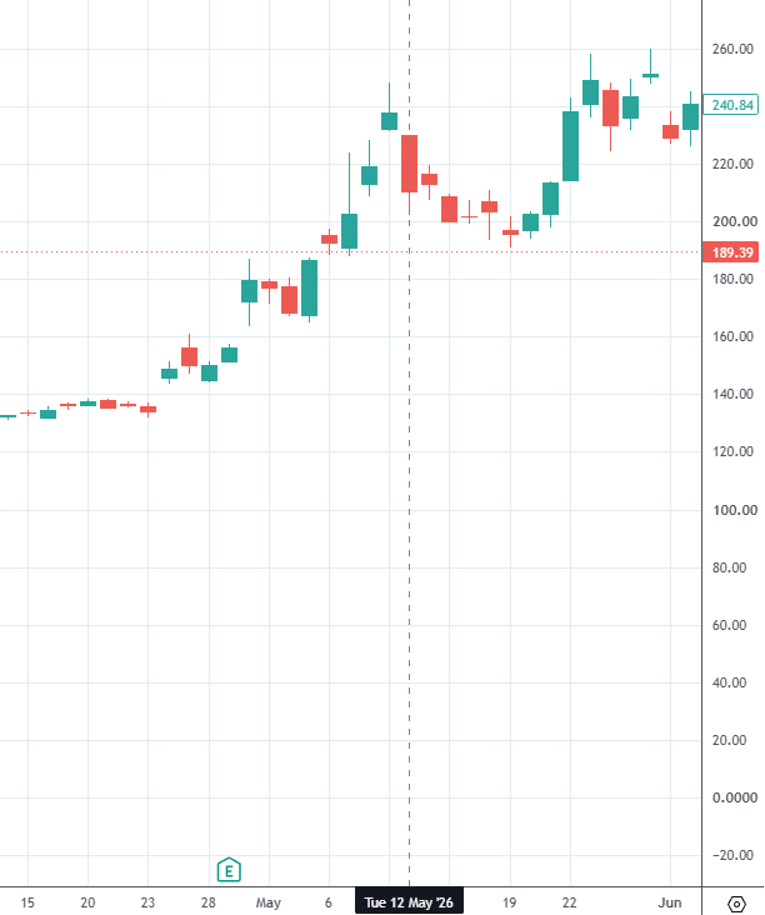
Before the price resumed the uptrend on May 20th.
Heikin Ashi Chart
Now we switch to the Heikin Ashi chart visualization in TradingView:
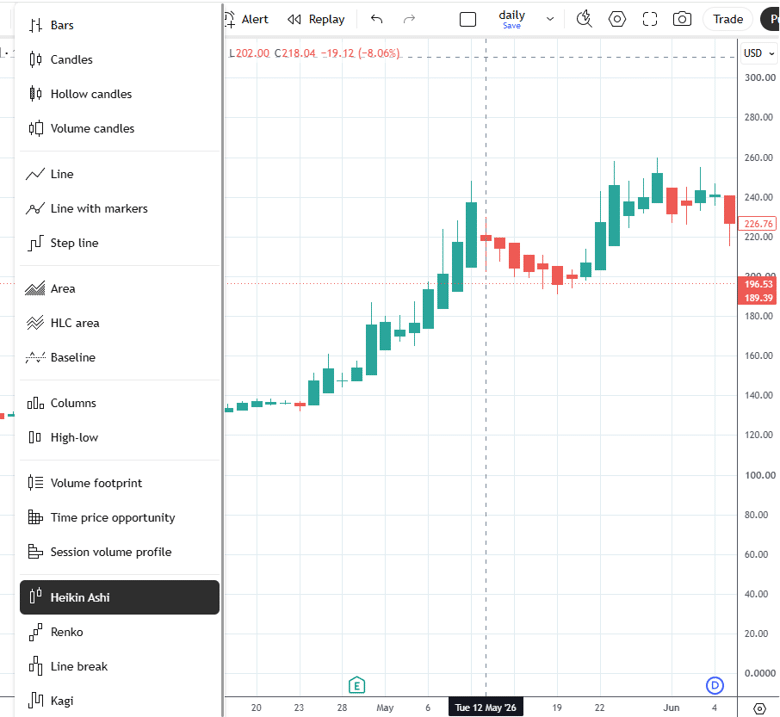
See that all of the candles from April 24th to May 11th are all green.
That is bullish price action.
No need to exit the trend.
And definitely not to short it.
It eliminated the “confusing reversal pattern” and the “noisy red candles”.
It didn’t turn red until May 12th, which we had seen was the correct time to exit the long trade.
After the pullback, it then later showed a green candle on May 21st indicating that the pull back was over and that the long term uptrend is resuming.
This signal may be a tad late, because the effect of smoothing out the noise also delays its signals.
How Is The Heikin Ashi Candle Formed
The Heikin Ashi chart should be viewed as a technical indicator or a visualization, rather than a true price chart.
Like other indicators, Heikin Ashi candles are derived from actual price data, but they do not display the market’s true open, high, low, and close prices.
Instead, they use a modified calculation for the current candle that uses information from the previous candle.
Heikin Ashi Close = (Open + High + Low + Close) / 4
Heikin Ashi Open = (Previous Heikin Ashi Open + Previous Heikin Ashi Close) / 2
Heikin Ashi High = The highest value of the current High, the current Heikin Ashi Open, and the current Heikin Ashi Close.
Heikin Ashi Low = The lowest value of the current Low, the current Heikin Ashi Open, and the current Heikin Ashi Close.
Notice that only the Heikin Ashi Close uses the current period’s actual prices directly.
The Heikin Ashi Open depends on the previous Heikin Ashi candle, creating a smoothing effect from one candle to the next.
The High and Low are then adjusted to include both the actual price extremes and the calculated Heikin Ashi values.
Because each candle is partially based on the previous one, Heikin Ashi charts tend to produce longer runs of candles in the same color with fewer abrupt reversals.
Wicks On Heikin Ashi
Therefore, to see true price action, a trader will want to switch back and forth to standard candlestick, while using the Heikin Ashi as a supplement.
When switching back and forth, it is important to remember that the candle wicks in Heikin Ashi have the opposite interpretation of standard candlesticks.
On a standard candlestick chart, we saw that a long upper wick suggests rejection of higher prices and can indicate a possible downward reversal.
In contrast, on a Heikin Ashi chart, the wick indicates the direction in which the stock wants to go.
The longer the wick, the greater the pressure in that direction.
Here we show a bullish Heikin Ashi candle with long upper wick.
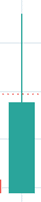
There is no lower wick in this Heikin Ashi candle, so there is no pressure for it to go lower.
Failing to recognize this difference can lead to misinterpreting the strength of a trend when switching between the two chart types.
Similar to the standard chart, the color of the candles means as what one would expect.
Large green candles indicate strong bullish momentum, while large red candles indicate strong bearish momentum.
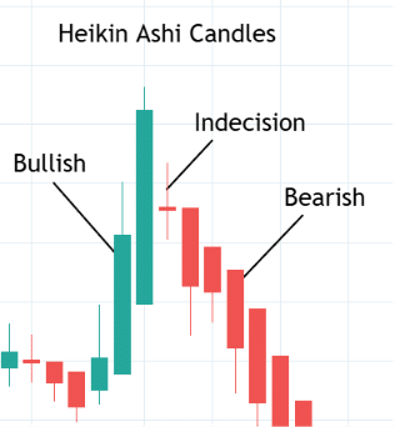
Small-bodied candles with both upper and lower wicks resembling doji candles represent market indecision, where neither buyers nor sellers have gained control.
This candle type often sits in the transition from one trend direction to another.
After becoming familiar with the candles, we can also read the strength of the trend.
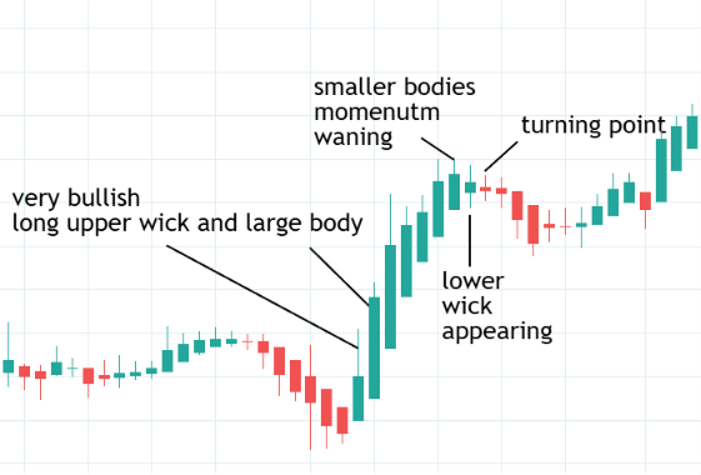
Here we see large bullish green candles with long upper wicks and no lower wick.
As the bodies become smaller and tapering to a doji candle, the bullish momentum is decreasing.
Even though the candle remains green, lower wicks may appear signifying downward pressure.
Using Heikin Ashi Signals For Options Entry Timing
For options traders, one of the most common frustrations is entering a directional trade — a bull put spread, a long call, or a debit spread — and getting stopped out by short-term noise before the thesis plays out.
Heikin Ashi charts can help with this in two specific ways.
First, they provide a cleaner entry signal.
A transition from red to green Heikin Ashi candles, confirmed on the lower timeframe, is a stronger signal to initiate a bullish options trade than a single green reversal candle on a standard chart.
In the QCOM example, the HA chart showed an unambiguous green run from April 24th to May 11th — a clean window for holding a bull put spread or long call position without the noise that shook out standard chart traders.
Second, they provide a cleaner exit signal.
The HA chart turned red on May 12th — the same day the multi-timeframe analysis confirmed the trend break.
For an options trader holding a bull put spread, that’s an ideal day to close the position and bank the profit rather than holding through the developing downtrend.
Heikin Ashi won’t tell you which strike to sell or which expiration to use — that’s still determined by implied volatility, delta selection, and your income targets.
But as a directional filter, it can meaningfully improve the quality of your entry and exit decisions.
FAQ
Are Heikin Ashi Charts Available on TradingView?
Yes — Heikin Ashi is a built-in chart type on TradingView, available on all plan levels including the free plan.
To switch, click the chart type dropdown in the top left of the chart panel (where it shows “Candles” by default) and select “Heikin Ashi.”
You can also find community scripts for “Smoothed Heikin Ashi” overlays that display HA candles on top of your standard candlestick chart simultaneously.
Can I Use Heikin Ashi for Day Trading?
Heikin Ashi is generally more useful for swing traders than day traders.
Because each candle incorporates data from the previous candle, HA signals are slightly delayed relative to standard candlesticks — which is acceptable when holding positions for days or weeks, but can be a disadvantage for intraday traders where timing precision matters more.
Day traders who use HA typically use it on a higher timeframe for trend context while making precise entries on standard candlestick charts on a lower timeframe.
Do Heikin Ashi Candles Show the Real Open, High, Low, and Close?
No — and this is the most important caveat to understand.
Heikin Ashi prices are calculated values derived from standard OHLC data, not the actual market prices.
The HA open and close do not correspond to the stock’s actual opening and closing prices.
This means you cannot use HA charts for precise support and resistance levels, for reading gap ups/gap downs accurately, or for placing stops at exact price points.
Always switch back to standard candlesticks for these purposes.
What Does a Heikin Ashi Doji Candle Mean?
A small-bodied Heikin Ashi candle with both upper and lower wicks — similar in appearance to a standard doji — indicates that bullish and bearish momentum are in balance and a trend change may be approaching.
Unlike standard dojis which can appear anywhere in a trend, an HA doji-like candle after a run of strong directional candles is a more reliable warning signal that the trend is losing strength.
It rarely marks the exact top or bottom, but it signals that the momentum trade is weakening.
How Is a Heikin Ashi Wick Different From a Standard Candlestick Wick?
On a standard candlestick, a long upper wick indicates price rejection — buyers pushed price up but sellers overwhelmed them and drove it back down, a potentially bearish signal.
On a Heikin Ashi chart, a long upper wick indicates buying pressure — the wick shows the direction the stock wants to go, not rejection.
Confusing these two interpretations when switching between chart types is one of the most common mistakes traders make with Heikin Ashi.
Want to Combine Technical Analysis With Systematic Options Income Trading?
Technical tools like Heikin Ashi charts are most powerful when used alongside a structured options income framework — helping you time entries and exits on strategies like bull put spreads, iron condors, and covered calls.
Options Income Mastery covers both the technical and structural elements of systematic income trading.
Conclusion
Heikiin Ashi charts cannot completely replace standard candlestick charts because they do not represent true price action.
Instead of switching back and forth between the two, you may be able to find platforms or community scripts in TradingView that display Heikin Ashi charts as an overlay on top of standard candlesticks:
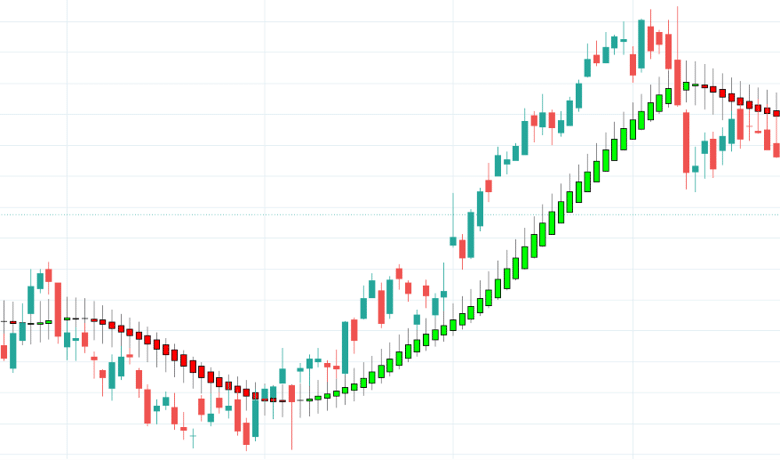
These overlays are often named “Smoothed Heikin Ashi”.
Heikin Ashi charts are an excellent complement to standard candlestick charts.
By smoothing price fluctuations, they reduce many of the false reversal signals that often occur in traditional candlestick charts.
This helps traders stay with an established trend longer instead of being shaken out by normal market noise.
The smoother appearance of the candles also makes the overall trend easier to identify at a glance.
We hope you enjoyed this article on how Heikin Ashi candles keep you on trend.
If you have any questions, please send an email or leave a comment below.
Trade safe!
Disclaimer: The information above is for educational purposes only and should not be treated as investment advice. The strategy presented would not be suitable for investors who are not familiar with exchange traded options. Any readers interested in this strategy should do their own research and seek advice from a licensed financial adviser.



Love it ! I have some experience in option trading, but suck in technical analysis / price move analysis. This one is excellent.
Glad the article helped you. Keep up the good work