







The expected move is one of the most useful numbers in options trading, and one of the most underused.
Most traders learn what the one-standard-deviation range is that the market is pricing in over a given period, and then file it away as an interesting fact.
What they don’t do is use it systematically to screen underlyings, size condor wings, identify overpriced earnings moves, and build a repeatable edge into their trade-selection process.
This article covers exactly that.
If you already know how to calculate the expected move, our guide to calculating the expected move covers the mechanics.
This is the practical follow-on.
Contents
- The Edge Hidden Inside The Expected Move
- Using The Expected Move To Place Iron Condor Strikes
- Screening For Consistently Over-Priced Expected Moves
- The Expected Move Ratio: Your Pre-Trade Checklist
- Using The Expected Move For Cash-Secured Puts And The Wheel
- Expected Move Around Earnings Vs Non-Earnings Periods
- FAQ
- Summary
The Edge Hidden Inside The Expected Move
The expected move isn’t a neutral forecast.
It’s the market’s priced-in estimate of how far a stock will move, and it’s systematically biased high.
Research consistently shows that stocks move less than the expected move more often than not.
Over broad samples of earnings events and regular expirations, the actual realised move is smaller than the implied expected move roughly 65-70% of the time.
This gap, between what the market prices in and what actually happens, is the volatility risk premium at work, and it’s the structural foundation of every income strategy.
For iron condor traders, this is the core insight: if you place your short strikes outside the expected move, you’re exploiting the fact that the market is consistently overestimating how far the stock will travel.
You’re not just hoping the stock stays in a range; you’re systematically betting against an overpriced range.
Understanding this changes how you use the expected move. It stops being a curiosity and becomes an edge.
Using The Expected Move To Place The Iron Condor Strikes
The most direct application of the expected move is as a guide for where to place your iron condor’s short strikes.
The standard approach:
Place short strikes at or beyond the one-standard-deviation expected move.
If SPY is at $700 and the expected move to the next expiration is $20, your short call sits above $720, and your short put sits below $680.
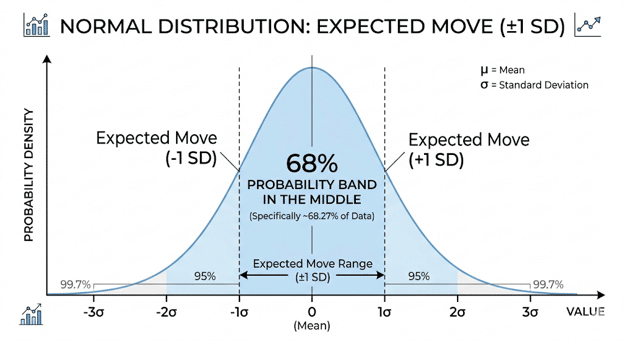
You’re selling a condor in which the market has roughly a 68% chance of staying between the short strikes, a built-in probability of profit before any other filter is applied.
Reading the expected move from the option chain:
The fastest method is adding the ATM call and put prices for your target expiration.
A $700 SPY with a $20 ATM straddle is implying a $20 expected move.
Short strikes at $680/$720 are right at one standard deviation.
Strikes farther out are beyond one SD; those closer in are within it.
Comparing strike placement to the expected move:
A quick sanity check before entering any condor is comparing the distance between the current price and your short strikes against the expected move:
– Short strikes inside the expected move = you’re taking more risk for more premium (higher probability of being tested)
– Short strikes at the expected move = standard 1 SD placement, roughly 68% probability of staying inside
– Short strikes beyond the expected move = higher probability of profit, less premium collected
Neither is inherently right.
But knowing where your strikes sit relative to the expected move tells you what probability trade you’re actually making, which is more informative than delta alone.
Screening For Consistently Over-Priced Expected Moves
Here’s where the expected move becomes a systematic screening tool rather than just a setup guide.
Not all stocks are equally good candidates for iron condors.
Some stocks consistently move less than their expected move, suggesting over-priced implied volatility and making them strong condor candidates.
Others consistently move more, signaling an underpriced IV relative to actual risk, making them potentially dangerous condor candidates.
How to check:
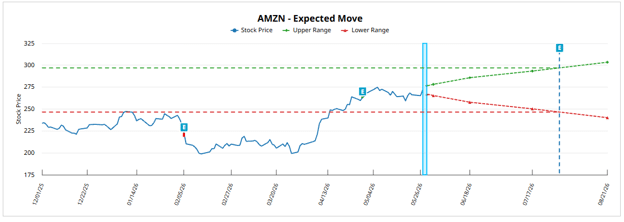
Before entering a condor on any underlying, look at the last 6-8 earnings cycles, or regular expirations if non-earnings.
For each cycle, note:
- What was the expected move at entry?
- What was the actual move by expiration?
- Did actual exceed expected?
A stock that has moved less than expected in 5 out of 6 recent cycles is signalling that its options are consistently over-priced, making it ideal for selling premium.
A stock that regularly exceeds its expected move is signalling the opposite.
Market Chameleon and similar tools efficiently track this historical data.
This expected move analysis is particularly valuable for pre-earnings condors and iron condors around binary events.
If a stock has beaten its implied expected move in four of the last five earnings cycles, a short condor around that earnings event is taking on substantially more risk than the probability math suggests.
Our iron condor success rate guide shows how proper selection of the underlying assets, based on historical behavior, can meaningfully lift real-world win rates beyond the theoretical baseline.
The Expected Move Ratio: Your Pre-Trade Checklist
The expected move ratio formalises this screening into a single number:
Expected Move Ratio = Actual Move (most recent) ÷ Expected Move (at entry)
A ratio below 1.0 means the stock moved less than expected; the condor would have been profitable assuming strikes outside the expected move.
Above 1.0 means it moved more than expected.
Track this ratio across several recent cycles before entering a condor on any underlying.
A rolling average below 0.80 across multiple periods is a strong signal that the market consistently overprices this stock’s options, giving you a structural edge every time you sell premium on it.
The ratio also helps you calibrate how far outside the expected move to place your strikes.
For a stock with a consistent ratio of 0.65, meaning it only moves 65% of the implied expected move on average, you can place strikes closer to the expected move boundary without taking on as much effective risk as the probability calculation would suggest.
For a stock with a ratio of 0.95, more conservatism is warranted.
It’s also worth cross-referencing the expected move ratio with IV Rank.
A stock showing a low expected move ratio in a high IV Rank environment is doubly attractive for premium sellers: the options are expensive relative to historical volatility, and the underlying has a track record of moving less than implied.
Combining both filters before entering a condor sharpens your edge considerably.
Using The Expected Move For Cash-Secured Puts And The Wheel
The expected move isn’t just for condors.
It’s an equally useful tool for sizing cash-secured put entries.
When selling a CSP, the expected move tells you how much the market is pricing into the near-term downside.
If the expected move to your expiration is $8 on a $100 stock, a put strike at $92 is exactly one standard deviation away, implying about a 16% probability of expiring in the money under a normal distribution.
The practical use:
Compare your intended put strike to the expected move before entering.
Selling a put with a strike inside the expected move, say $94 on that same stock, means you’re taking on more directional risk than the simple “this is just a 25-delta put” framing suggests.
You’re selling a put inside the range that the market thinks the stock could plausibly reach.
For the Wheel strategy specifically, the expected move helps answer whether this is a good time to run the strategy at all.
If a stock has a very wide expected move, implying high market volatility, that’s an elevated premium but also an elevated risk of being assigned far below your cost basis.
Matching Wheel entry points to periods of reasonable but not extreme expected moves tends to produce better risk-adjusted outcomes.
A practical rule of thumb: if the expected move is wider than 8-10% of the stock price, consider whether the underlying is appropriate for the Wheel at all.
Extreme expected moves often signal upcoming binary events or deteriorating fundamentals.
In these cases, waiting for the expected move to compress before initiating a new cash-secured put cycle is usually the more disciplined choice.
Expected Move Around Earnings Vs Non-Earnings Periods
The expected move varies significantly depending on whether an earnings announcement falls within your expiration window.
Non-earnings expirations:
The expected move reflects normal background volatility.
Condors placed outside the expected move in non-earnings periods tend to have more predictable behaviour, as the stock is moving on general market conditions rather than a binary information event.
Earnings expirations:
The expected move spikes dramatically in the expiration closest to earnings.
A stock with a $10 expected move in a normal month might have a $25 expected move in the earnings expiration.
This spike reflects the market’s attempt to price in the binary outcome of the earnings release.
This creates two different trade types:
Using the elevated expected move to set the condor width: If you’re deliberately trading through earnings, the inflated expected move tells you how far out to place your strikes.
You need to go wider than you would in a non-earnings expiration to achieve the same effective probability.
Avoiding earnings entirely with condors: The more common approach for income traders is to avoid entering condors in expirations that capture an earnings event, precisely because the expected move jumps so dramatically.
Our iron condor guide covers when to specifically avoid earnings-window condors and how to adjust if the market moves against you.
For pre-earnings straddles and other volatility strategies that deliberately exploit the earnings expected move, the key question is whether the actual move historically exceeds or falls short of the implied expected move, the same expected move ratio analysis covered above, applied specifically to earnings cycles.
One related concept worth understanding is IV crush.
After an earnings release, implied volatility typically collapses sharply regardless of the direction of the stock’s move.
Traders who sell short straddles or strangles into earnings are deliberately trying to capture this collapse.
The expected move is the anchor for sizing those trades: if the market implies a $20 move and the stock historically moves $14 on earnings, the IV crush trade has a meaningful statistical edge.
FAQ
Q: What’s a good expected move ratio to look for before selling a condor?
Look for underlyings where the actual move has been below 80% of the expected move over at least 4-6 recent cycles.
This suggests the options are consistently over-priced relative to realised movement, a structural edge for premium sellers.
Ratios consistently above 0.90-1.0 suggest the stock moves in line with or beyond its implied range, making it a much riskier condor candidate.
Q: How do I quickly get the expected move from an options chain?
Add the at-the-money call price and the at-the-money put price for your target expiration.
That sum is the expected move in dollars.
Divide by the stock price for a percentage.
Most platforms also display expected moves directly on the options chain or in their risk analysis tools.
Q: Should my iron condor short strikes always be placed outside the expected move?
It’s a good baseline, but not a hard rule.
Placing strikes at or beyond the expected move gives you roughly 68% probability of both short strikes expiring worthless, a sound starting point.
In very high IV environments with a strong expected move ratio history, you can sometimes justify slightly tighter strikes for more premium.
In uncertain conditions or with unfamiliar underlyings, staying outside is the more conservative choice.
Q: Can I use the expected move for weekly options?
Yes, though the expected move for weekly expirations is smaller than that for monthly.
The same principles apply.
Compare your strike placement to the weekly expected move and check historical weekly moves against the implied expected move on your target underlying.
Weekly options around economic data releases, such as Fed meetings and CPI, behave similarly to earnings options: the expected move spikes, then collapses after the event.
Q: Is the expected move the same as the breakeven on a short straddle?
Yes, essentially.
Because the expected move is calculated from the ATM straddle price, the expected move and the short straddle breakevens are the same number.
Selling a straddle and having the stock remain within the expected move by expiration yields a profit.
This is why the expected move is such a natural reference point for condor traders; it’s directly built from the options pricing in your own trade.
Summary
The expected move transforms from a definition into a practical trading tool when you use it systematically:
To place condor short strikes relative to the one-standard-deviation boundary; to screen underlyings based on how consistently their actual moves fall short of the implied expected move; to calibrate CSP and Wheel entry points relative to near-term downside implied by the market; and to distinguish between earnings and non-earnings expirations when sizing positions.
The edge in all of these applications comes from the same source.
Options markets systematically overprice expected moves, and income traders who understand and exploit that tendency have a structural advantage that compounds across hundreds of trades.
For a step-by-step visual walkthrough on high-probability trade setups, watch Mastering Credit Spreads: High Probability Trades with Defined Risk on the Options Trading IQ YouTube channel.
Related articles:
- Calendar spreads: the complete guide
- Bull put spread strategy
- Options position sizing guide
- What does VIX over 45 really mean?
- Options expiration risk: the $700,000 horror story
- Key metrics to determine market conditions
We hope you enjoyed this article on using the expected move to find better options trades.
If you have any questions, send an email or leave a comment below.
Trade safe!
Disclaimer: The information above is for educational purposes only and should not be treated as investment advice. The strategy presented would not be suitable for investors who are not familiar with exchange traded options. Any readers interested in this strategy should do their own research and seek advice from a licensed financial adviser.