


What if I told you that a properly managed iron condor has an 86% success rate – not the 70% most people assume?
After backtesting 50 trades across multiple tickers and market conditions, I discovered that strategic adjustments can boost your win rate by 16 percentage points.
But here’s the catch: you need to know exactly when and how to adjust.
Let me show you the math behind iron condor success rates, then reveal the adjustment techniques that turned my theoretical 70% into a real-world 86%.
Contents
- Understanding Theoretical Success Rates
- The Success Rate of Strangles
- Iron Condor Success Rate Basics
- How Spread Width Affects Success Rate
- Changing the Delta of Short Strikes
- Risk/Reward Relationship
- Real-World Backtest Results
- Average Win and Average Loss Analysis
- Key Adjustments That Improved Results
- Frequently Asked Questions
Understanding Theoretical Success Rates
Before we dive into the backtest results, you need to understand what drives the probability of success for iron condors.
The theoretical success rate assumes you hold to expiration without making any adjustments – which, as you’ll see, is not what we actually do in practice.
The key factors that determine your iron condor success rate are:
- Delta of short strikes – Lower delta = higher success rate
- Width of spreads – Wider spreads = higher success rate
- Days to expiration – More time = more opportunities for adjustment
- Underlying volatility – Higher IV = more premium but more risk
Let’s break down each of these factors mathematically, starting with the simplest structure: the strangle.
The Success Rate of Strangles
Why are we looking at strangles when we’re talking about iron condors?
Because understanding strangles helps us understand the mechanics of success rates before we add the protective legs.
Suppose we sell a strangle on SPX with the short strikes at 15-delta:
Date: Sept 3, 2021 Price: SPX at $4535
- Sell one Oct 15 SPX call with strike $4685 at $10.10
- Sell one Oct 15 SPX put with strike $4240 at $25.20
ThinkOrSwim calculates the probability of profit to be 68%.
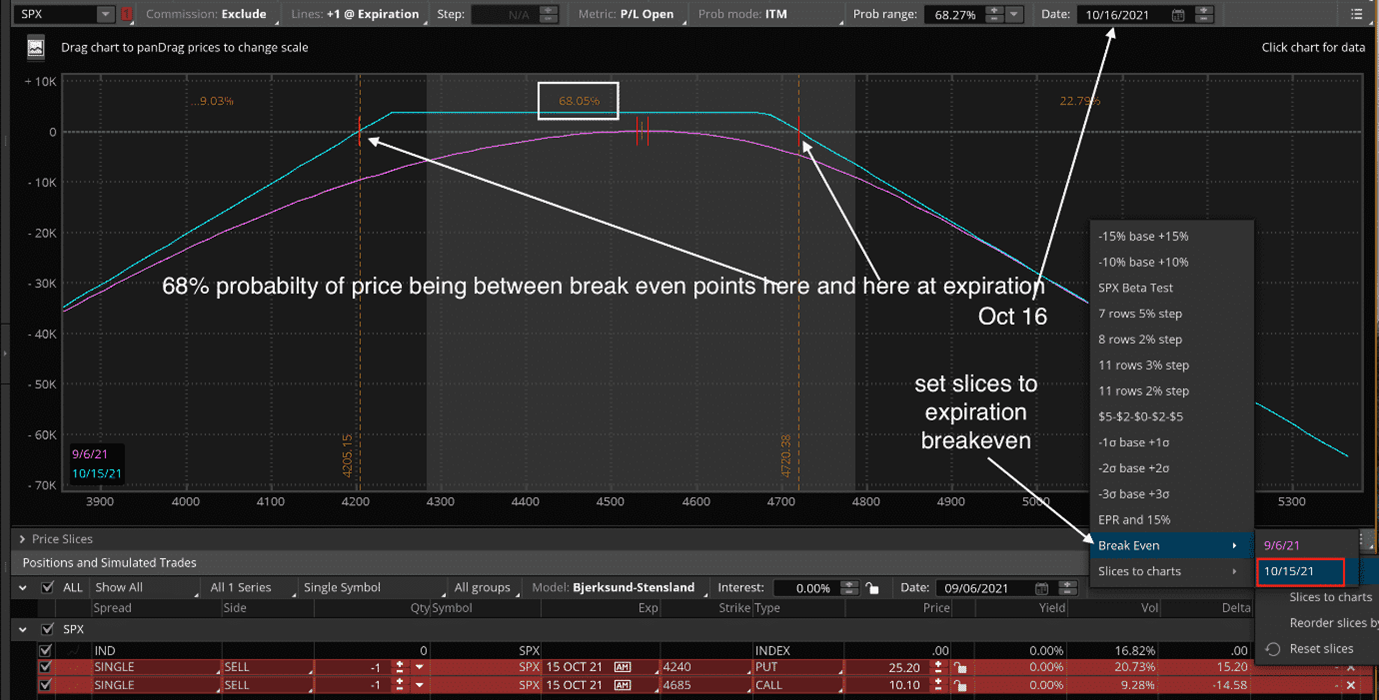
That means there’s a 68% chance this trade makes at least one penny when held to expiration.
Although the software arrives at this number using sophisticated formulas, we can estimate it more simply: a “15 delta” option means approximately a 15% chance it will be in-the-money at expiration.
- Probability of price going below put strike: 15%
- Probability of price going above call strike: 15%
- These are mutually exclusive events (can’t happen simultaneously)
Therefore, the probability of price going either above the call OR below the put is 30% (15% + 15%).
This means the probability of price staying inside the two strikes is 70% – close to our calculated 68%.
The breakeven points for this strangle are:
Upper breakeven: $4685 + $10.10 + $25.20 = $4720
Lower breakeven: $4240 – $10.10 – $25.20 = $4204
Iron Condor Success Rate Basics
An iron condor is just a strangle with two extra legs to define the risk.
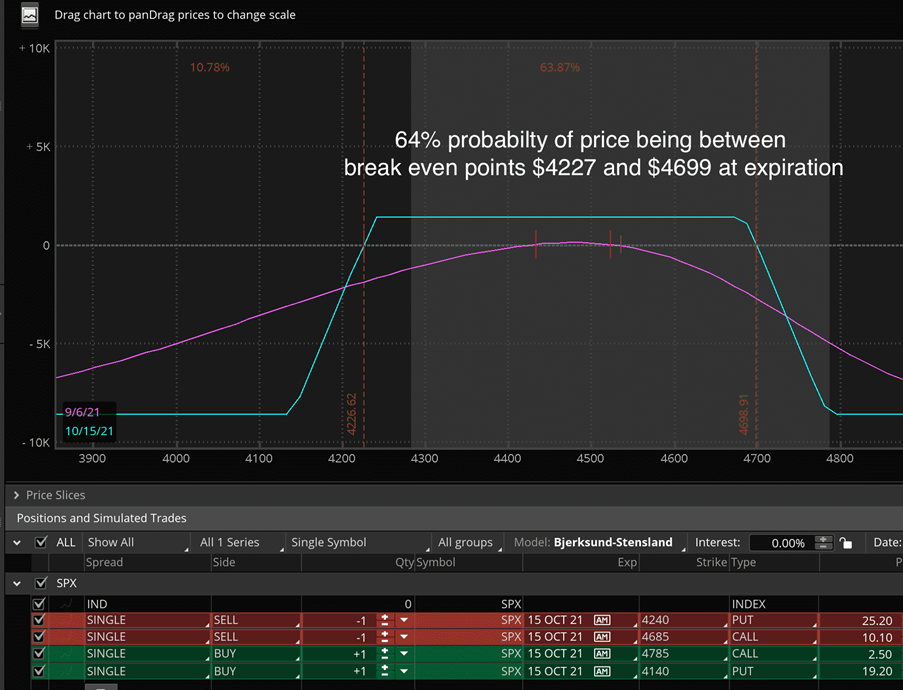
Let’s add protective legs to our strangle:
- Buy one Oct 15 SPX call with strike $4785 at $2.50
- Buy one Oct 15 SPX put with strike $4140 at $19.20
Now the success rate of this iron condor drops to 64% – less than the strangle by 4%.
Why the decrease?
It costs $21.70 per share to buy the protective legs, which brings the breakeven points closer to the current price.
New Upper Breakeven: $4685 + $10.10 + $25.20 – $21.70 = $4698
New Lower Lower: $4240 – $10.10 – $25.20 + $21.70 = $4226
The initial premium credit received for this 100-point-wide iron condor is:
($25.20 + $10.10 – $2.50 – $19.20) × 100 = $1,360
The risk-to-reward ratio on this condor is:
($10,000 – $1,360) / $1,360 = 6.35 to 1
This means one loss can potentially wipe out six successful trades – though in reality, not all losses hit max loss and not all wins hit max profit.
Understanding proper position sizing becomes critical with these ratios.
How Spread Width Affects Success Rate
What if instead of 100-point-wide spreads, we use tighter 30-point spreads?
The success rate decreases further to 62%.
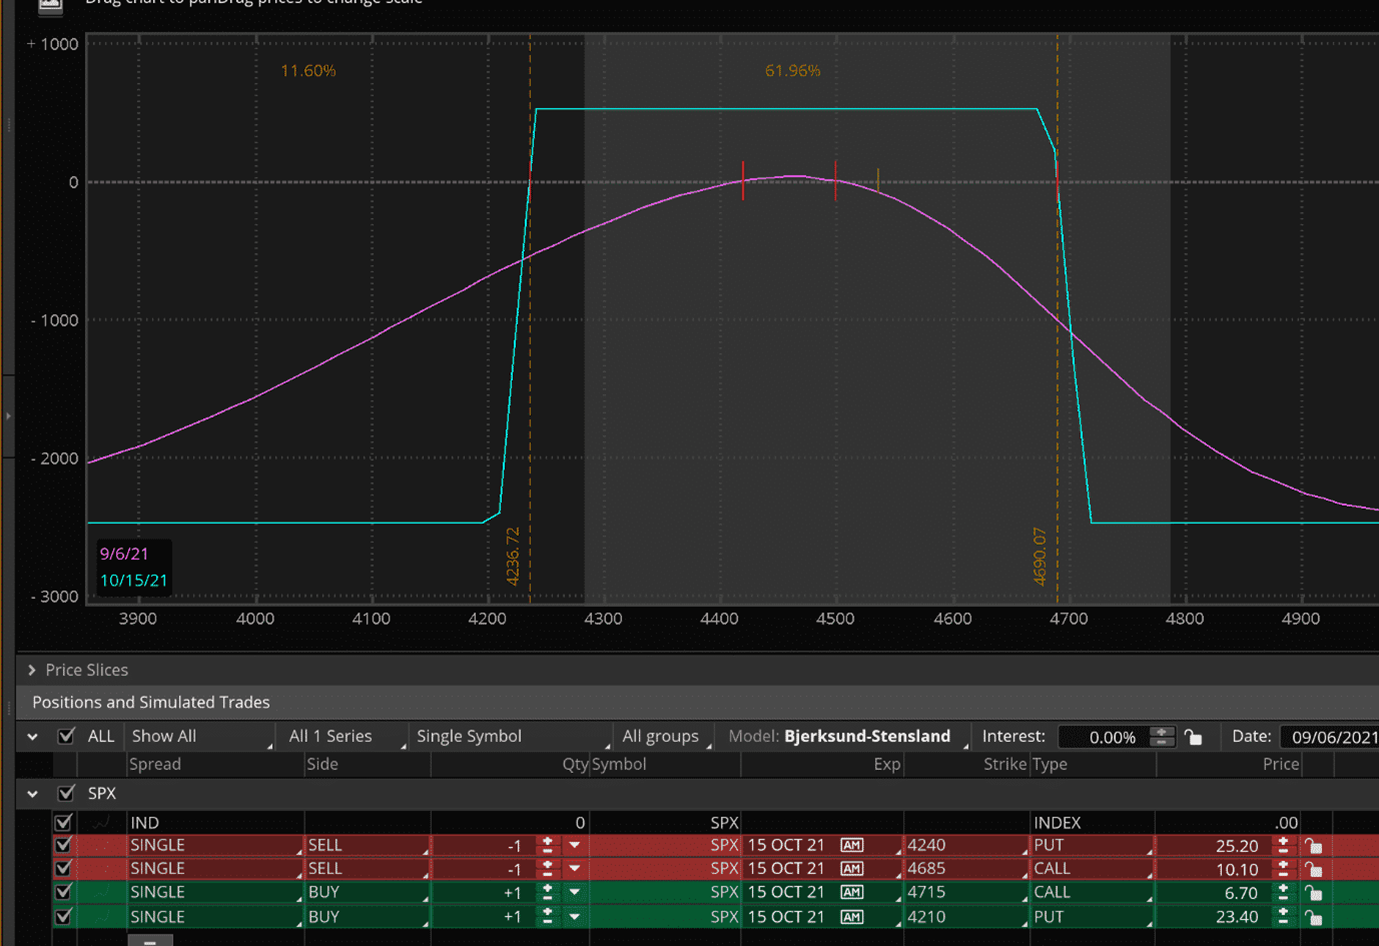
This happens because the protective legs cost more relative to spread width ($30.10 for both legs), bringing the breakeven points even closer to current price.
The premium received is much smaller:
$25.20 + $10.10 – $6.70 – $23.40 = $520
The risk-to-reward on this 30-point-wide iron condor is:
($3,000 – $520) / $520 = 4.77 to 1
This trade is more conservative because one loss wipes out only about five successful trades instead of six.
The tighter spread has a better risk-to-reward ratio, while the wider spread has a higher probability of profit.
This is the fundamental tradeoff in iron condor construction.
Changing the Delta of Short Strikes
Now let’s move the spreads closer together with short strikes at 30-delta (instead of 15-delta).
We’ll keep the spread width at 30 points.
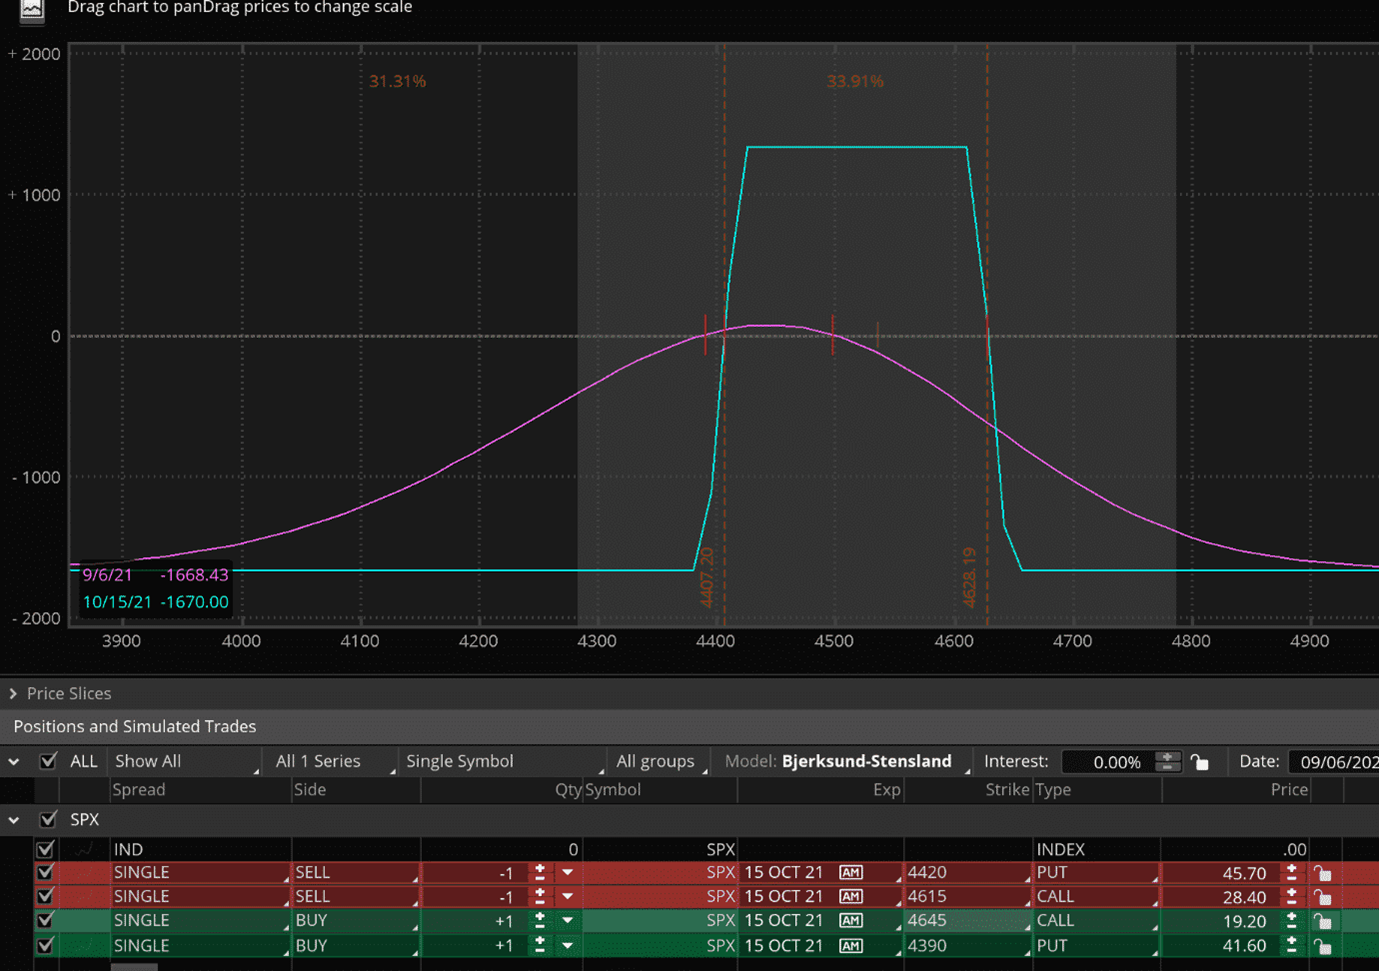
The success rate plummets to just 34%.
The profitable price range has severely shrunk, as shown by the much closer breakeven points.
However, the risk-to-reward is nearly one-to-one:
($3,000 – $1,330) / $1,330 = 1.26 to 1
Risk/Reward Relationship
Here’s the iron law of options trading: The lower the probability of success, the better the risk-to-reward ratio.
By targeting a higher probability of success, you naturally accept a higher risk-to-reward ratio.
This isn’t good or bad – it’s just the math of how options are priced.
Iron condors are high-probability trades, but their risk can be five times more than their reward.
Butterflies are low-probability trades, but their reward can be five times more than their risk.
The options market is relatively efficient, so option prices tend to be fair.
In a perfectly fair market, buyers and sellers would win and lose equally.
However, in reality, option sellers have a slight edge.
They’re paid for taking on implied volatility risk, and implied volatility tends to be higher than realized volatility most of the time.
Think of it like car insurance: insurance companies get paid premiums to take on risk.
It turns out cars don’t crash as often as the premiums suggest, which is how insurance companies profit.
When we sell iron condors, we’re net sellers of options.
This has positive expectancy and should return positive P&L over time.
Research from Project Option found that the average P&L per SPY iron condor was $35.39 when held to expiration without adjustment. The win rate was 77.6% for condors with 30-60 DTE, short strikes at 16-delta, and long strikes at 5-delta.
Theoretical Baseline
Assuming all short strikes are at the same delta:
- Strangles have higher success rates than iron condors
- Wide-spread iron condors have higher success rates than tight spreads
- Wider spreads behave more like strangles
We prefer selling iron condors with:
- Short strikes between 10-15 delta
- Long strikes around 5-10 delta
These iron condors have roughly a 70% theoretical probability of success if held to expiration without adjustments.
But who holds to expiration without adjustments?
Nobody should.
Let’s see what happens when we actively manage these trades.
Real-World Backtest Results
Theory is one thing. Reality is another. In actual trading, we make adjustments and take profits early.
These actions dramatically change the success rate.
Here’s what we do differently from the theoretical model:
Profit-Taking Rules:
- Take profits at 50% of max profit if reached before mid-duration
- This increases wins by locking in gains early
Risk Management:
- Don’t trade across earnings announcements
- Avoid trading when VIX futures curve is in backwardation
- Use stop loss at 2× premium received
- Exit 7 days before expiration to avoid assignment risk
Adjustment Triggers:
- Adjust when short strike delta hits 25
- Adjust when price comes within 3% of short strike
- Use various adjustment techniques depending on situation
These rules work best for iron condors with:
- Short strikes at 10-15 delta
- Expiration timeframe 25-60 DTE
The Backtest Setup
I backtested 50 different ticker symbols – many from our best ETFs for iron condors list.
All had prices over $100, which is preferred for iron condor trades.
Methodology:
- Random dates from start of 2018 to mid-2021
- Skipped dates with VIX backwardation or near earnings
- Sized each trade to collect approximately $1,000 initial credit
- DTE between 25-60 days
- No trade had risk-to-reward ratio greater than 10
- Short strikes at 10-15 delta, long legs at 5-10 delta
Theoretical success rate for these parameters: 70%
Actual success rate: 86%
Each trade was stepped through day-by-day using end-of-day price data in OptionNet Explorer.
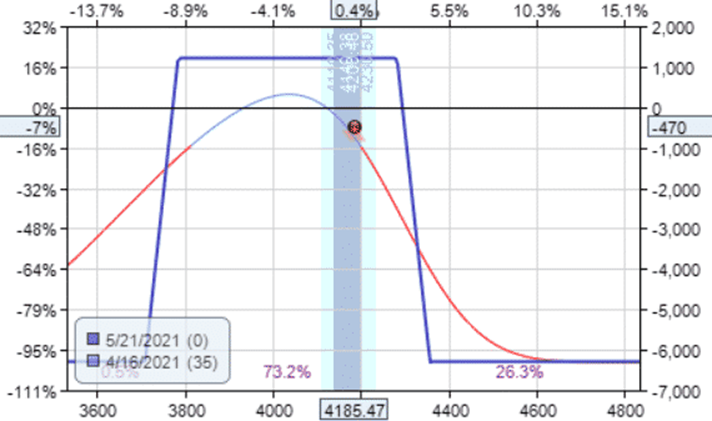
I used trader discretion for adjustments and exits based on the P&L diagram, without looking ahead at future prices.
Navigation was done by watching the Greeks.
Average Win and Average Loss Analysis
Win rate alone doesn’t tell the full story. A 86% win rate doesn’t help if each win is $1 and each loss is $20.
The Numbers:
Average Win: $460
Average Loss: $677
Number of Losses: 7 out of 50 (14%)
With 86% of trades winning an average of $460, and 14% losing an average of $677, this is definitively a winning strategy:
(0.86 × $460) – (0.14 × $677) = $301 average per trade
Complete Statistics:
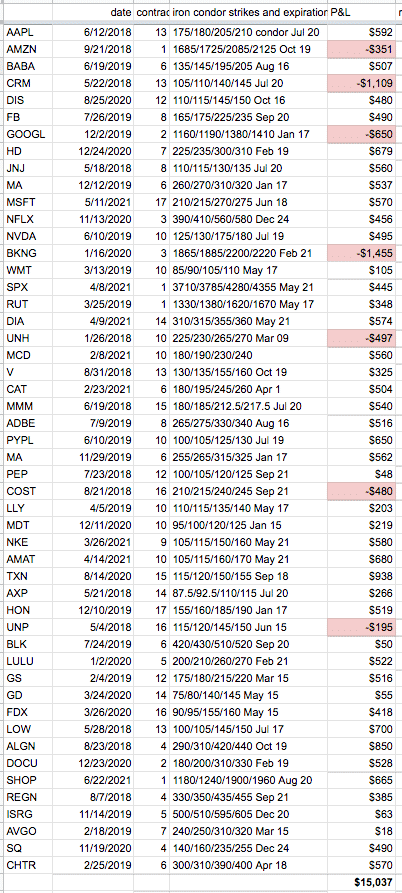
- Total P&L of 50 trades: ~$15,000
- Average P&L per trade: $300.73
- Average premium collected: $994.68
- Average max risk: $5,435.32
- Average risk/reward ratio: 5.4 to 1
- Average return on risk: 5.89%
Roughly speaking, each trade collected $1,000 premium on $5,000 risk, with average risk-to-reward around 5:1.
With average P&L of $300 per trade, the return on risk is about 6%.
Annualized Returns
Giving each trade two months to run (even though many complete earlier), and accounting for time on the sidelines during backwardation or earnings:
- 6% return in 2 months
- Approximately 3% per month
- 36% annualized
This assumes you can replicate backtest results in live trading, which is always harder than it looks.
Key Adjustments That Improved Results
The 16-point improvement from 70% theoretical to 86% actual came from strategic adjustments.
Here’s what worked:
Trades Requiring No Adjustments (19 trades):
These reached 50% profit at mid-duration without any adjustments: BABA, HD, MSFT, NFLX, NVDA, DIA, MCD, CAT, MMM, ADBE, PYPL, MA, NKE, AMAT, HON, LULU, GS, SHOP, and CHTR.
AVGO exited at 7 DTL without adjustment.
SQ, ALGN, and V exited positive within 3 weeks at trader discretion.
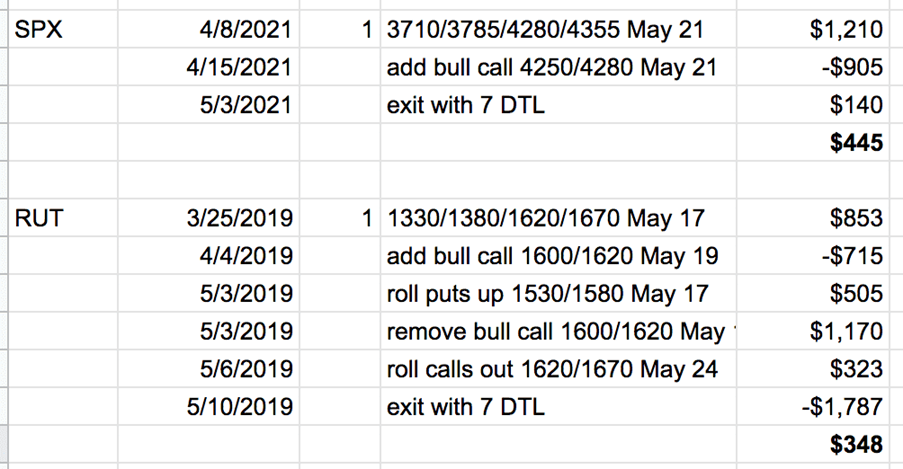
SPX and RUT indices finished positive at 7 DTL (no assignment risk with cash-settled indices).
Standard Adjustments (Multiple trades):
The most common adjustment was rolling the untested side – when one side is in trouble, roll the safe side closer to collect more credit.
This is adjustment #1 in our iron condor management guide.
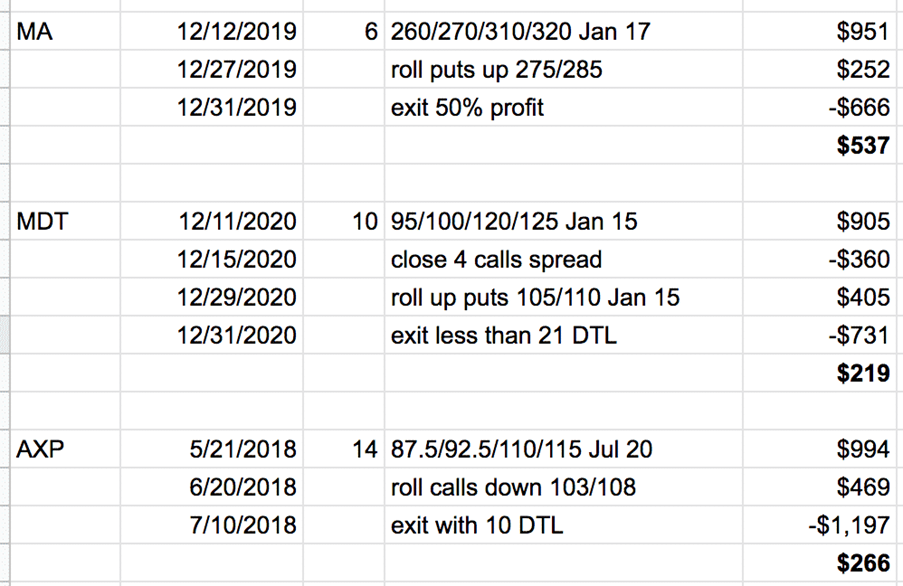
We also rolled spreads out in time when possible for a credit.
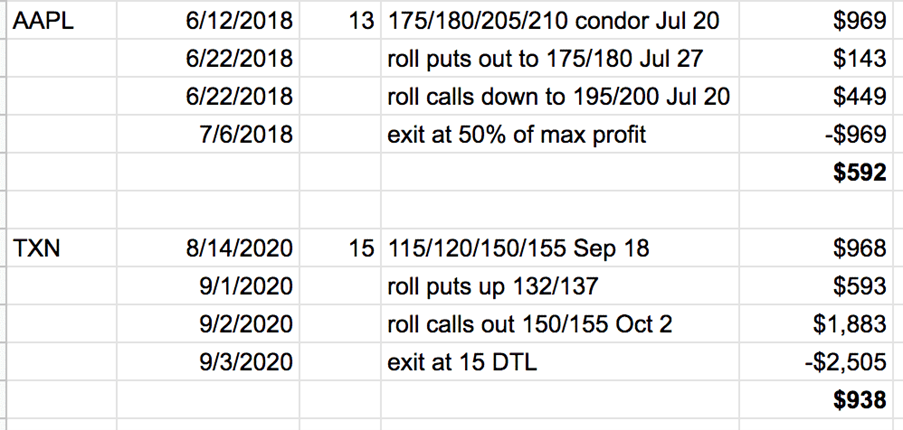
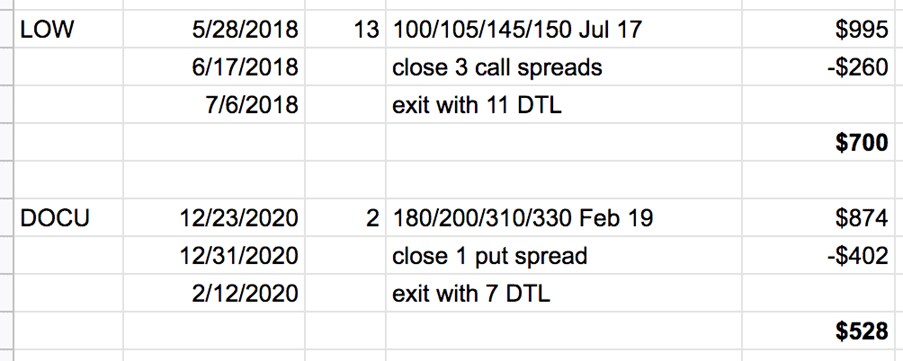
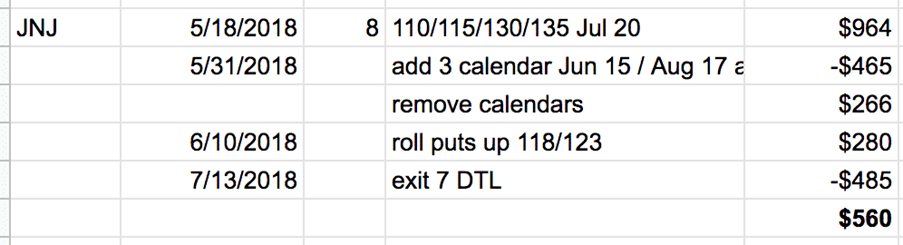
Advanced Adjustments:
- FDX and DIS: Used debit spreads (adjustment #3)
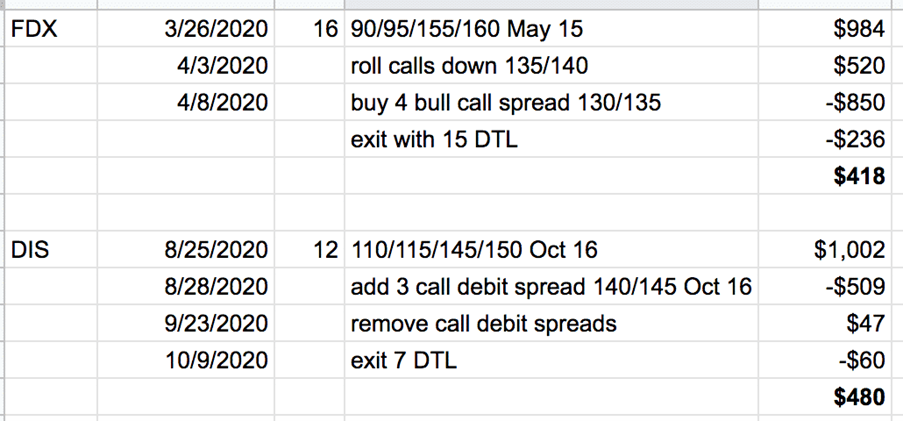
- LOW and DOCU: Added or subtracted contracts (adjustment #2)
- JNJ: Used calendars (adjustment #7)
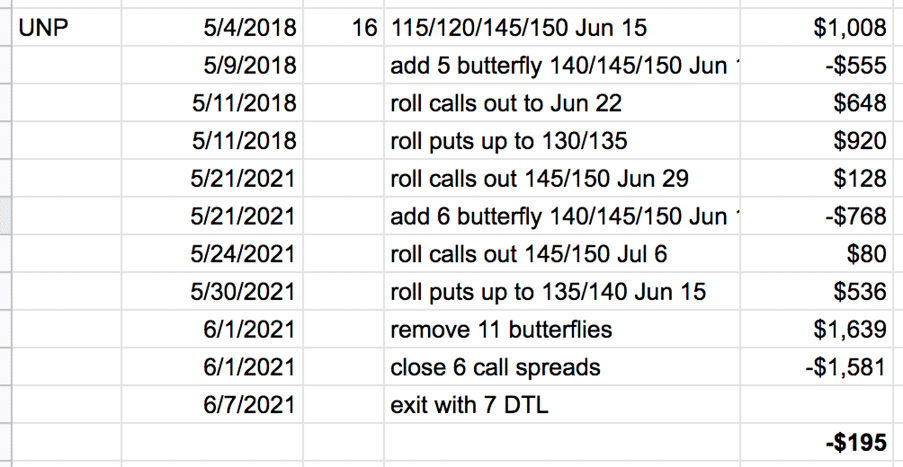
- UNP: Used butterflies (adjustment #8)
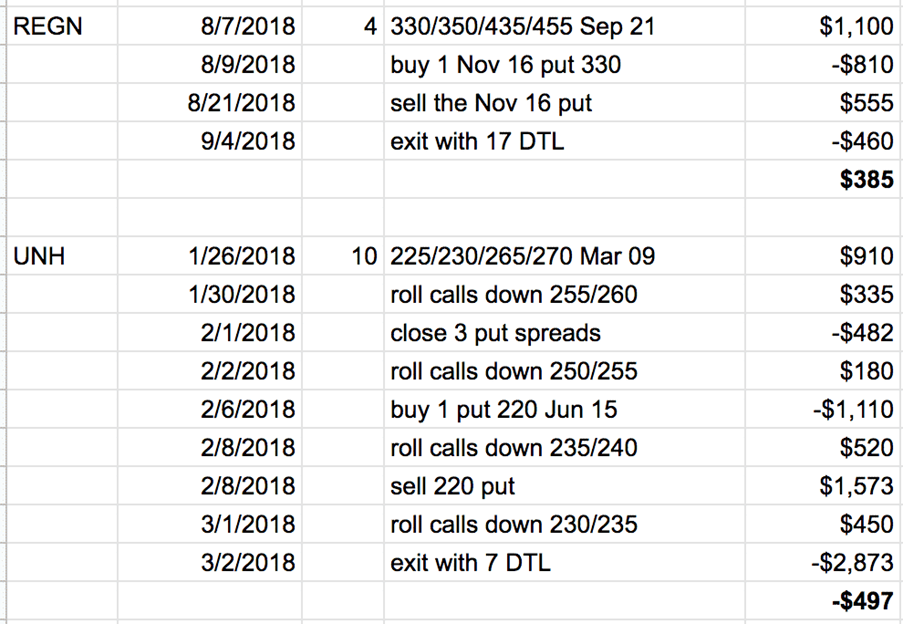
- REGN and UNH: Bought protective puts (adjustment #5)
Pattern Recognition:
Losing trades typically required multiple adjustments from the very start.
When a trade needed 2-3 adjustments early on, I exited at breakeven or small profit rather than fighting it further.
The largest loss was BKNG, but no trade exceeded the 2× premium stop loss.
Frequently Asked Questions
Q: Why is my actual iron condor success rate lower than 70%?
If your success rate is below 70%, you’re likely experiencing one or more of these issues: trading across earnings, poor adjustment timing, taking losses too large (no stop loss), or trading when VIX is in backwardation.
The 70% baseline assumes you avoid these mistakes.
Also verify you’re using 10-15 delta short strikes – higher deltas dramatically reduce success rates.
Q: What’s the difference between theoretical and real-world success rates?
Theoretical success rates (70%) assume you hold to expiration without adjustments.
Real-world rates (86% in our backtest) include active management: taking profits early, making strategic adjustments, avoiding hostile market conditions, and using stop losses.
The gap between theory and practice is where skilled trading makes the difference.
Q: How many adjustments should I expect per iron condor?
In our 50-trade backtest, 38% of trades (19 trades) required no adjustments at all.
These hit the 50% profit target early and were closed.
Another 30-40% needed one adjustment. Only about 20% needed multiple adjustments.
If you’re adjusting every trade multiple times, you may be trading strikes too close to the money or in unsuitable market conditions.
Q: What success rate should I target as a beginner?
Start by targeting the theoretical 70% rate.
Focus on proper trade setup (10-15 delta shorts, 25-60 DTE, avoiding earnings and backwardation) before worrying about advanced adjustments.
As you gain experience, you can improve toward 80-85%. Anything above 85% likely involves either great market conditions or possibly taking profits too early (leaving money on the table).
Q: Should I always hold iron condors to expiration?
No.
Our backtest showed the best results came from taking profits at 50% of max profit before mid-duration.
We also exited 7 days before expiration to avoid assignment risk and gamma risk.
Holding to expiration increases risk without proportionally increasing reward.
The exception is cash-settled index options like SPX and RUT, which have no assignment risk.
Q: What’s more important for success rate – delta selection or spread width?
Delta selection has a bigger impact.
Moving from 15-delta to 30-delta shorts can drop your success rate from 70% to 34% – a massive change.
Spread width matters too (wider is better), but its effect is smaller.
Start with delta selection (10-15 delta shorts), then optimize spread width based on your risk tolerance.
Q: Can I achieve an 86% success rate as a beginner?
Probably not immediately.
The 86% rate in our backtest included trader discretion on adjustments and exits.
Beginners should first master the basics: proper trade setup, taking profits at 50%, using stop losses, and making standard adjustments (rolling the untested side).
As you gain pattern recognition and market feel, your success rate will improve.
Starting at 65-70% is realistic and nothing to be ashamed of.
Q: What if I can’t monitor my trades daily?
Iron condors requiring daily monitoring suggests trades that are too aggressive (strikes too close to money).
If you use 10-15 delta shorts with 30-45 DTE, checking every 2-3 days is usually sufficient.
Set alerts for when short strike delta hits 25 or when price approaches within 3-5% of your strikes.
Most brokers offer mobile alerts that let you monitor without constant watching.
Want to Master Iron Condor Trading?
Understanding success rates is just the beginning.
The real skill is knowing which adjustments to make when, how to read market conditions, and developing the discipline to follow your trading plan even when emotions run high.
If you’re serious about trading iron condors:
Options Income Mastery: Learn the foundational strategies for selling iron condors and credit spreads with proper risk management techniques ($397)
The Accelerator Program: Advanced training covering the exact adjustment techniques used in this backtest, plus position sizing and portfolio-level management for serious traders ($997)
Related Articles
- The Best Iron Condor Strategy
- 10 Best ETFs for Iron Condors
- Iron Condor Adjustments: When and How to Adjust
- How to Fix Losing Options Trades
We hope you enjoyed this article on iron condor success rate.
If you have any questions, please send an email or leave a comment below.
Trade safe!
Disclaimer: The information above is for educational purposes only and should not be treated as investment advice. The strategy presented would not be suitable for investors who are not familiar with exchange traded options. Any readers interested in this strategy should do their own research and seek advice from a licensed financial adviser.


Truly great work here. Essential reference material
Thanks John.
Great work
I do trade Iron Condors often. I wait for high relative IV. In my experience if you combine high IV periods with days to expiration around 60 days, chances of success are very high. I pick 8 to 10 delta. This years 22 out 23 trades profitable. It’s important not to trade IC when IV is low.
My 2 cents
Great advice. Thanks.
As always, Gavin, you are just great.
Many thanks for this comprehensive report.
Best wishes
Kris
Excellent