


Today we’ll discuss the Engulfing Bar.
The best trading patterns are the ones that provide an excellent and reliable trading opportunity.
The Engulfing Bar is one such reliable trading pattern.
So, let’s look at it and understand how to use it for trading.
Contents
- What Is An Engulfing Bar
- What Does Engulfing Bar Reveal
- How To Trade Engulfing Bars?
- How To Select Best Engulfing Bars For Trading
- Bottom line
What is an Engulfing Bar
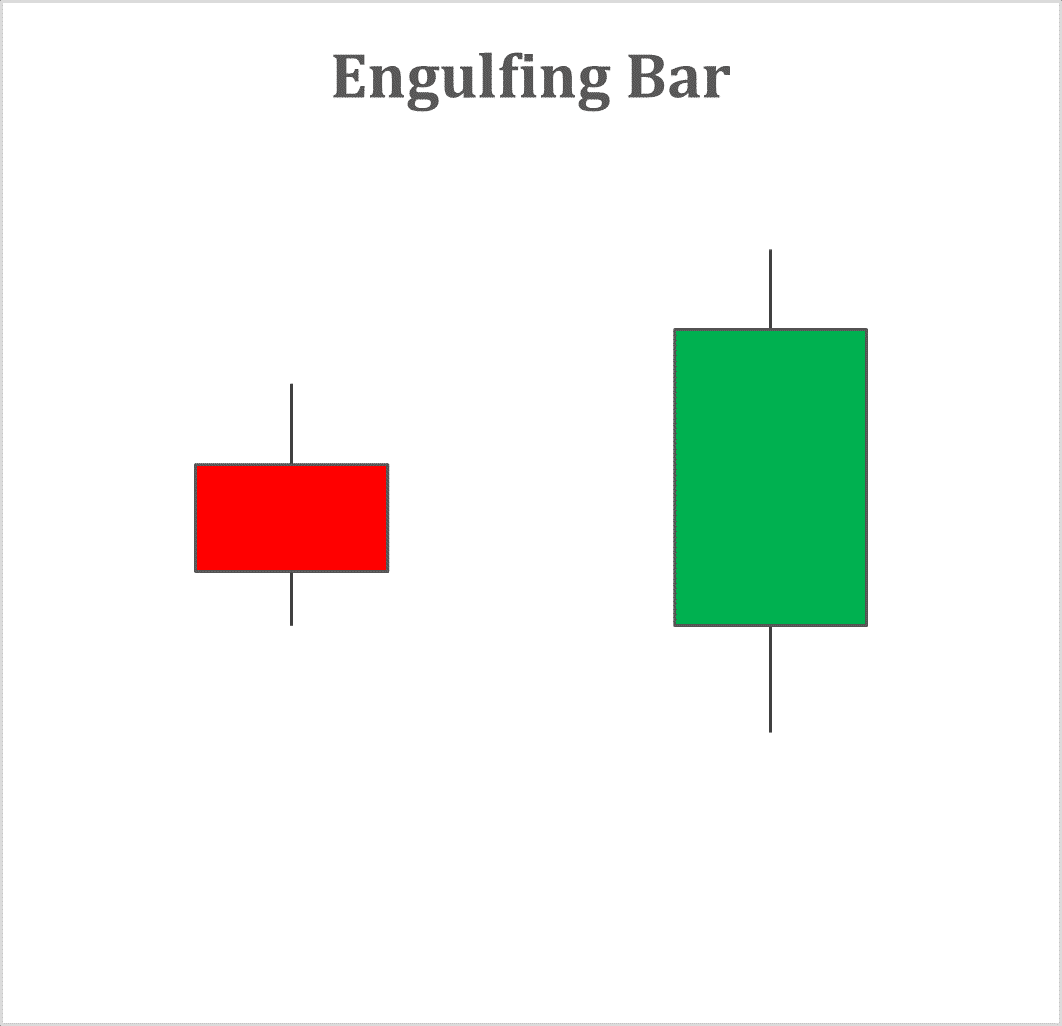
An Engulfing Bar is the candlestick bar engulfing the prior bar.
Hence, the high and low of the engulfing bar extends beyond the highs and lows of the bar engulfed.
The engulfing bar can even engulf more than one candlestick bar.
There are two types of such bars, bullish engulfing bar and bearish engulfing bar.
The bullish engulfing bar has a close higher than the open, whereas the bearish engulfing bar has close lower than the open.
What Does Engulfing Bar Reveal
The bullish engulfing pattern appears in a downtrend market.
The bearish candle on the first day is followed by the bullish candle the following day, which completely engulfs it.
As a result, the price on Day 2 opens lower than the close on Day 1 and closes higher than the opening price of Day 1.
Hence, we can construe that the bears controlled the stock price only at the open, and bulls overpowered them by the day end.
The bullish candle has just a tiny upper wick representing the surging price momentum in the stock till the end of the day.
Thus, it is expected that the price will continue its bullishness even in the coming days.
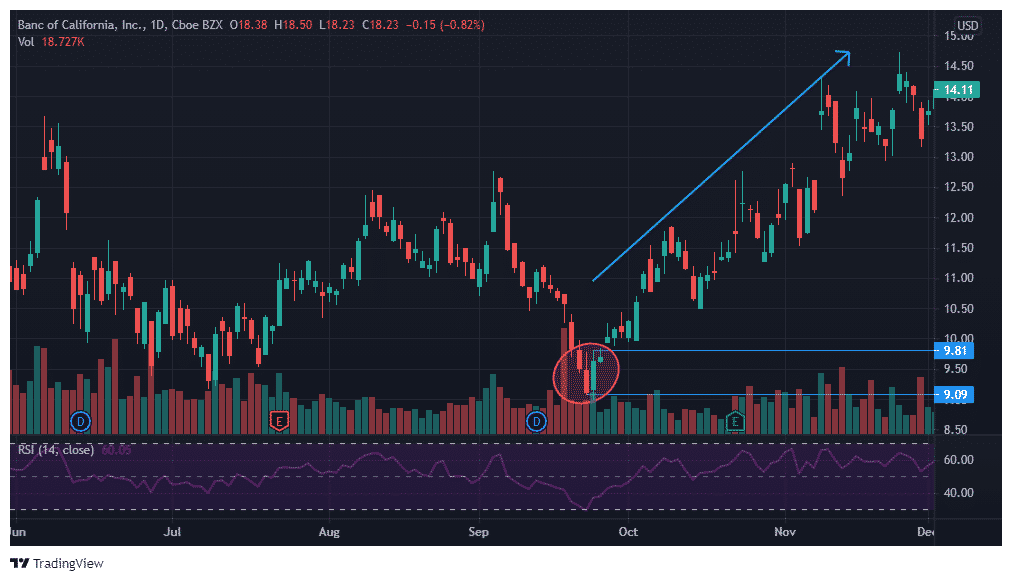
The chart below is of Banc of California, Inc. (BANC) on a daily timeframe.
You can see the formation of a bullish engulfing pattern on 24th September 2020.
The price surged sharply after it.
The stock before the bullish engulfing pattern formation was in a downtrend and rallied after that.
Thus, the bullish engulfing pattern acted as a trend reversal.
The bearish engulfing pattern appears after the price advancement.
The bearish candle follows the bullish candle and completely engulfs it.
The pattern becomes reliable with the open of the bearish engulfing candle above the previous candle close and close below the opening price of the preceding candle.
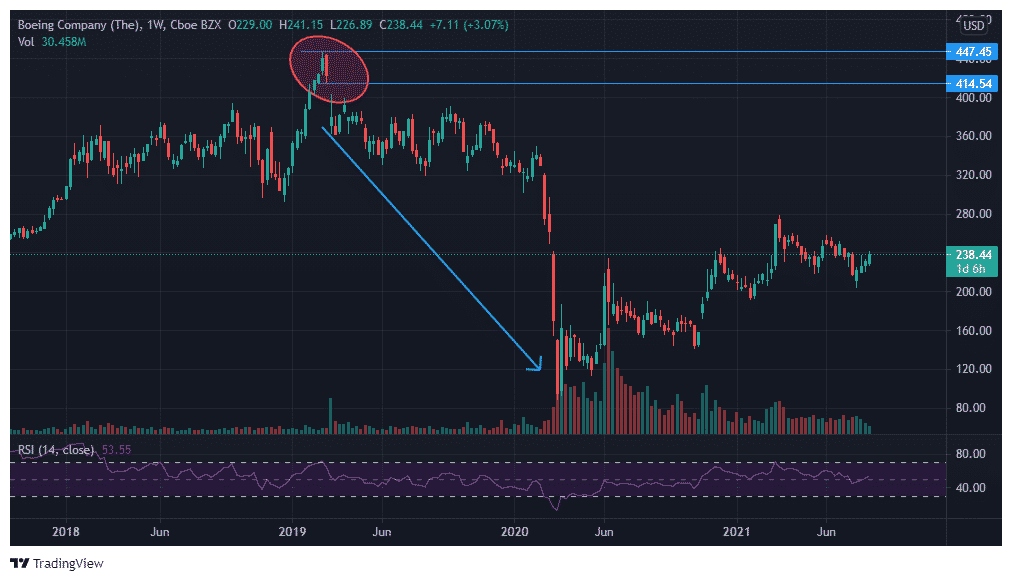
Below is the weekly chart of Boeing Company (BA).
The formation of the bearish engulfing pattern in March 2019 on a weekly chart led to a sharp price fall in the coming year.
How To Trade Engulfing Bars?
You can use bullish and bearish engulfing bars to trade effectively.
The entry can be above its high for a bullish engulfing bar, and the stop loss can be just below its low.
Similarly, the entry can be below its low for a bearish engulfing bar, and the stop loss can be just above its high.
Let’s see the below weekly chart of Shopify Inc. (SHOP).
The bullish engulfing pattern is formed around the $1,000 level, which is significant support.
Thus, one can initiate a long position above the high of the bullish engulfing bar around $1,200 with a stop loss just below its low around $995.
The stock touched the high of $1,650 in the coming year.
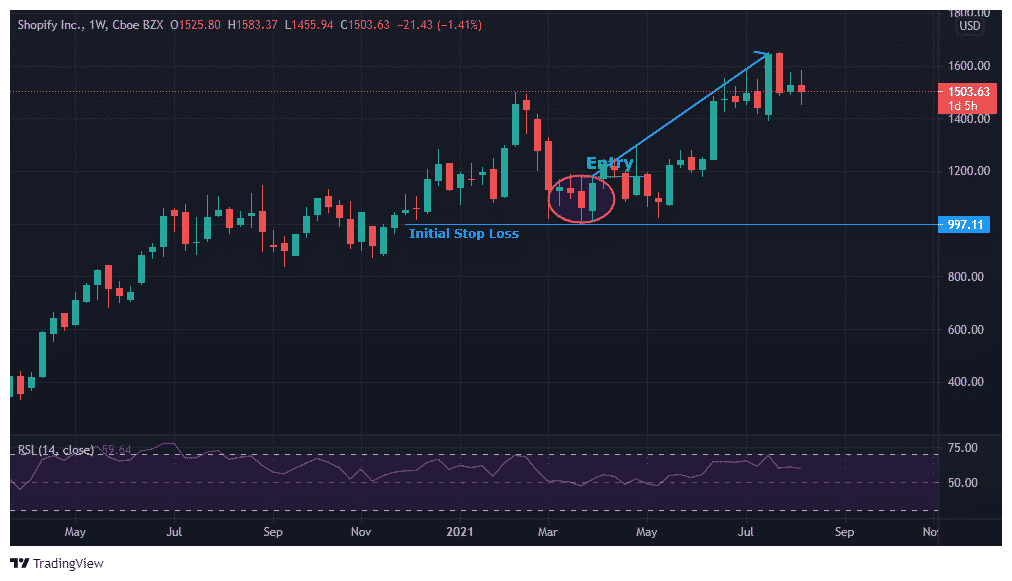
The stock forming a bullish engulfing pattern on a higher weekly timeframe around its important support area provides a more reliable trading opportunity.
Let’s see another example to understand how to trade bearish engulfing patterns.
The chart below is of Square, Inc. (SQ) on a daily timeframe.
The stock formed a bearish engulfing pattern at around the $280 level, its strong resistance.
However, it failed to cross it even after testing multiple times.
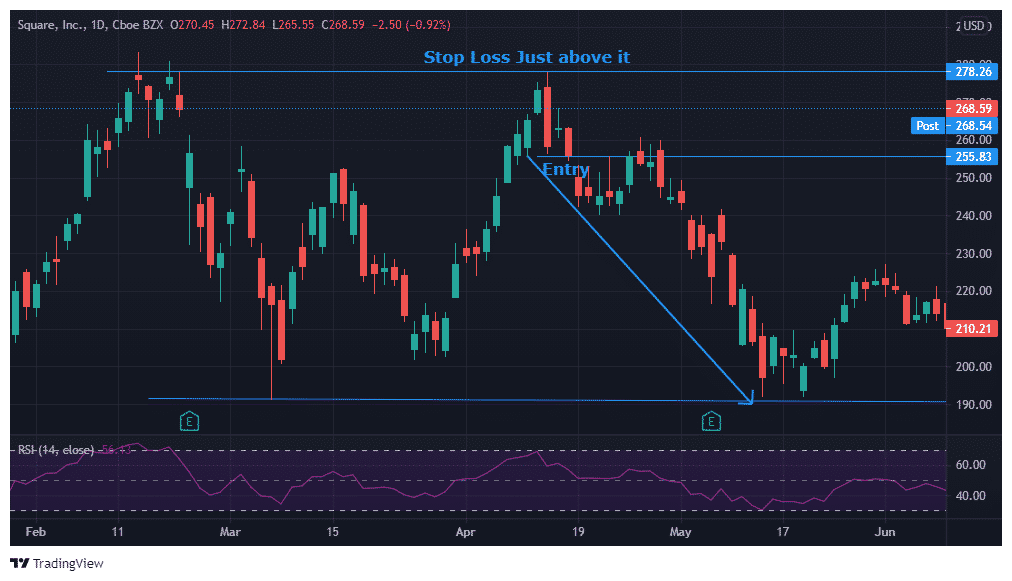
One can enter a short position just below the bearish engulfing bar at around $255.
The stock fell to its previous support level of $190 within one month.
The stop loss for the trade can be just above the high of the bar, around the range 280-283.5, representing the price rejection area.
Click Here For My Top 7 Technical Indicators
How To Select Best Engulfing Bars For Trading
The engulfing bars are not infallible despite providing great trading opportunities.
Hence, you must filter out the best ones to trade.
Let’s see the essential characteristics for choosing the best engulfing bars to trade.
-
Coinciding with swing points
The engulfing bars provide desired results when they get formed near the support/resistance area.
Thus, the engulfing bars coinciding with the swing highs/lows serve the perfect trade opportunity.
-
Avoid Engulfing Bars With A Vast Body
It is good if the engulfing bar engulfs multiple bars.
However, much larger bars do not provide good risk-reward opportunities, and often, the large part of the expected move gets missed.
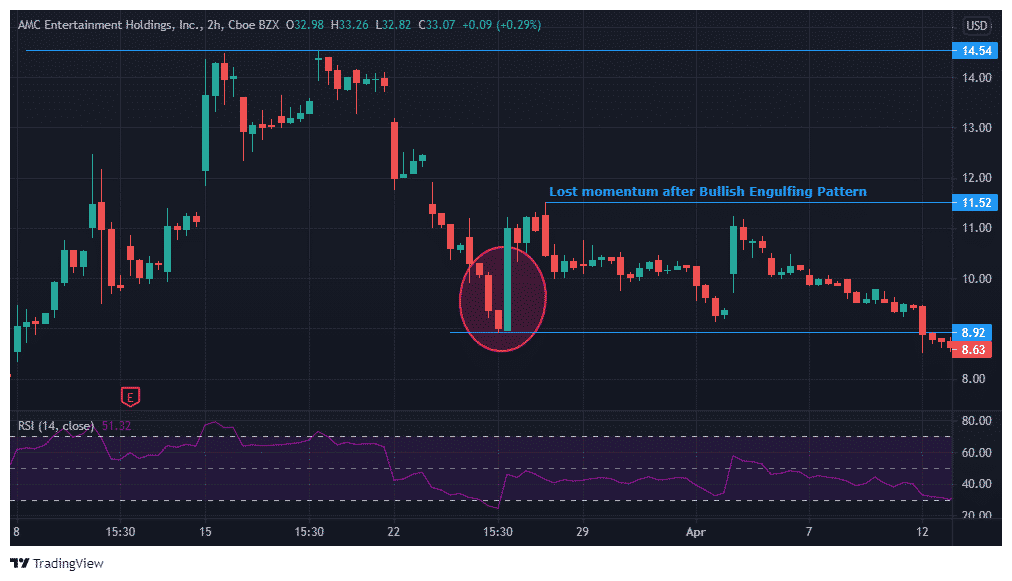
The AMC Entertainment Holdings, Inc (AMC) formed a bullish engulfing pattern on the 2-hour chart on 25th March 2021 after the downtrend.
The bullish engulfing bar was large enough to cover the three previous bearish candles.
However, the significant move happened in the same bullish engulfing bar itself, and after which, the stock lost momentum.
You might find yourself in the lost world after entering the trade with the formation of the bullish engulfing bar.
-
Avoid Trading Weak Close Engulfing Bars
The engulfing bars with tiny or no wick signifies a solid close and a possible move in the expected direction.
Hence, engulfing bars with a wick is considered to be weak.
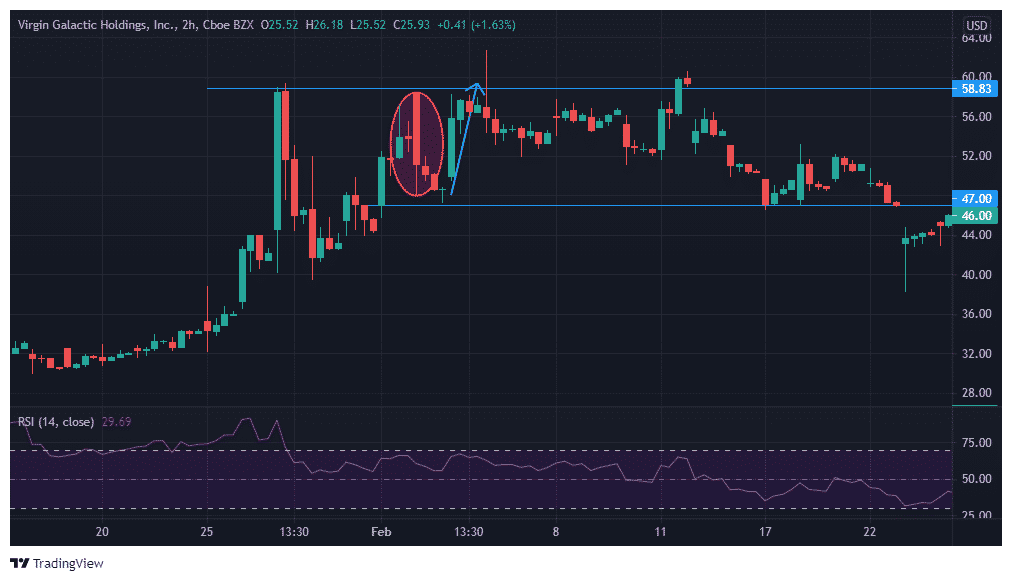
Below is the 2-hour chart of Virgin Galactic Holdings, Inc. (SPCE).
It formed a bearish engulfing bar during the morning session on 2nd February 2021.
The lower wick of the bearish engulfing bar was a bit long.
An entry for short trade below the engulfing candle would have hit the stop loss as the price reversed back to its resistance area of 59.55-62.73.
Bottom line
The engulfing bar is an important trading tool that provides profitable trading opportunities.
However, it would be best to use it with other trading parameters like the swing high/loss, support/resistance, etc.
Thus, such engulfing bars help identify the trend top or bottom and capture the trend reversal.
Trade safe!
Disclaimer: The information above is for educational purposes only and should not be treated as investment advice. The strategy presented would not be suitable for investors who are not familiar with exchange traded options. Any readers interested in this strategy should do their own research and seek advice from a licensed financial adviser.


