


The formation of different trading patterns helps the traders to identify the direction and initiate a trade. We will be looking at and understanding one such trading pattern named “Megaphone Pattern.”
Contents
- What is the Megaphone Pattern?
- How To Spot Megaphone Pattern?
- Trading The Megaphone Pattern
- Failure Of Megaphone Pattern
- Bottom Line
What Is The Megaphone Pattern?
Richard Schabacker was the first to discuss the Megaphone pattern in 1932 in his book “Technical Analysis and Stock Markets Profits.”
The Megaphone pattern is a price action trading pattern that gets formed due to increasing volatility in prices.
It consists of two trend lines diverging from each other in opposite directions.
A series of higher highs and lower lows considered as pivot levels feature in such a pattern.
It occurs at the top or bottom of the market.
The formation of such a pattern in a higher time frame makes it work better and effectively.
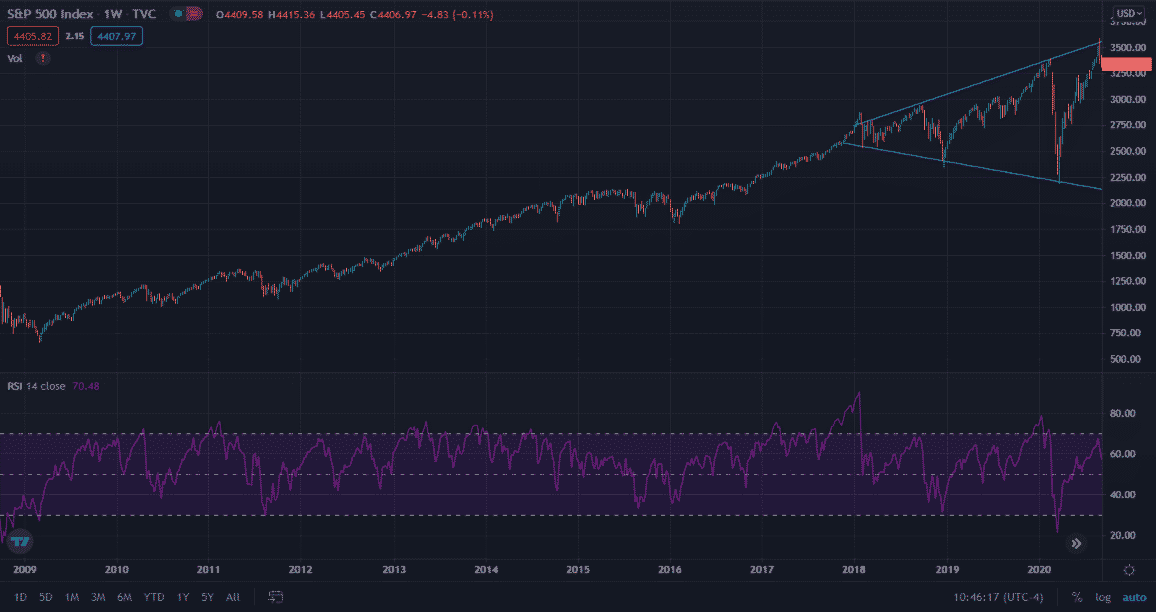
The chart below is of S&P 500 index on a weekly timeframe.
You can see the formation of the Megaphone Pattern in August 2020.
How To Spot Megaphone Pattern?
The Megaphone pattern consists of a series of swing highs and swing lows.
But, there must be at least two swing highs and two swing lows for such a pattern to form.
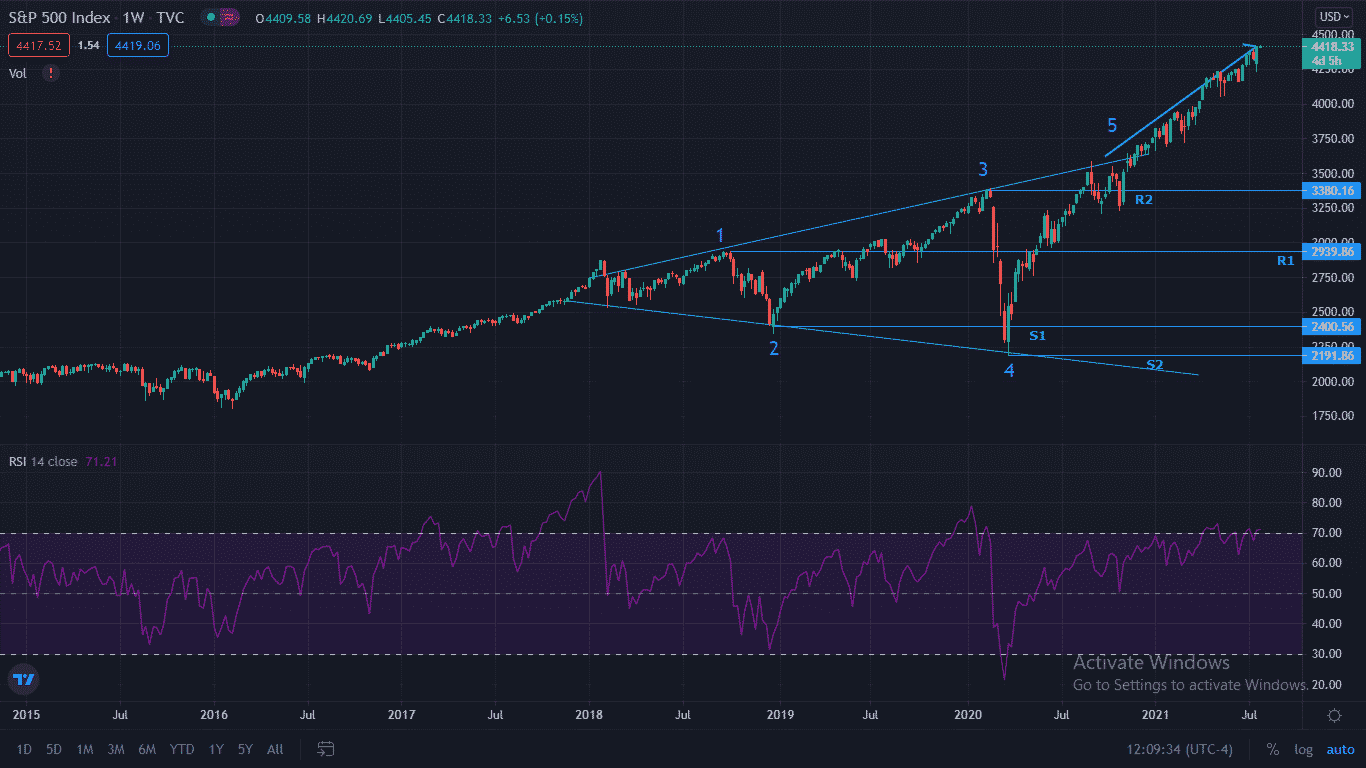
Thus, two trend lines are drawn with the first connecting points 1 and 3 and the second connecting points 2 and 4.
You can see in the chart below that the two trend lines diverge from each other.
The resultant pattern formed is like a Megaphone, also referred to as “Broadening Formation Pattern” or an “inverted symmetric triangle.”
The current swing high or swing low has to close above or below the previous ones.
Thus, resulting in pivot swing highs (R1, R2, R3, and so on) and pivot swing lows (S1, S2, S3, and so on).
A breakout occurs when the price breaks the trend line resistance or support and closes outside it after making a new swing high or low.
The chart of the S&P 500 on a weekly timeframe shows the breakout of the price after the 5th swing high.
Click Here For Our Top 7 Technical Indicators
Trading The Megaphone Pattern
The Megaphone Pattern gives various trading opportunities for the traders.
For example, a trader can initiate a long or short trade after the price breaks and closes outside the trend line.
The chart below is of Walmart Inc. (WMT) on a daily timeframe.
You can see the formation of the Megaphone pattern in the stock during August’2020.
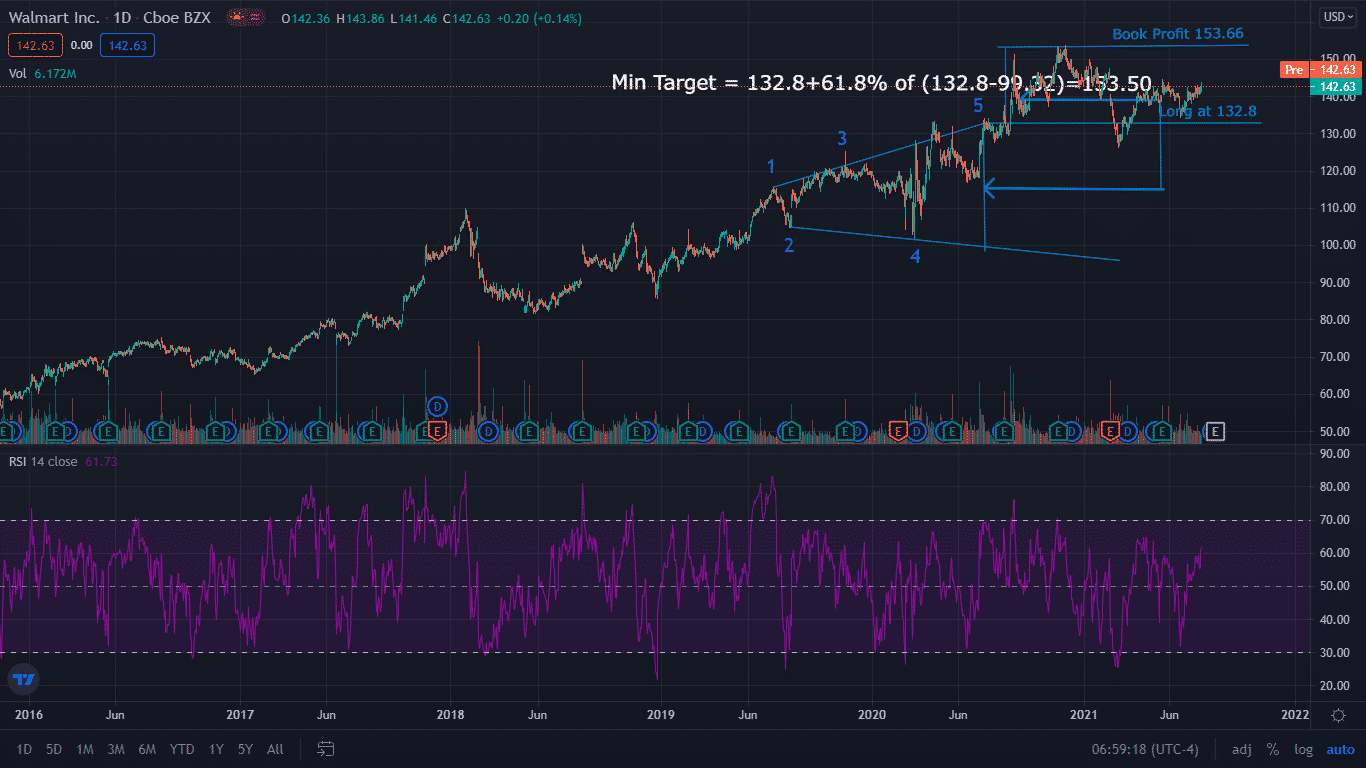
The price broke the upper trendline with the 5th swing high and managed to close outside the pattern.
Thus, it led to the confirmation of a positive breakout.
You can create a long position in the stock to trade the breakout around $132.8, with a stop loss at 3rd swing high.
In addition, you can set the target for such breakout trade at Fibonacci levels.
First, you need to ascertain the vertical distance of the pattern.
In this case, the pattern height is $33.48 (132.8 – 99.32).
You can set the targets at Fibonacci ratios such as 61.8% or 78.6% of the computed vertical height from the breakout point.
The target here in the example is $153.50, based on the 61.8% Fibonacci ratio of the vertical length of the pattern.
The stock price reversed after making a high of $153.66.
The formation of such a pattern at the top or bottom of a trend indicates increased volatility.
The disagreement between the buyers and sellers results in multiple swing highs and swing lows.
A breakout on either side happens when one overpowers the other and thus indicates confirmation of the direction.
Failure of Megaphone Pattern
The Megaphone pattern is the graphical representation of disagreement between buyers and sellers due to heightened volatility.
A breakout or breakdown above or below the trend line confirms the direction.
It often happens that the price fails to break the trend line.
For example, suppose such a pattern is formed in an uptrend, and the price fails to break the upper trend line.
Then, the traders can initiate a short position below the 3rd swing high.
Similarly, one can initiate a long position above 3rd swing low in a bearish market if the price fails to break the lower trend line.
An Example
The chart below is of the index Dow Jones Industrial Average (DJI) on a weekly timeframe.
The Megaphone pattern had formed in December 2019.
However, the breakout of the price above the upper trend line in January 2020 failed as it was unable to sustain above the 29,500 level.
The breakout of the price out of the pattern failed, and it started to reverse.
Therefore, one can initiate a short position in the index after it closes below the 3rd swing high, around 27,000.
Thus, the first target can be the midpoint of the vertical length of the pattern, approximately 23,800.
Further, the more extended target two can be the 4th swing low 21,600.
Finally, the closing target can be somewhere below the 4th swing low, around 19,000, colliding with the lower trend line.
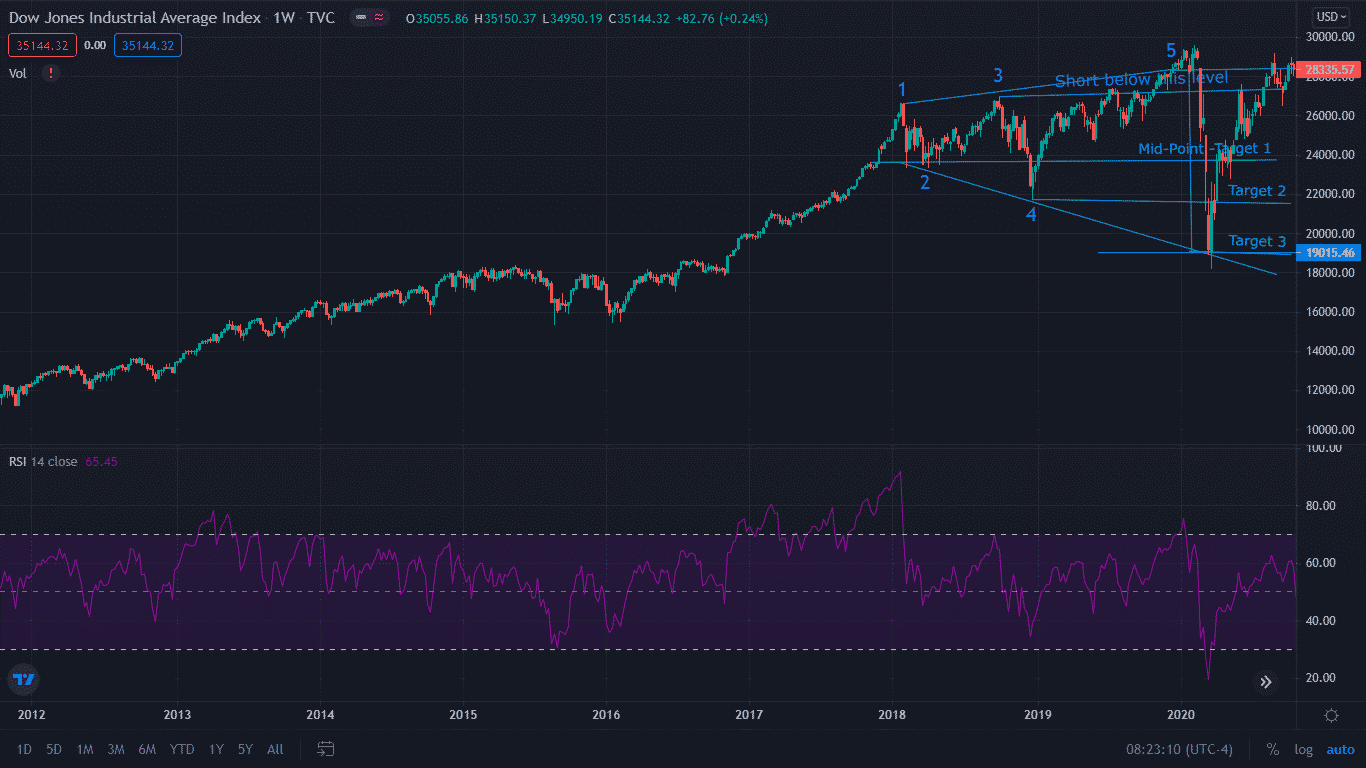
The onset of the Covid pandemic triggered the massive market plummet in March 2020.
However, the Megaphone pattern formation and the price rejection above the 5th swing high indicated early signs of reversal.
The price close below the 3rd swing high, i.e., 27,000, confirmed the bearish view.
The index made a low of 18,213.65 before reversing.
The formation of the Megaphone pattern on a weekly chart of the index had signaled the heightened volatility.
Further, the price rejection above the 5th swing high showed early signs of exhaustion and the possibility of reversal.
Bottom Line
The formation of different patterns helps the traders to predict the price direction.
For example, the Megaphone pattern is beneficial as it guides the traders about the price direction after the volatility subsides.
A price breakout of the pattern confirms the continuation of the trend, and a rejection indicates the possibility of reversal.
Hence, the traders should use it effectively to initiate a trade as it provides several trading opportunities.
Trade safe!
Disclaimer: The information above is for educational purposes only and should not be treated as investment advice. The strategy presented would not be suitable for investors who are not familiar with exchange traded options. Any readers interested in this strategy should do their own research and seek advice from a licensed financial adviser.

Amazon Associate Disclosure
Options Trading IQ is a participant in the Amazon Services LLC Associates Program, an affiliate advertising program designed to provide a means for sites to earn advertising fees by advertising and linking to amazon.com


