


The Christmas tree options strategy is a six-legged options structure in the butterfly family.
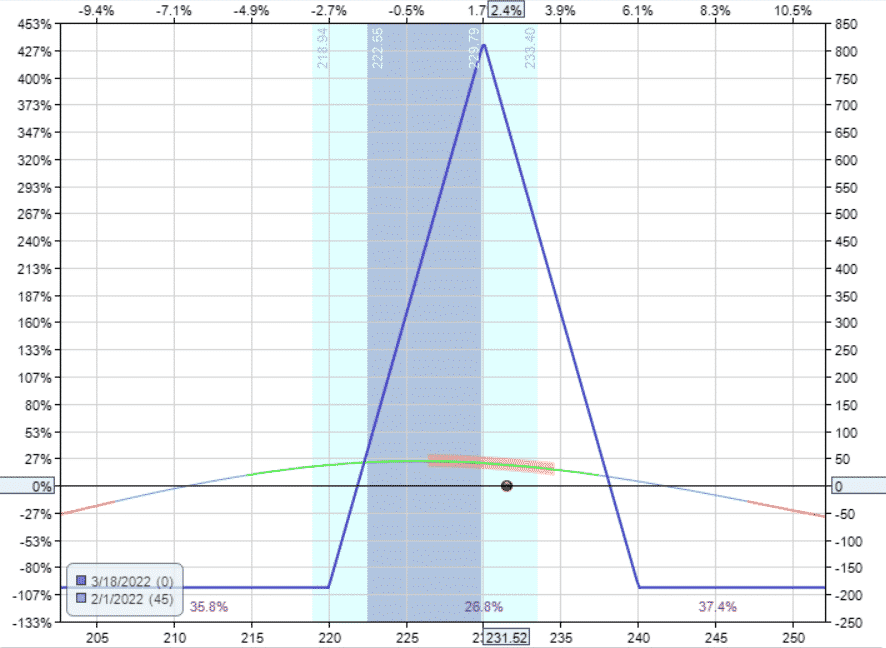
The payoff diagram looks like a Christmas tree that is not quite standing perfectly straight. Here you see it leaning slightly to the right.
source: OptionNet Explorer
Contents
- Christmas Tree Options Strategy
- The Greeks
- Reward To Risk Ratio
- Wider Tree Versus Narrow Christmas Tree
- Expiration Breakeven Prices
- Bearish or Bullish
- Sell One, Buy Two
- Different From Unbalanced Broken-Wing Butterfly
- In Summary
Christmas Tree Options Strategy
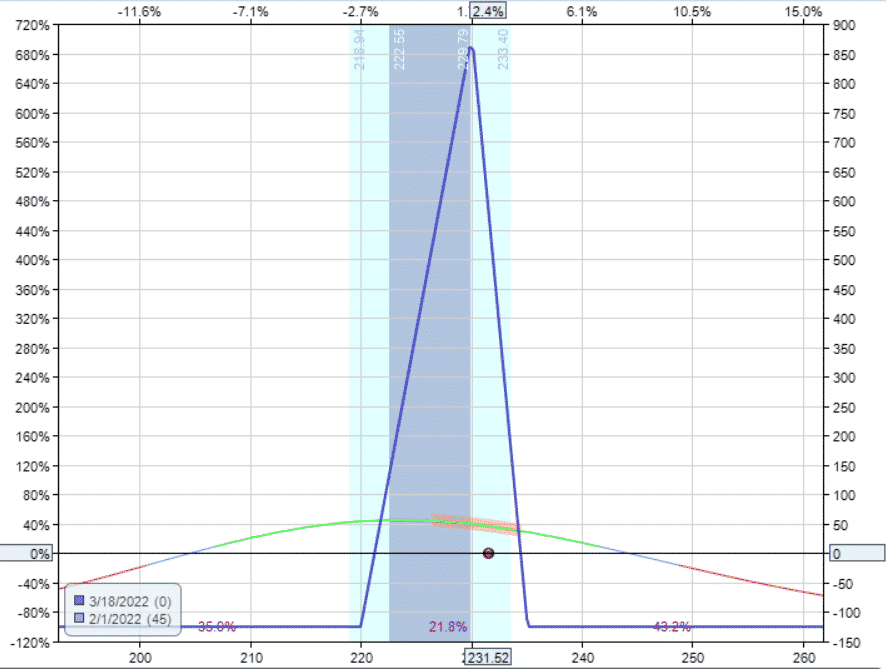
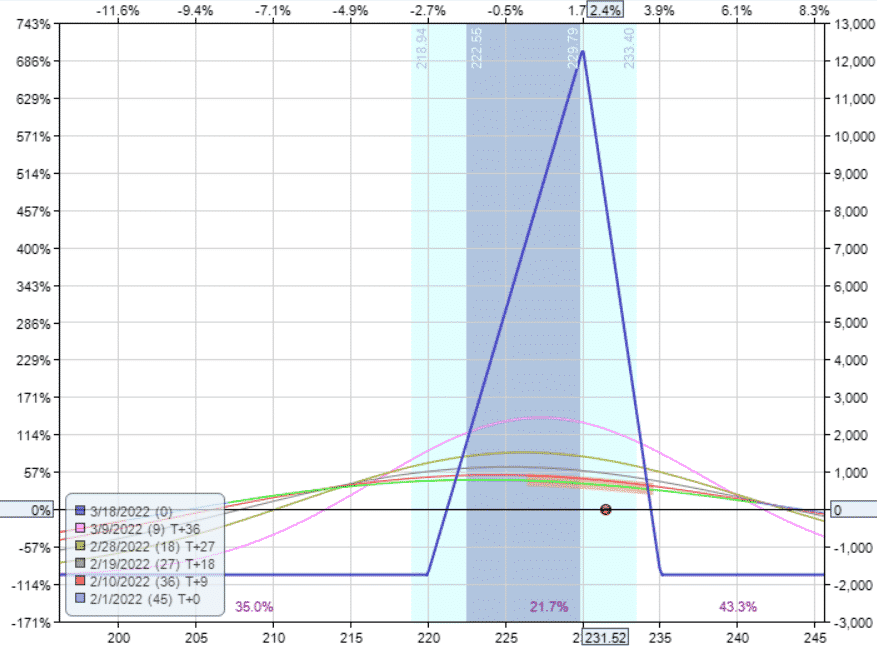
The above payoff diagram was an example in Visa (V) using the following options to construct a “long call Christmas tree.”
Date: February 1st, 2022
Price: V at $231.52
Buy one March 18 V $220 call at $16.23
Sell three March 18 V $230 calls at $9.78
Buy two March 18 V $235 calls at $7.18
Debit: –$125
The Greeks:
Delta: -2.41
Theta: 0.76
Vega: -3.90
Gamma: -0.15
We buy one option, skip a strike, and then sell three options.
Then we buy two options at the next strike up.
Hence it is known as a 1-3-2 structure or the 1-3-2 butterfly.
The three short options in the middle are the body of the butterfly.
It is unbalanced because there are two options to the right of the body, but only one option to the left of the body.
Like a butterfly, the six options can be all calls, or it can be all puts.
The graph will look the same because the two will be synthetic equivalents of each other.
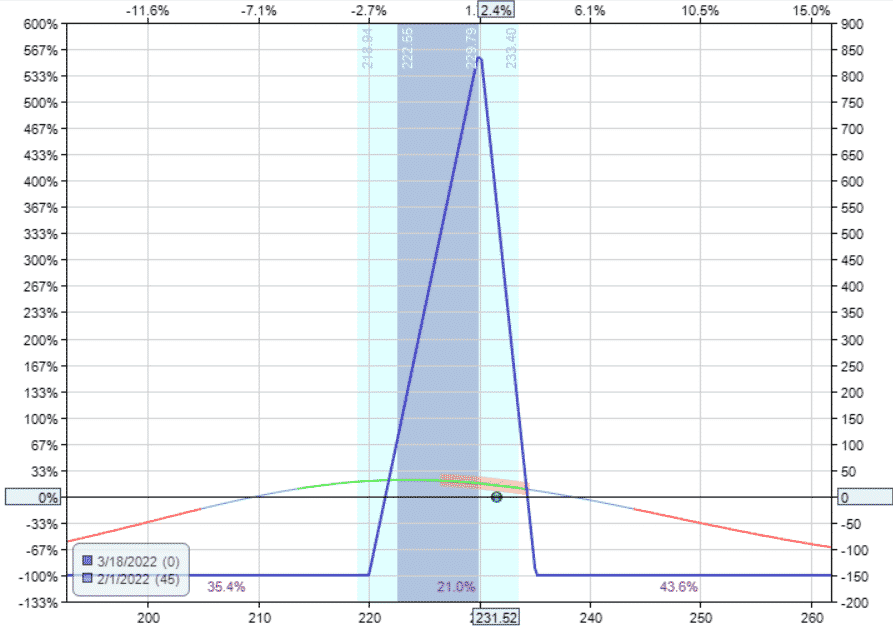
We construct the equivalent “long put Christmas tree” using only put options to show you that it is almost the same.
Date: February 1st, 2022
Price: V at $231.52
Buy one March 18 V $220 put at $5.08
Sell three March 18 V $230 puts at $8.58
Buy two March 18 V $235 puts at $11.08
Debit: –$150
Delta: -2.41
Theta: 0.76
Vega: -3.90
Gamma: -0.15
The Greeks
In both cases, the Greeks are nearly identical.
The two construction are synthetically equivalent.
The spread makes money when there is a drop in implied volatility.
This is evidenced by the negative vega.
The spread also makes money by the passage of time.
This is evidenced by the positive theta.
These two Greek characteristics categorize this spread as part of the family of premium selling strategies, of which the credit spread and the iron condor are members.
This is true even though we are paying a debit to initiate the spread.
The Greeks determine how the spread will behave, not whether we paid a debit or credit.
It is a premium collection strategy because we are selling more premium than we are buying.
Even though we are short three options and long three options, the options that we are short are closest to the current price — which means they have the highest premium or extrinsic value.
Reward To Risk Ratio
The debit paid can affect the reward-to-risk slightly.
We see that in this particular example, the call tree takes a debit of $125 to initiate the trade, while the put tree requires a higher debit of $150.
The max risk on the trade is the debit paid — just like the symmetrical balanced butterfly.
Looking at the two graphs, they look almost the same, but not quite.
The tip of the call tree has a max potential reward of $855.
The tip of the put tree goes up to only $845.
The call tree has a reward-to-risk ratio of $855/$125 = 6.8
The put tree has a reward-to-risk ratio of $845/$150 = 5.6
Depending on the skew between the puts and calls at the time, one may be slightly more advantageous than the other.
Some investors may compare the two before going with the lower debit and higher reward-to-risk; while others may not feel that the difference is significant.
Wider Tree Versus Narrow Christmas Tree
The tree shown in this example is quite tall and narrow.
This is because we picked strikes that are one strike adjacent to the next strike and skipped one strike.
When we say skip a strike, we don’t mean literally skip one strike.
We mean to keep the ratio between the strikes in that same ratio of 2 to 1.
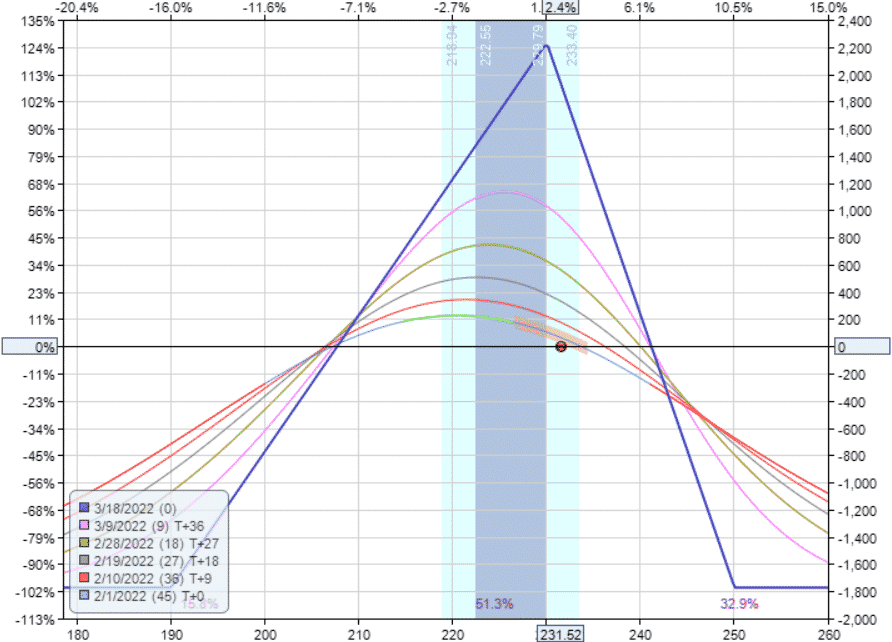
For example, we can certainly widen out our strikes like this.
Buy one Mar 18 V $190 call
Sell three Mar 18 V $230 calls
Buy two Mar 18 V $250 calls
Debit: –$1773
Delta: -27.94
Theta: 10.65
Vega: -37.11
Gamma: -2.20
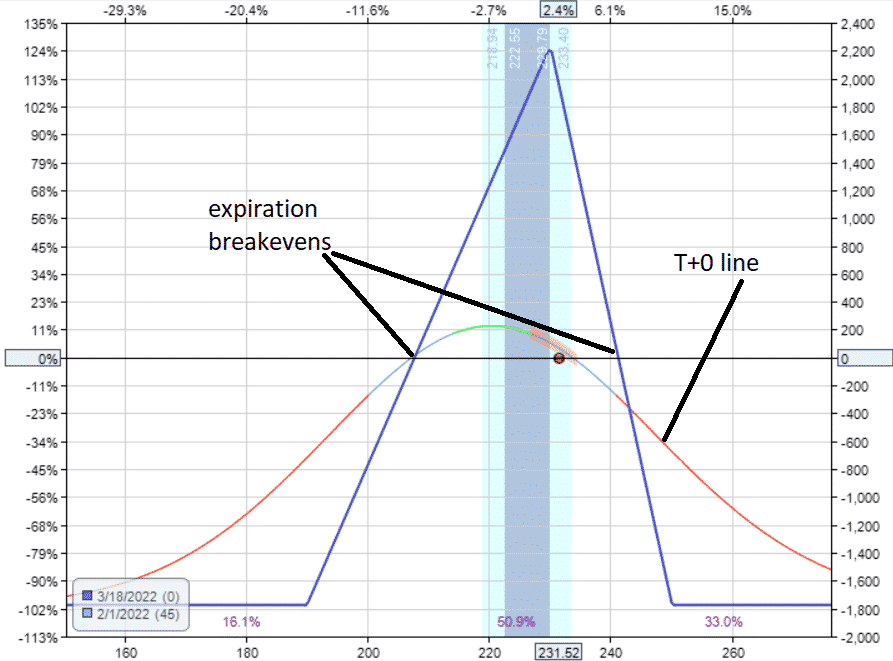
This wider tree costs more and has a lower reward-to-risk ratio of $2200/$1773 = 1.2
The Greeks are much larger because we have more capital for the wider tree trade.
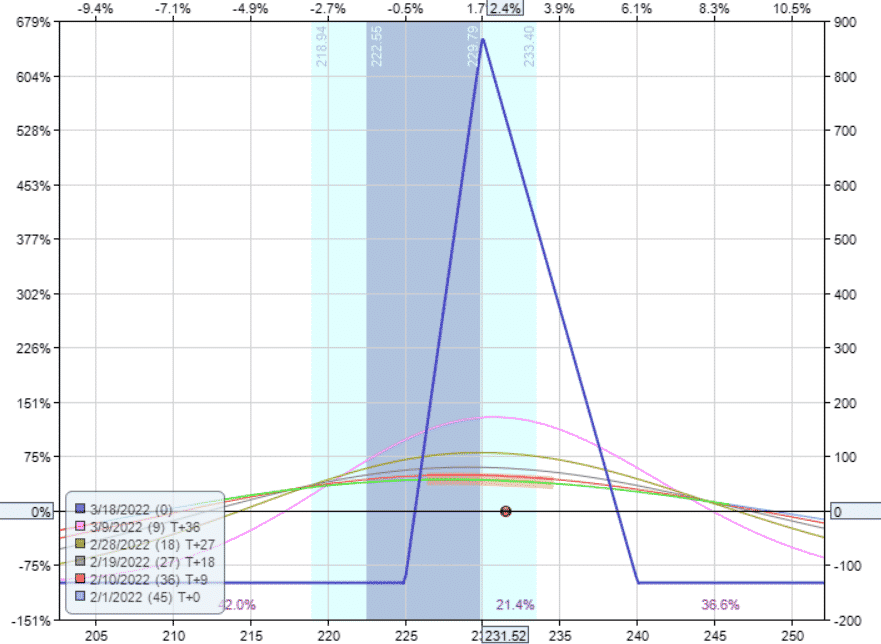
For comparison, we can scale up the narrow tree to 14 contracts so that we have similar $1750 capital at risk:
Buy fourteen March 18 V $220 calls
Sell forty-two March 18 V $230 calls
Buy twenty-eight March 18 V $235 calls
Debit: $1750
Delta: -33.67
Theta: 10.62
Vega: -54.59
Gamma: -2.14
While the starting position Greeks are not much different, we see that narrow trees have a flatter T+0 line.
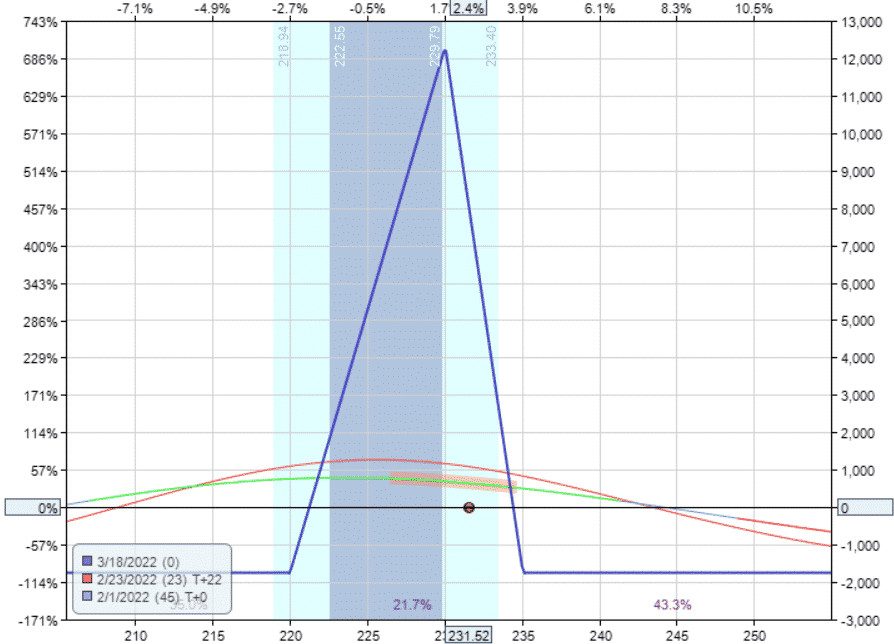
source: OptionNet Explorer
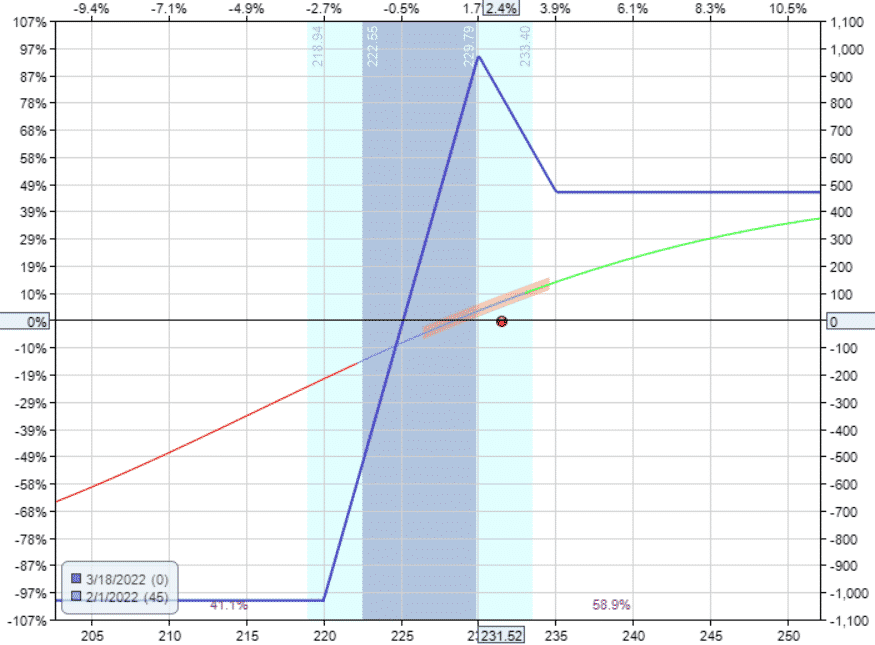
Interim Dates:
The green line is the T+0 line.
This line indicates the payoff right now with 45 days till expiration.
I’ve turned on the red T+22 line, which indicates the estimated payoff graph 22 days from now with 23 days till expiration.
Note that the T-lines are only estimates of the future.
In reality, we should see the price dot sitting right on the T+0 line on the graph.
Sometimes these estimates are not exact, especially when there are wide bid-ask spreads on the prices.
It is important to use a highly liquid underlying or use indices when trading Christmas trees in order to get a tighter bid-ask spread.
If you end up giving the market maker a nickel or dime on each leg of the tree, it can add up when you have six legs.
Expiration Breakeven Prices
The expiration breakeven points on the wider tree give us a profit range of $208 to $241.
We will be profitable if the price falls between this range at expiration.
The expiration breakeven points on the narrow tree are tighter together: breakeven at $221 and $234.
In theory, this suggests that the wider tree has a higher probability of profit if held to expiration.
In practice, when it is common to exit before expiration, we see that the profit range of the narrow tree is quite respectably large in the range of $115 to $240 for the T+0 to T+18 lines.
All of the T-lines have breakeven points that are wider than the expiration breakevens.
It is only at the very end near expiration does the profit range tighten up to $221 to $234.
This suggests that the edge in trading narrow trees is to exit early, or at least exit before the breakeven points start to get close together.
In contrast, the wide tree’s profitable price range is initially small but widens with time.
Bearish or Bullish
Study the peaks of the T-lines and the expiration graph of the narrow tree and the wide tree.
Is this a bullish or bearish strategy?
It is a neutral to slightly bearish strategy, even though the tree is tilted to the right.
We placed the short strikes at the money.
If the price ends up at the short strike at expiration, that is when we make the most money.
It is slightly bearish because there is greater profitability to the left of the initial price of $231.
The peaks of the T-lines are to the left of the initial price.
The profitable price range is larger to the left of the initial price.
Look at the delta in all of the above examples; they are all negative.
A negative delta is bearish, meaning that profits increase as price decreases.
The selection of calls versus puts does not determine if the strategy is bearish or bullish.
The direction where you have skipped the strike determines whether the tree tilts to the left or right, or is bullish or bearish.
We can make the tree tilt to the left (instead of the right) by making the following selection of strikes for the narrow tree.
Buy two Mar 18 V $225 calls
Sell three Mar 18 V $230 calls
Buy one Mar 18 V $240 calls
Debit: –$132.5
Delta: -1.09
Theta: 0.75
Vega: -4.49
Gamma: -0.13
The delta is still negative, so it is still bearish.
But it is less bearish than when it was tilted to the right.
Sell One, Buy Two
An alternative way of thinking of the Christmas tree spread is to see it as selling a big wide credit spread and buying two small debit spreads as hedges.
You can see this better if I organize the six options of the last example like this.
Large bear call spread:
Sell one Mar 18 V $230 call
Buy one Mar 18 V $240 call
One small long call debit spread:
Buy one Mar 18 V $225 call
Sell one Mar 18 V $230 call
Another small long call debit spread:
Buy one Mar 18 V $225 call
Sell one Mar 18 V $230 call
We have the exact six options as.
One Christmas tree spread:
Buy two Mar 18 V $225 calls
Sell three Mar 18 V $230 calls
Buy one Mar 18 V $240 calls
Different From Unbalanced Broken-Wing Butterfly
How is the Christmas Tree spread different from an unbalanced broken wing butterfly?
Examine the strikes on all of the above Christmas tree spreads. Consider the 1-3-2 structure, where “1” is the strike location where the single solo long call sits.
“3” is the middle strike where all three short calls are located.
And “2” is where the remaining two long calls reside.
The distance between the strikes from “1” to “3” is always longer than the distance between “3” to “2”.
It is typically twice as far apart.
This is the Christmas tree spread.
The Unbalanced Broken Wing Butterfly would be like this.
Buy two Mar 18 V $220 calls
Sell three Mar 18 V $230 calls
Buy one Mar 18 V $235 call
The distance between the strikes from “1” to “3” is shorter than the distance between the strikes from “3” to “2”.
The outcome of the payoff diagram is entirely different.
This looks like (and is) a broken-wing butterfly, and not a Christmas tree.
In Summary
At OptionsTradingIQ, we like to go deep with our articles.
My head is hurting just writing this.
I hope your head is not hurting reading this.
If it is, don’t worry.
The Christmas tree is an advanced spread and is not used in great frequency.
In brief, the Christmas tree spread behaves more like the symmetrical balanced butterfly than the broken wing butterfly.
It so closely mimics the balanced butterfly, that you can use the balanced butterfly for simplicity instead.
Here is a balanced butterfly:
Buy one Mar 18 V $220 call
Sell two Mar 18 V $230 calls
Buy one Mar 18 V $240 call
Debit: –$187.50
We get similar results using only four contracts instead of six contracts.
Delta: -2.20
Theta: 1.12
Vega: -5.48
Gamma: -0.21
We end the article with the resulting graph that looks like this.
You can compare it with the graph at the start of the article.
Trade safe!
Disclaimer: The information above is for educational purposes only and should not be treated as investment advice. The strategy presented would not be suitable for investors who are not familiar with exchange traded options. Any readers interested in this strategy should do their own research and seek advice from a licensed financial adviser.


