


Read Part 1 – The Basics
Read Part 2 – How To Set Profit Targets and Stop Losses
Read Part 3 – How To Successfully Leg Into A Butterfly
Read Part 4 – Trading Rules
Read Part 5 – Using Low Risk Directional Butterflies
Read Part 6 – The Greeks
Read Part 7 – Broken Wing Butterflies – One-Size Fits All
Today we’re going to look at the reverse butterfly.
Reverse butterflies are not an overly common trading strategy but they can have their place in certain environments.
Where you would normally enter a regular butterfly if you were expecting little movement in the underlying stock, a reverse butterfly option strategy is placed when a a large move is expected in the stock.
The right time to enter a trade like this would be if a stock has been trading sideways for several weeks and you are expecting a breakout but are unsure of the direction.
A reverse butterfly is constructed in the opposite way to a regular butterfly.
Instead of selling two at-the-money calls and buying the wings, you are buying the two at-the-money calls and selling the wings.
Sell 1 in-the-money call
Buy 2 at-the-money calls
Sell 1 out-of-the-money call
As with a regular butterfly, the wings are placed an equal distance from the middle strike.
Let’s look at an example from 2013 and then a more recent example after that:
SPX Reverse Butterfly Example
Date: July 30th 2013,
Current Price: $1691
Trade Details: SPX Reverse Butterfly
Sell 1 SPX Sept 19th $1660 call @ $46.90
Buy 2 SPX Sept 19th $1690 calls @ $27.95
Sell 1 SPX Sept 19th $1720 call @ $13.60
Premium: $460 Net Credit
Max Loss: $2,540
Stop Loss: 20% or $508
Breakeven Prices: $1664.60 and $1715.40
The breakeven prices can be calculated as follows:
Lower Breakeven Price = Lower Wing + Premium Received
1660 + 4.60 = 1664.60
and the upper breakeven price is:
Upper Breakeven Price = Upper Wing – Premium Received
1720 – 4.60 = 1715.40
Notice that this trade is entered for a net credit so we are receiving money when we place the trade unlike a regular butterfly.
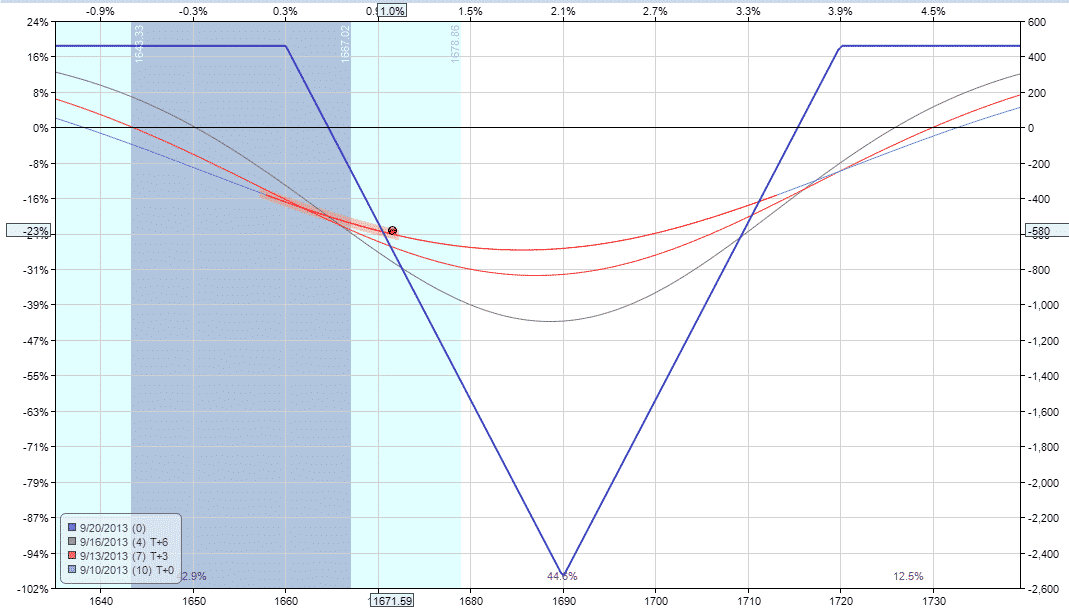
This net credit is also our maximum gain for the trade. Here is how the payoff diagram looks.

This diagram is the exact inverse of a regular butterfly.
The profit potential on the trade is $460 and the maximum loss is $2,540 for a potential return of +18.11%.
Notice that the breakeven points are at 1664.60 and 1715.40, so SPX only needs to move -1.85% or +1.16% for this trade to be profitable.
Over a 7 week period, it is very likely that the stock will move further than that.
If the stock does not move as expected, you would want to exit this trade well before expiry to avoid the maximum loss.
On a 7 week trade such as this one, if the stock has not moved past the breakeven points after 3 to 4 weeks you would want to exit.
A good profit target on this trade would be 10% but if the stock moves quickly outside the breakeven points, you could hold until expiry for a full profit.
Setting a stop loss of between 15-20% would also be advisable.
When this trade was entered, the VIX was at 13.39 which was on the low end of the recent 6 month range.
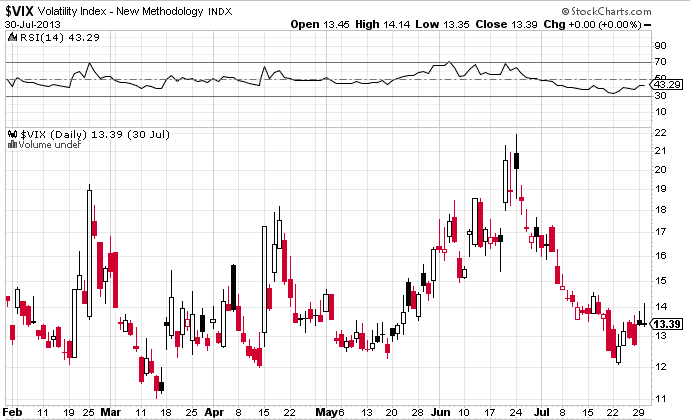
It’s best to enter this trade when volatility is low and that is generally the case when the stock has been moving sideways with small daily candles.
When volatility is low, the bought options are cheaper which allows you to achieve a better potential return on the trade.
A reverse butterfly spreads is a long vega trade, which is another reason why this trade should be entered when volatility is low and a rise in volatility is expected.
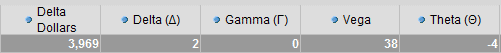
Let’s take a look at the greeks. You can see we are more or less delta neutral for now, but we still want a big move in the stock.
The trade is long vega as well, so a rise in volatility will be beneficial.
The reverse butterfly strategy is not a commonly used strategy, but they can have their place in a low volatility environment.
Stayed tuned for the next installment where we will be looking at using butterflies as part of a combination of strategies and also how to use them as a hedge for iron condors.
Let’s take a look at how the trade worked out.
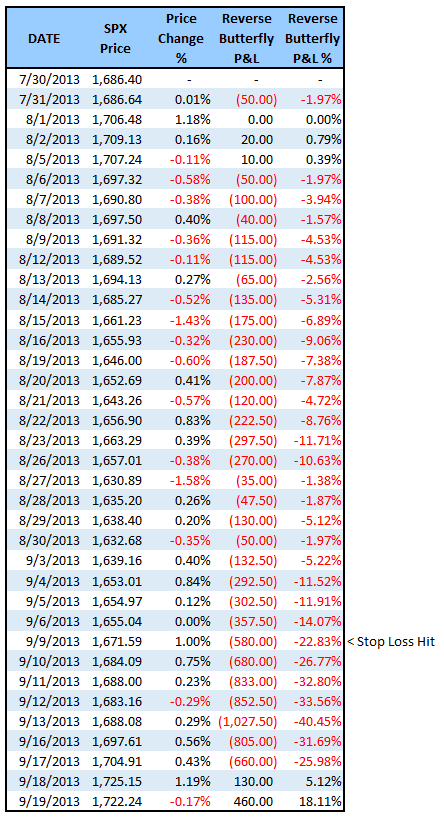
As you can see, the trade was under pressure almost from day 1 and while the trade would have ended in profit, the stop loss was hit on September 10th.
Let’s take a look at a more recent example from September 2020.
NFLX Reverse Butterfly Example
This is a trade I wrote about in my daily column on Investor’s Business Daily.
Date: September 14th 2020,
Current Price: $476.26
Trade Details: NFLX Reverse Butterfly
Sell 1 NFLX Oct 16th $460 call @ $44.75
Buy 2 NFLX Oct 16th $480 calls @ $33.65
Sell 1 NFLX Oct 16th $500 call @ $25.05
Premium: $250 Net Credit
Max Loss: $1,750
Stop Loss: 20% or $350
Breakeven Prices: $462.50 and $497.50
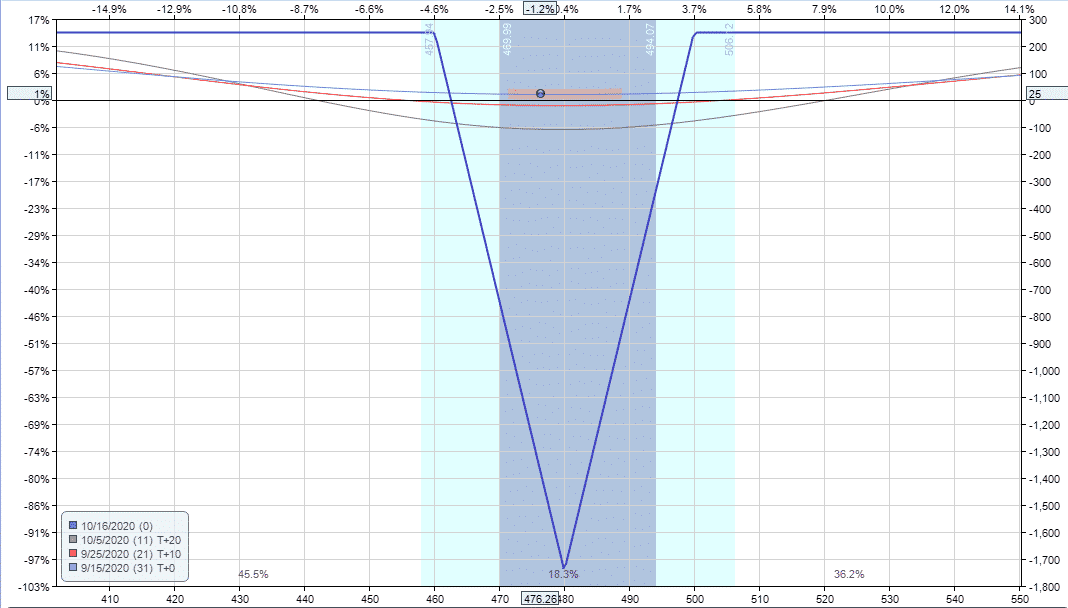
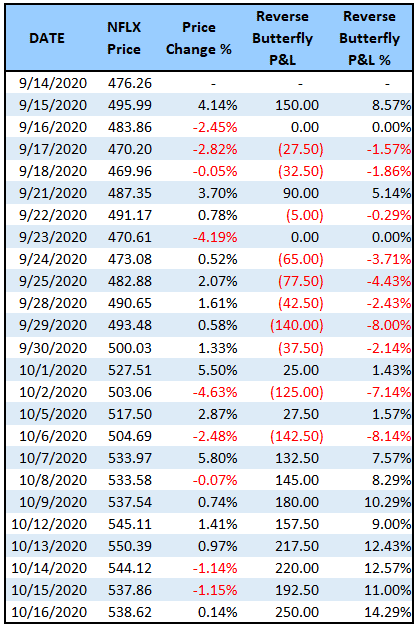
Below you can find a summary of how the trade progressed each day.
As you can see the, trade came under a little bit of pressure but was never down more than 8% and then ended up expiring with a full profit with NFLX stock price finishing outside the upper wing.
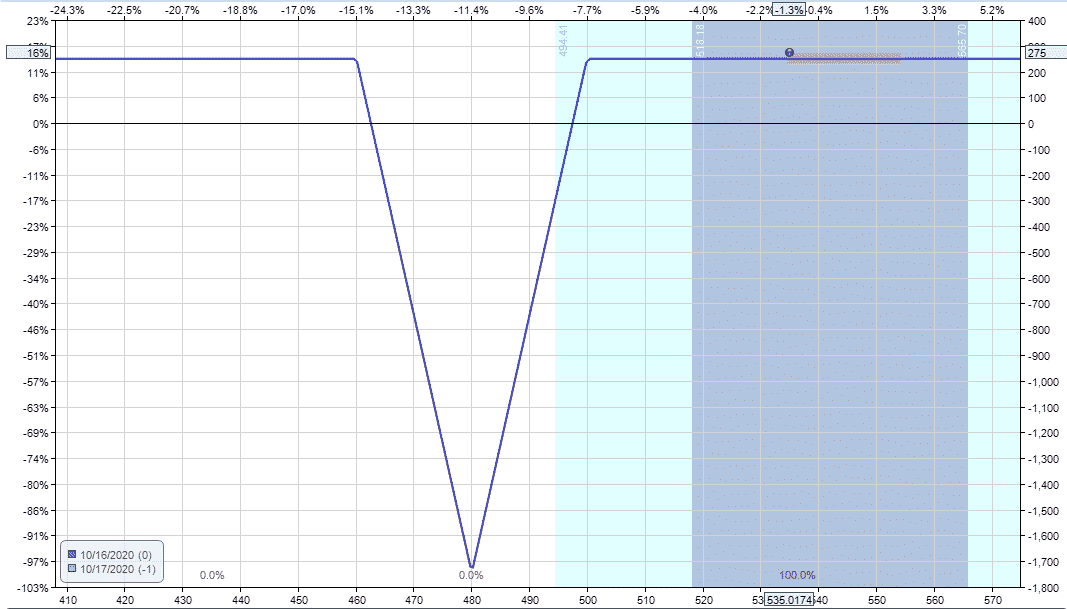
On the expiration date, traders could either trade out of the spread, or allow it to expire.
If allowing the trade to expire, there will be assignment costs involved, so it’s best to check with your broker how this would be handled.
Entry Criteria
You should now have a very solid understand of the reverse butterfly trade and how it works.
Here are a couple of my top tips when looking for reverse butterfly trade opportunities:
- Look for stocks that have traded in a tight range for around 4-5 weeks.
2. Look for stocks with tight Bollinger Bands
3. Look for stocks with a low implied volatility percentile.
And of course, you can reach out to me any time with questions. Good luck with your reverse butterflies!
Trade safe!
Part 9 – Using Butterflies In A Combination Or As A Hedge


Are there any resources to build out this strategy? I am trying to find more information I have been trading these on Friday’s as weekly’s on volatile equities. 100% win rate across 10 equities. I am looking for how to be conservative with the sizing and risk. As well as when to close these out when they are losing. Right now I close them when I am 1-2 days from expiration or if I hit 50% max profit.
Hi Michael, that’s a good plan and congrats on the winning trades. What sort of resources are you looking for?
Hi Gavin,
Thanks for all the amazing information. I still have a question on closing out the reverse butterfly. If on the expiration day the current price is far outside of my strikes, can I just leave them to expire worthless? Or do I have to close them out? I understand that if the current price is lower than my lowest strikes, and everything is OTM I could just leave them. But what if the price is higher than my highest strike? Should I close out in that case? Thank you very much!
If you’re using calls, yes you would want to close out the position to avoid early assignment on the short leg. Unless you are trading Index options which are cash settled, in that case just leave them to expiration.