


Read Part 1 – The Basics
Read Part 2 – How To Set Profit Targets and Stop Losses
Read Part 3 – How To Successfully Leg Into A Butterfly
Read Part 4 – Trading Rules
Using butterflies to make cheap directional bets is one of my favorite strategies, so I’m going to enjoy writing about this topic. So far we have only looked at the “traditional” way to trade butterflies which is as a neutral income trade. You can use butterflies in many ways, so let’s delve in to how you can use them to make low risk, high reward directional trades.
A traditional butterfly involves selling two at-the-money options. When using butterflies as a directional trade, we place the sold options out-of-the-money. A trader with a bullish bias would sell 2 out-of-the-money calls and a trader with a bearish bias would use puts.
Before we go further into specifics, let’s first consider the reasons why you might trade an out-of-the-money butterfly. The first reason is that it is a very cheap way to gain directional exposure, or hedge an existing portfolio or position. Let’s say you are bearish on SPY over the next few weeks and want to take a directional exposure. The most obvious way to do this would be to simply buy put options. The main problem with being long puts is that you suffer from large amounts of time decay. The stock needs to start moving down soon after you enter your trade otherwise the position starts to decay.
SPY is trading at $161.20 on July 1st, 2013 and you think it might decline to $155 over the next two weeks. You buy a July 19th $157 put for $0.89. Your risk is $89, your profit potential is unlimited and your breakeven price is $156.11.
Date: July 1st 2013,
Current Price: $161.20
Trade Details: SPY Long OTM Put
Buy 1 SPY July 19th $157 put @ $0.89
Premium: $89 Net Debit
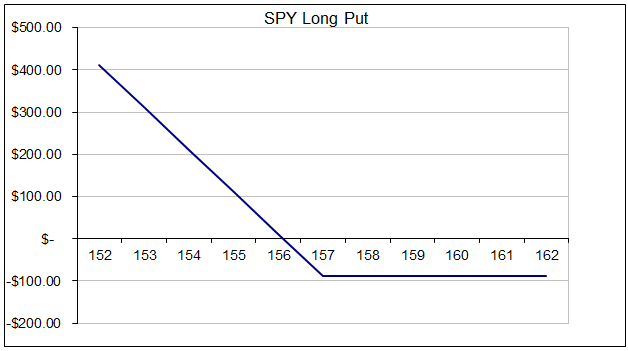
As you can see this position starts to make profits below $156.11, but you were only anticipating a fall to $157. Assuming your directional view is correct and SPY drops to around $157 over the two week period, a directional butterfly would be a much better choice both from a risk and reward perspective. Let’s analyze the trade:
Date: July 1st 2013,
Current Price: $161.20
Trade Details: SPY Bearish Butterfly
Buy 1 SPY July 19th $153 put @ $0.39
Sell 2 SPY July 19th $157 put @ $0.89
Buy 1 SPY July 19th $161 put @ $2.06
Premium: $67 Net Debit
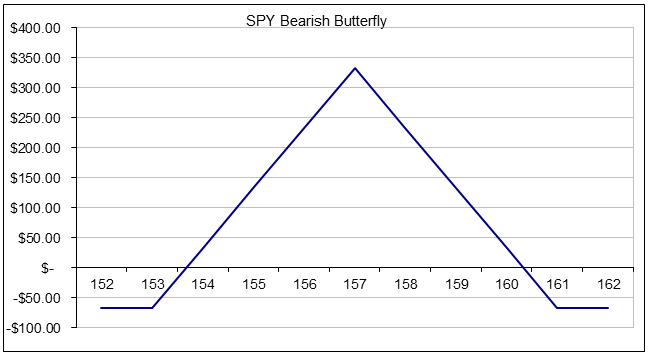
As you can see above, you are risking less capital, only $67 in this case, and looking at a nice return if SPY ends around $157. We know achieving the maximum return on a butterfly is unlikely, but it’s possible to make around a $200 gain if SPY close between $156 and $158.50. To make the same $200 gain, the long put would have to decline to around $154.
Risking $67 as opposed to $89 may not seem like a big difference, but for someone trading 10 contracts the difference would be $2,200 less capital at risk. That’s pretty significant if you ask me.
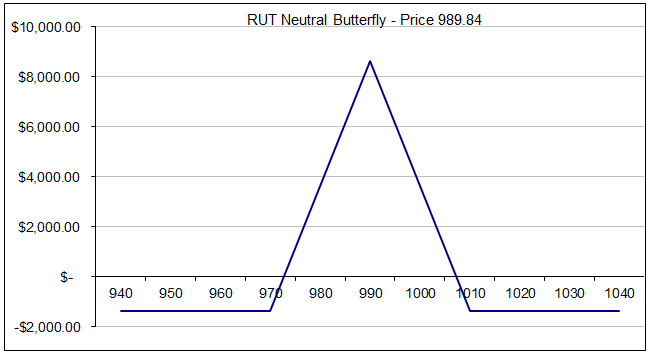
Let’s look at some further examples of directional butterflies, this time using RUT. First, let’s analyze a traditional neutral butterfly.
Date: July 1st 2013,
Current Price: $989
Trade Details: RUT Neutral Butterfly
Buy 5 RUT Aug 15th $970 call @ $36.45
Sell 10 RUT Aug 15th $990 call @ $23.90
Buy 5 RUT Aug 15th $1010 call @ $14.10
Premium: $1,375 Net Debit
Now let’s look at a RUT Bearish Butterfly:
Date: July 1st 2013,
Current Price: $989
Trade Details: RUT Bearish Butterfly
Buy 5 RUT Aug 15th $880 put @ $3.90
Sell 10 RUT Aug 15th $900 put @ $5.65
Buy 5 RUT Aug 15th $920 put @ $8.15
Premium: $375 Net Debit
![]()
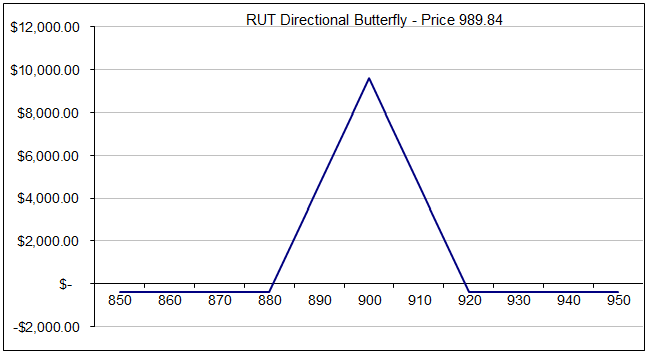
Looking at the payoff graph above, you can see that this is a very attractive trade from a risk reward standpoint. Risking $375 to (theoretically) make nearly $10,000 is a good deal to me. Of course, RUT would have to drop around 10% for that to happen, but you can’t argue with the risk reward ratio. This type of trade is great to put on at the end of a long bull run when you think the market is due for a correction, or you can use it as a very low cost way to insure a portfolio of stocks.
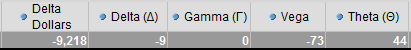
There are a couple of other things to take note of here. The Vega on the bearish butterfly is positive, whereas with a traditional butterfly it is negative. Also Theta is negative, so time decay is working against you in this strategy. Hopefully it’s obvious, but you are not using this as an income trade which is what butterflies are typically used for.
Lastly, let’s look at a directional butterfly using out-of-the-money calls for a bullish trade:
Date: July 1st 2013,
Current Price: $989
Trade Details: RUT Bullish Butterfly
Buy 5 RUT Aug 15th $1030 call @ $7.20
Sell 10 RUT Aug 15th $1050 call @ $3.05
Buy 5 RUT Aug 15th $1070 call @ $1.20
Premium: $1,150 Net Debit
![]()
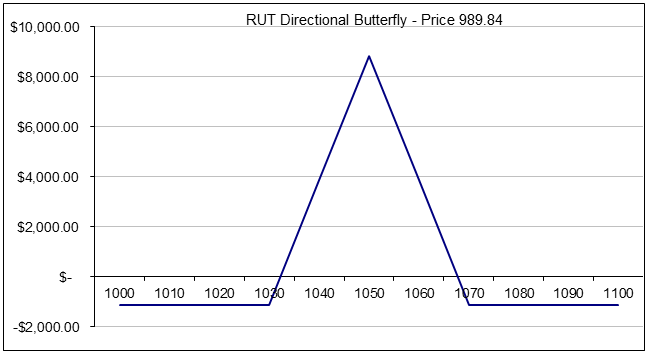
Here again, you can see a pretty favorable risk reward ratio, but the trade is much more expensive than the bearish butterfly, in fact it is not that much cheaper than the neutral butterfly. There are two reasons for this, firstly put options are skewed due to the fact that markets tend to fall faster than they rise. As such, out-of-the-money puts are more evenly priced compared to the calls. Once you start to go deep out-of-the-money with the calls, those options have very little value. You can see this in the option prices of the bullish and bearish butterflies. The put strikes were traded at much more even prices – $8.15, $5.65 and $3.90. The calls were traded at a much greater variance – $7.20, $3.05 and $1.20. The second reason is that the bullish butterfly is not as far out-of-the-money as the bearish butterfly. The sold puts are $90 below the price and the calls are only $60 above. The reason for this is I wanted to have a similar delta (i.e. similar probability) of the short strikes for both the puts and calls. The delta of the short $900 puts was -0.12 and the short $1050 calls was 0.12.
A FEW THINGS TO KEEP IN MIND
Directional butterflies might be completely new to you, so let’s go over some things to keep in mind before you dive in.
Butterflies are a net debit trade so we want to be paying as little as possible. You have to weigh up the cost of the butterfly with how far you expect the stock to move. The further out-of-the-money you go, the cheaper the trade will be, but the less likely that the stock will end near your sold options. You can use delta as a guide such as I did here, you can look at support and resistance levels or use a standard deviation measurement.
Short term trades are great with this strategy. I generally don’t advocate trading weekly options, but in this case, directional butterflies using weekly options are a great way to get leverage on your directional opinion. I find around 15 days is a good sweet spot, but you can still go further out in time such as I did with RUT above.
Set a price target for the stock and structure your butterfly with the short strikes at that level. Try to think about where the market has the potential to go. Could it move 5% in a week? 10% in a month?
You might find this strange to hear, but Theta and Vega are not overly important in this trading strategy. The Neutral RUT butterfly has Vega of -73 and Theta of 44, but the directional trades were 18, -4 and 33, -11 so the exposure to these greeks is much less of a factor with directional butterflies.
Given that you are risking such a small amount of capital, you can accept a greater loss than you usually would for a traditional butterfly. For example with the RUT Bearish Butterfly only requiring $375 of capital, I would be willing to accept up to a 50% loss on the position.
It can make sense to hold these position until closer to expiry than you normally would with a traditional butterfly. The leverage is what we’re after here, so it makes sense to hold out for that big winner given we only have a small amount of capital at stake.
Unlike other directional trades, a large move in the opposite direction early in this trade will not have dire consequences. Compare that with a long put or long call which can be decimated by an adverse directional move.
If your stock rises (or falls) too much, you can roll up (down) the credit spread and still stay in the trade.
Using short term directional butterflies can be a great way to hedge a credit spread or iron condor that is under pressure while allowing you to remain in the trade.
Trading a butterfly in this manner is a directional trade, you still need to stock to move in the direction of your sold options in order to be profitable. The benefit of this type of trade is that the cost of being wrong is minimal.
That’s it for today, so what do you think? Will you be trying out some low cost directional butterflies? Let me know in the comments below.


I set up 4 directional butterflies for AMZN with an expiration at the end of July. I bought 4 calls at 465, sold 8 calls at 475 and bought 4 calls at 485. I also put in a sell order to sell the contracts if the stock reached 475.
I checked today and the contracts were still active. I talked to a broker and he said that the only time I would make money is if the stock was at 475 AT EXPIRATION. I have read several explanations about butterflies and I don’t recall reading about how the sold calls have to be at a specified value at expiration to make the maximum value.
I was under the impression that whenever the sold calls were at a specified value (in my case, 475) the butterfly spread would be at maximum value. So in this case, you have to pick not only the proper sold call value but this has to occur at expiration. Is this correct?
To achieve the maximum profit, yes the stock has to be at 475 at expiry. Even 4-5 hours before expiry, if the stock is at 475, you will not be able to close it out for max profit. However, this statement ” I talked to a broker and he said that the only time I would make money is if the stock was at 475 AT EXPIRATION” is incorrect. If the stock is in your zone and there has been time decay or a drop in volatility, you will achieve a profit (just not the max profit).
Let me know if you need anything else.
Broker is right , we will not get max profit if 4 to 5 hours are left on expiry day , because the sold calls will not become zero until 4 pm on expiry day.
Gavin, Thank you for offering this valuable information about how to actually structure proper trades. Your explanations are the best I have ever seen and believe me I have seen a lot. One question I have is: How does one determine the 10 to 15% profit exit number. Is it the percentage of the Max (Peak) profit? Thanks again for your help!
Hi Jim, Thank you for the kind feedback, very nice to hear. I would take the 10-15% as a percentage of capital at risk, rather than the total potential profit. Particularly with a butterfly trade.
There might be other strategies such as a short strangle where it would be better to take % of total profit potential. Hope that helps.
Gav.