
Today, in Part 2 of the Butterfly Course, we will get into some more juicy details, specifically how to enter trades in your brokerage account, how to set profit targets and stop losses and how to choose strike widths. Let’s get stuck in to it.
Entering Trades In Your Brokerage Account
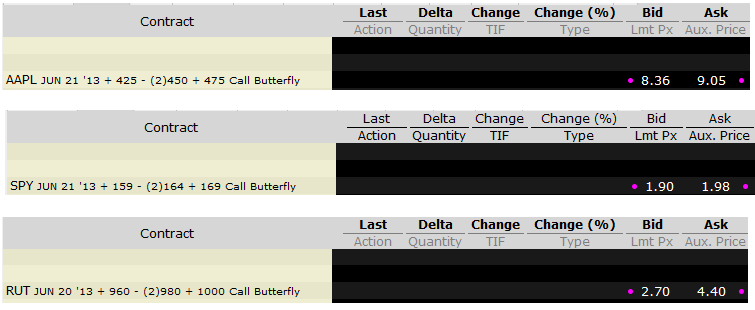
The easiest way for beginners to enter a butterfly is to create a single order in your broker’s option trader module. However, butterflies can be tricky to get filled on when entering as one order. In addition, the bid-ask spreads can be quite wide depending on the underlying stock that you are trading. You can see below, 3 separate butterfly spreads. SPY being the most liquid of the 3 has the tightest of the 3 spreads with only $0.08 between the bid and the ask. AAPL is has a slightly higher spread on both a dollar and percentage basis with a spread of $0.69. RUT is the least liquid of all with a massive difference between the bid and ask prices on both a percentage and dollar basis. The dollar spread of $1.70 is very high; you might be able to get filled close to the mid-point, but you run the risk of some slippage here if you are looking to trade butterflies on RUT. Definitely something to keep in mind.

Entering Butterflies As A Debit Spread And A Credit Spread
If you’re having trouble getting filled on you single butterfly order, or you don’t like the look of those bid-ask spreads, another way to enter your butterfly is as a debit spread and a credit spread. After all, that’s all a butterfly is – a combination of a debit spread and credit spread.
Looking at our AAPL example, you would buy 1 AAPL June 21 $425 – $450 debit spread and sell 1 AAPL June 21 $450 – $475 credit spread. You’re looking at a bid-ask spread of $0.40 on the debit spread and $0.16 on the credit spread. The total spread is less than our butterfly trade ($0.56 v $0.69). You will also find it easier to get filled on two vertical spreads rather than one butterfly spread.

The SPY spreads are fairly similar which makes sense given the huge levels of liquidity. Trading the two vertical spreads has a total bid-ask spread of $0.09 compared to the single butterfly order at $0.08.

The bid-ask spread on RUT is similar to AAPL in that it is slightly lower when entering at two vertical spreads – $1.50 v $1.70. So for RUT you will find it easier getting filled using the two vertical spread method.

When starting out with butterfly trades, it might be prudent to start trading highly liquid stocks and ETF’s. SPY is one of the most liquid instruments in the world, so this would be a good place to start for your butterfly trades. Try entering your trades via the two methods presented above and see which method is easier to get filled. Once you become familiar and confident with entering the trades and getting filled, you can then move on to trading other instruments and trading different variations of the butterfly which we will discuss shortly.
How to Set Profit Targets and Stop Losses
When trading butterflies it is easy to get caught up in the hope (a very dangerous word in the stock market) of achieving the full profit as shown in the payoff diagram. As mentioned previously, it is extremely unlikely that you will achieve the full profit potential on a butterfly trade. A good aim for a butterfly trade is a 15-20% return on capital at risk and the maximum acceptable loss should also be around the 15-20% level. As with most income strategies you need to make sure when you have a losing trade, you are not losing much more than the typical gain you are making from your winning trades. Typically you should set a hard stop loss at 1.5 times the average gain. So if you are generally making 15% on your butterflies, your maximum loss on any trade should be around 20-25%.
When taking profits, you can also set time based rules for taking profits. For example, if you have made 10% within 10 days of opening a 35 day trade, that might be a really good place to take profits even though your initial target was 15%. Achieving a healthy 10% return that early in a trade is a great thing and sometimes it’s best to just say “thank you very much” and wait for the next opportunity.
How to Choose Butterfly Strike Widths
Where you place your wings (which are the bought options in a butterfly spread), is a matter of personal preference and will also depend on which instrument you are trading. How far apart you place the wings, will determine how “fat” or “skinny” your butterfly payoff diagram looks. Spreading the strikes out a long way can increase the profit potential and move the breakeven points in your favor, but it comes with the cost of having to allocate more capital to the trade.
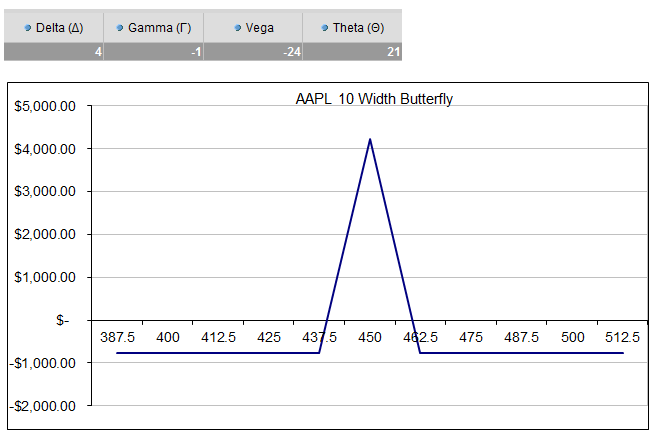
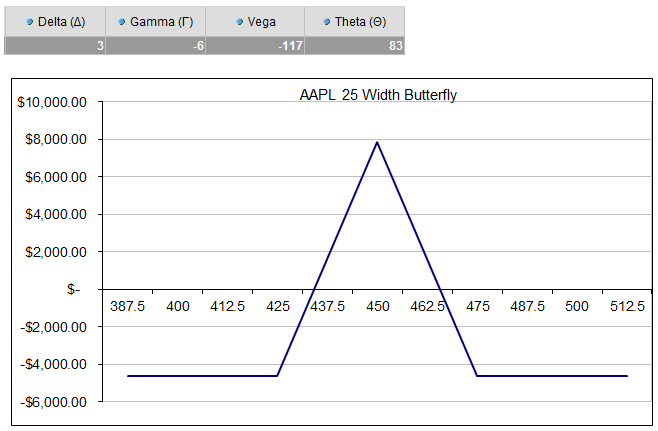
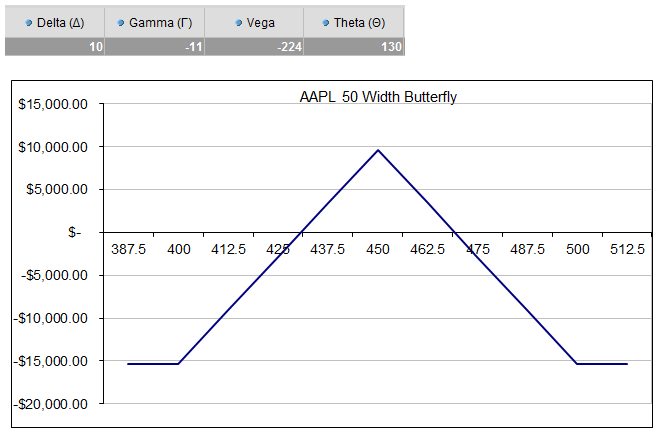
Let’s take AAPL for example. In the following three diagrams, you will see three different butterfly trades for the same expiration date, all centered around the at-the-money strike of $450. First we’ll look at a trade with 10 point wide wings, then 25 points and then 50 points.
AAPL 10 POINT WIDE BUTTERFLY
Date: June 4, 2013
Current Price: $446
Trade Set Up:
Buy 5 AAPL June 20th, 440 calls @ $16.00
Sell 10 AAPL June 20th, 450 calls @ $10.25
Buy 5 AAPL June 20th, 460 calls @ $6.05
Premium: $775 Net Debit.

AAPL 25 POINT WIDE BUTTERFLY
Date: June 4, 2013
Current Price: $446
Trade Set Up:
Buy 5 AAPL June 20th, 425 calls @ $27.50
Sell 10 AAPL June 20th, 450 calls @ $10.25
Buy 5 AAPL June 20th, 475 calls @ $2.44
Premium: $4,620 Net Debit.

AAPL 50 POINT WIDE BUTTERFLY
Date: June 4, 2013
Current Price: $446
Trade Set Up:
Buy 5 AAPL June 20th, 400 calls @ $50.90
Sell 10 AAPL June 20th, 450 calls @ $10.35
Buy 5 AAPL June 20th, 500 calls @ $0.49
Premium: $15,345 Net Debit.

Rather than discuss the three variations individually, I feel it’s best to present some of the key information in table format so we can compare.

Looking at the above table, you can see that there are some obvious differences between the three variations. All of them are more or less delta neutral, the 50 width butterfly has a slightly higher delta, but it’s still fairly neutral. The big differences come in when you look at the capital at risk (max loss), the potential return and the Theta-Vega exposure.
The narrower butterflies require much less capital and therefore have a lower maximum loss. The potential maximum gain compared to the maximum loss is much higher for the narrow butterflies. The trade off with this is that the wider butterflies have a much higher range and therefore likelihood of profit.
The Vega exposure is another key difference; you can see that the 50 width butterfly has a Vega exposure that is 10 times higher than the 10 width butterfly. If you have a strong view that implied volatility is going to fall, you are potentially better off trading the 50 width butterfly.
The Theta to Vega ratio for the 10 width butterfly is almost one to one whereas the ratio for the 50 width butterfly is just over 50%. A higher Theta to Vega ratio gives you more capacity to withstand rising volatility. An as example, if volatility increases 1 percent on day one of the trade, the 10 width butterfly with lose around $24, but will gain around $21 in Theta decay which basically offsets the loss from increased volatility. The 50 width butterfly will lose $224 dollars from Vega and only gain $130 from Theta decay.
Based on the all of the information presented above, I think the 25 width butterflies present the best scenario.
USING STANDARD DEVIATION TO SELECT BUTTERFLY WINGS
Another consideration on where to place the wings is to see what a one standard deviation move in the underlying instrument would look like. To calculate one standard deviation you take price x volatility x the square root of the days to expiry / 365. If that formula seems complex, don’t worry, I’ve created a simple to use spreadsheet which you can download from https://optionstradingiq.com/standard-deviation-calculator/.
While the stock market is filled with statistical anomalies, generally a stock will stay with a range of plus or minus one standard deviation about 68% of the time. So if you place your wings around one standard deviation away from the current price, you will have a winning trade roughly 2 times out of every 3. Of course, nothing is guaranteed in the stock market!
Using the AAPL example above and my standard deviation calculator, you can see that a one standard deviation move over the course of this trade would put AAPL at either $472 or $420, so our 25 point wide butterfly looks like a good option, or we could even stretch that out to 30 points in order to get our strikes around the one standard deviation mark.

There’s a lot of information to digest in today’s lesson, go back and read everything again if you feel you need to. In the next lesson, we’ll look at a couple of different methods for legging into butterflies to increase profits.


Hello.
I like this article.
Can you put here formula to calculate butterfly wings?
I am very bad with excel.
Best regards.
Hi Daniel,
See if this excel file helps you:
https://optionstradingiq.com/wp-content/uploads/Book4.xlsx
Gav.
Fantastic content Gav! I feel so inspired! Can’t wait to start operating, and earning some bucks to attend your seminars!
I’m sure they’re worth while!
Thanks for the kind words!