

Read Part 1 – The Basics
Read Part 2 – How To Set Profit Targets and Stop Losses
Read Part 3 – How To Successfully Leg Into A Butterfly
Read Part 4 – Trading Rules
Read Part 5 – Using Low Risk Directional Butterflies
Read Part 6 – The Greeks
Today we’re looking at the “one-size fits all” strategy that is broken wing butterflies.
Along with directional butterflies, broken wing butterflies are one of my favorite strategies. How would you like a trade that provides income if a stock goes one way, and capital gains if it goes the other way? That’s the potential you have with broken wing butterflies.
A broken wing butterfly is sometimes referred to as a “skip-strike” butterfly and you will understand why once you see the trade setup. A regular butterfly has the bought options an equal distance from the sold options, whereas a broken wing butterfly will skip a strike on one side of the trade. This reduces the cost and in some cases will actually result in a net credit meaning you can use it as an income trade.
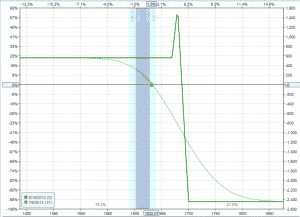
The other way to think about broken wing butterflies is that they are simply an out-of-the-money credit spread, protected by a slightly narrower, closer to the money debit spread. This is what the payoff diagram looks like:
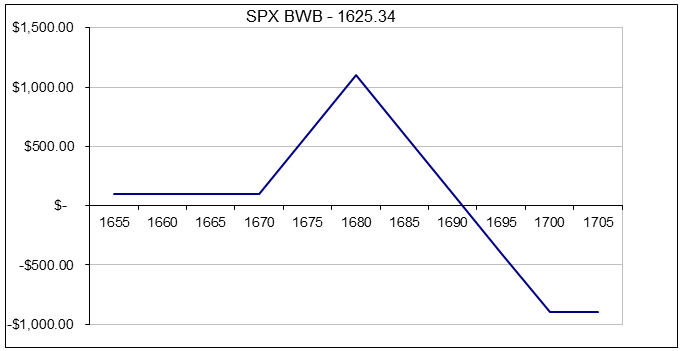
Note that there is a (albeit small) income portion to this trade if SPX stays below 1670 and the typical butterfly profit zone located between 1670 and 1690. The drawback with this trade is the increased risk on the upside, but keep in mind the index has to go through the profit zone before entering this danger area. Ideally you want the index to slowly drift up into the profit zone and expire around 1680. However, you also don’t mind if the index drops in which case you would just let the entire trade expire worthless and bank the income portion of the trade.
The above example is using SPX and assumes you are slightly bearish due to some overhead resistance, but are concerned that momentum may carry the index slightly higher. The income portion of the trade is $100 and the risk is $900 which is an 11.11% return. Not bad considering you will make this return if the stock:
– Moves lower
– Stays flat
– Rises by less than 2.75%
Let’s not forget you also have the potential to make a large gain within the profit zone. The upper breakeven point of the profit zone is around 4% higher than the current index price so you have a reasonable margin for error. The best time to make these types of trades is at the end of a long bull run, where the stock or index is almost exhausted, but could potentially muster another 2-3% rally. If that happens, you are in the profit zone. If the stock reverts to the mean, you bank the income portion.
Hopefully you can now see why I love this trade. Here is how the above SPX trade was set up:
Date: July 5th 2013,
Current Price: $1624
Trade Details:
Buy 1 SPX Aug 15th $1670 call @ $9.85
Sell 2 SPX Aug 15th $1680 calls @ $7.25
Buy 1 SPX Aug 15th $1700 call @ $3.65
Premium: $100 Net Credit
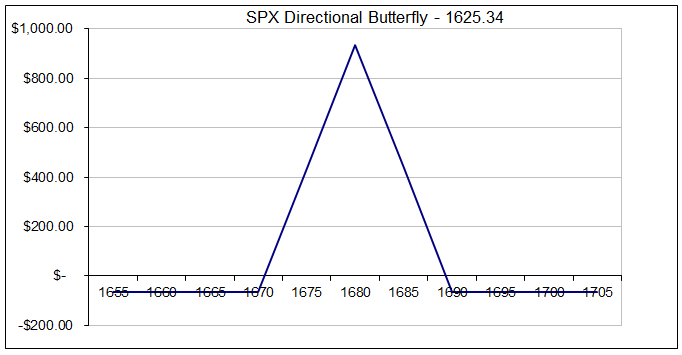
Let’s take a look at the same idea but using a standard butterfly. Instead of buying the 1700 call for $3.65, this time we are buying the 1690 call for $5.30. The increased cost of the 1690 call results in a net debit for the trade, albeit only a small one.
Date: July 5th 2013,
Current Price: $1624
Trade Details:
Buy 1 SPX Aug 15th $1670 call @ $9.85
Sell 2 SPX Aug 15th $1680 calls @ $7.25
Buy 1 SPX Aug 15th $1690 call @ $5.30
Premium: $65 Net Debit
You might be able to better visualize the different trade setups using this table below
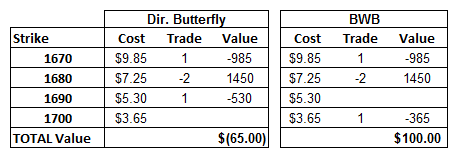
With the directional butterfly you risk the prospect of full capital loss anywhere below 1670 or above 1690. With the broken wing butterfly, you profit anywhere below 1690, so the probability of success is significantly higher.
The broken wing butterfly also turns the trade into more of a bearish trade as you will see from the option greeks.

VARIATION – UNBALANCED BROKEN WING BUTTERFLIES
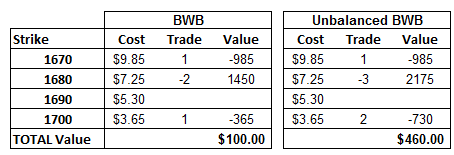
Aggressive traders can use the features of a broken wing butterfly and take them to the next level by trading an unbalanced broken wing butterfly. The idea is that you have your regular broken wing butterfly and then add extra short vertical spreads. You could also call this a ratio spread with out-of-the-money protection.
This type of trade increases the income potential, but also increases the risk, which is why I mentioned that it is more suitable for aggressive traders.
Using our SPX example, we can increase the income potential to $460, the trade-off being an increase in capital at risk to $2540. Still that is an increase in the income portion of the trade from 11.11% to 20%. Here’s how you would set up the trade:
Date: July 5th 2013,
Current Price: $1624
Trade Details:
Buy 1 SPX Aug 15th $1670 call @ $9.85
Sell 3 SPX Aug 15th $1680 calls @ $7.25
Buy 2 SPX Aug 15th $1700 call @ $3.65
Premium: $460 Net Credit
The unbalanced broken wing butterfly becomes more of a directional trade than the other two as you can see from the greeks below. You still get the nice profit zone on the upside if the stock continues to rise, but this trade is much more bearish due to the negative delta.

With the unbalanced broken wing butterfly, all of the greeks are significantly higher than the other two trades. Still it’s a great strategy but it might take some getting used to. You can read more about this strategy online at the Futures Magazine.
We covered some pretty difficult concepts here, so if you have any questions, please drop me a line.


I saw an interesting video about an out of the money broken wing butterfly using puts. The trade was on the SPY. The short strike was 5% out of the money from the market and several strikes were skipped between each of the legs on each side of the short strike. There was a 15 point difference between each strike
The trade was put on with a credit, but I think it can be done with a debit as well.
Is there a for a formula to determine max profit and loss?
I know this is complicated but if you can answer I certainly appreciate it.
Thanks
Hi Jack,
I believe this will work in most cases for standard BWB’s:
Max income = credit received (could be a loss if the trade is a debit)
Max profit = Distance between close to the money option and short option plus premium received (paid)
Max loss = Distance between close to the money option and short option less premium received (paid)
Let me know if that helps.
G.
Hi Gav, You have given some information in your blog about unbalanced broken wing butterfly. But I couldn’t find exact link formore information in futures magazine. Can you please, send the exact URL for the same.
Thanks,
Here is the link:
http://www.futuresmag.com/2011/04/19/ride-bullish-trends-unbalanced-broken-wing-butterfly-options
Where can I find adjustments on BWB and UBWB?
Hi Robert, I don’t have any articles on that topic yet. Will add it to my list.
Hi gav,
Is it possible for you to share the payoff graph for UBWB??
Added now.