


The Buffett indicator, also known as the Buffet Index or Buffet Ratio, is named after Warren Buffet, the well-known value investor and CEO of Berkshire Hathaway.
Contents
The Buffett indicator measures the valuation of the U.S. stock market in relation to the United States gross domestic product.
In a sense, it tells us whether the stock market is overvalued or undervalued.
Why Is the Buffett Indicator Named After Warren Buffett?
According to Wikipedia, this measure was proposed by Warren Buffett in 2001, and he was quoted as saying that it is “probably the best single measure of where valuations stand at any given moment.”
Buffett might have believed it at the time he said it.
But whether he still considers this true today is difficult to know.
So, people started calling the indicator after his name.
It is anyone’s guess (except for Buffett himself) to know whether he wants this indicator to bear his name or not. In any case, the name stuck.
This indicator fits his investment style, in which he constantly evaluates whether his investments are overvalued or undervalued.
How Is The Buffett Indicator Calculated?
The Buffett indicator is the total U.S. stock market value divided by the annualized gross domestic product (GDP).
The Wilshire 5000 is commonly used to indicate the aggregate value of the U.S. stock market.
The GDP is defined as the actual annual production of the U.S. economy.
If you consider the stock market to be the expected future economic growth, then the ratio can be considered a ratio of expectation over actual.
Some consider it analogous to a stock’s Price-to-Earnings (P/E) ratio.
The price is people’s expectations, and E is the company’s earnings.
Where Can We Find the Chart of the Buffett Indicator?
One such place is the Current Market Valuation, which tracks various economic models that determine the current state of the U.S. stock market and the broader economy.
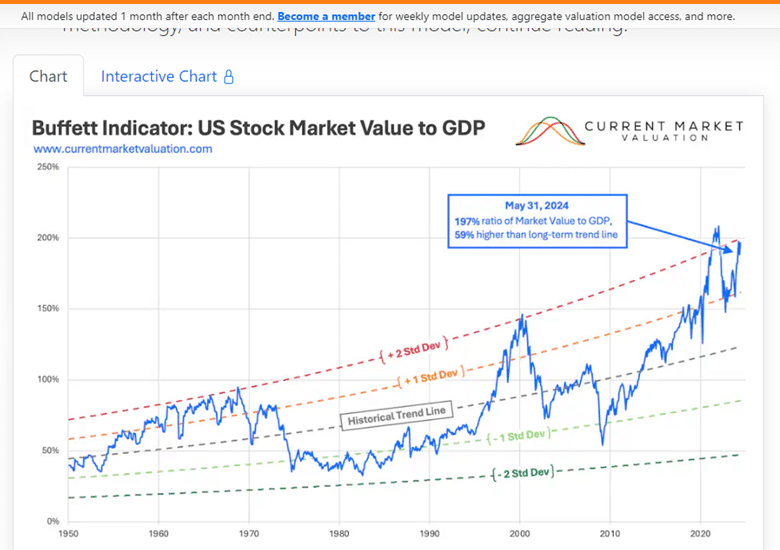
According to that resource, the total U.S. stock market value is 55.81 trillion dollars, and the GDP is $28.38 trillion as of May 31, 2024.
If you divide the two, you get 1.97. Expressed as a percentage, it is 197% as of May 31, 2024.
The stock market is about twice as big as the United States GDP right now.
It has nice graphs which show the current valuation over time:
The word “current” needs to be taken loosely.
The free version shows delayed data updated one month after each month’s end.
Considering that this chart goes back to 1950, one month is just a tiny blip on this chart.
For more frequently updated data, you need to pay for membership.
The membership includes access to an interactive version of the chart.
As you can see, this ratio is near the all-time high and is two standard deviations above the historical trend line.
It is safe to say that according to the Buffett indicator, the stock market is currently overvalued.
At the height of the Internet Bubble in 2000, the ratio reached two standard deviations above the norm.
Then, the bubble burst, with the market bottoming at -1.5 standard deviations in the years 2008 and 2009 of the Financial Crisis.
What Happens When The Stock Market Is Overvalued?
Looking at the graph, every time the valuation hits two standard deviations above the norm, it eventually returns to the historical trend line.
It may not happen right away, and it may take ten years, but eventually it does.
Final Thoughts
The Buffett Indicator is a more suitable metric for a longer-term view.
Shorter-term traders may not be too concerned with its value for day-to-day trading.
Nevertheless, it is interesting to know how big the stock market is getting in relation to GDP.
We hope you enjoyed this article on the Buffett indicator.
If you have any questions, please send an email or leave a comment below.
Trade safe!
Disclaimer: The information above is for educational purposes only and should not be treated as investment advice. The strategy presented would not be suitable for investors who are not familiar with exchange traded options. Any readers interested in this strategy should do their own research and seek advice from a licensed financial adviser.


