


What is the Bull Bear Indicator?
This is the question.
You will not find this indicator on any charting platform.
You cannot see what its value is at any given time.
This is because it is Bank of America’s proprietary sentiment indicator.
Interestingly, you don’t hear much of Bank of America reporting on their indicator.
Instead, you have external media headlining their indicator.
For example, on July 19, 2022, Fortune published an article titled BofA warns investor pessimism is at dire levels with Bull & Bear indicator in the ‘max bearish’ zone.
Contents
Contrarian Indicator
The indicator gives values from 0 to 10, which zero being maximum bearishness and 10 being maximum bullishness.
Contrarian investors use the indicator to note when the market is so bearish (or oversold) that it is time to buy.
A value below 2 is a buy signal.
A value above 8 is a sell signal.
This reminds us of the aphorism “It’s so bearish, I’m bullish,” and Warren Buffett saying, “Be fearful when others are greedy and greedy when others are fearful.”
A zero reading from the indicator shows that market participants are fearful.
Max Bearishness for 12 weeks
On August 12, 2022, Bloomberg said that the Bank of America Bull Bear indicator has remained bearish for the ninth week, as referenced in their article: BofA Says Cash Racing to Stocks, Bonds as Inflation Fears Ease.
Earlier in the previous month, in July 2022, Investing.com said that BofA Bull and Bear Indicator is at ‘Maximum Bearish’ for a Third Week in a Row.
It was only in September 2022 that The Economic Times mentioned that BofA Bull & Bear indicator rose above zero for the 1st time in nearly 3 months.
Based on these various reports, it can be determined that the Bull Bear indicator was at zero from June 14, 2022, to September 2, 2022, which is almost 12 weeks.
The chart of the S&P500 index (SPX) looked like this at the time.
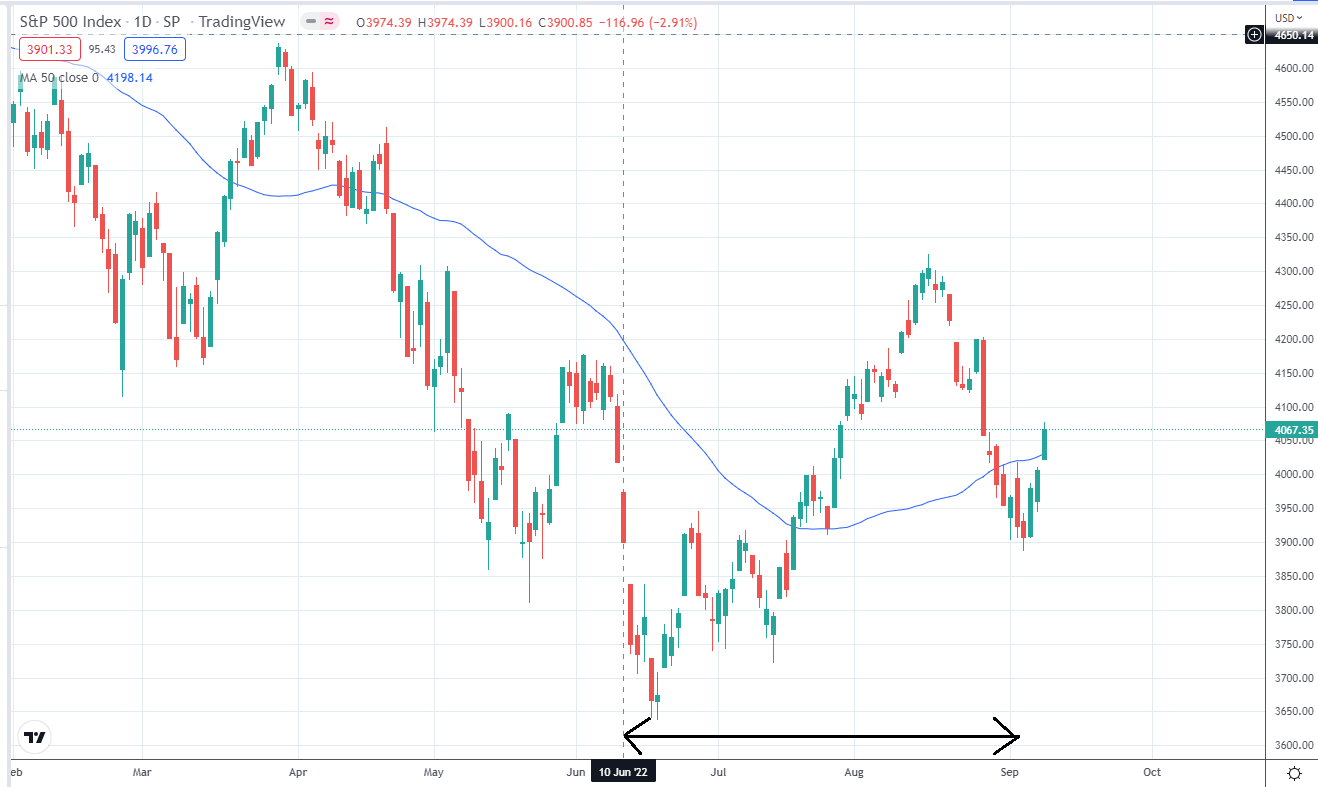
source: tradingview.com
FAQs
Does the Bull Bear Indicator work?
In order to determine how well an indicator works, we need to see its historical values and what the market did afterward.
The only historical chart of the indicator I could find was seen on CNBC Television when Jared Woodard of Bank of America Merrill Lynch Global Research said that the Bull Bear indicator is indeed a contrarian indicator.
It is a broad measure of investor sentiment with 18 different inputs measuring fund flows to price action.
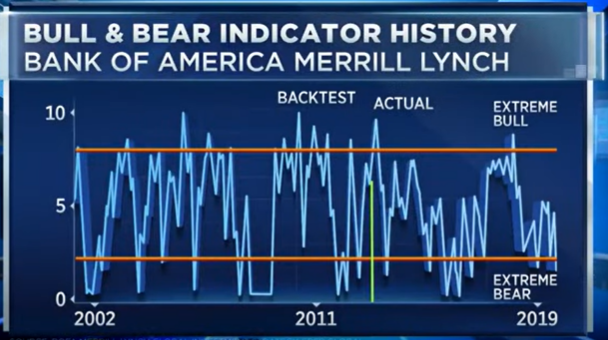
source: CNBC Television YouTube
The reference to Merril Lynch suggests that the indicator came from Merril Lynch prior to Bank of America buying Merril Lynch in 2008.
The video was published on September 3, 2019, when the indicator showed a value of 1.3.
Woodard said that based on history, this is a good time for investors to buy risky assets such as stocks and commodities on the one to three-month time horizon.
Let’s see how investors would have done if they had bought in early September 2019.
A three-month time horizon would mean the rest of the 2019 calendar year.
As you can see from the price of SPX during that time period, investors would have done quite well.
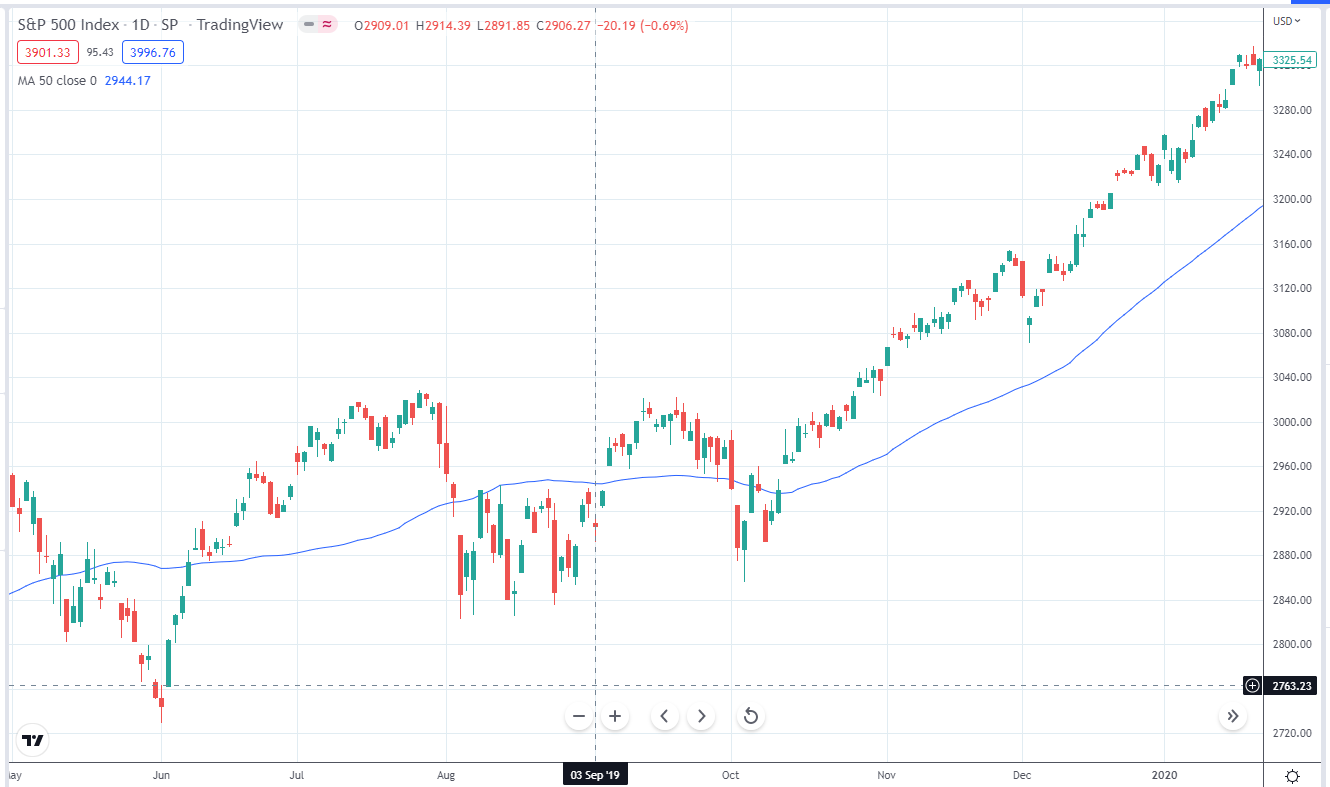
source: tradingview.com
So to answer the question, “Does it work?”… Well, it did this time.
Bank of American Merrill Lynch said that of the 11 sell signals from April 2000 to March 2013, all 11 were correct in that the market dropped in the one-month to three-month timeframes.
To dig deeper into this claim, see articles from CNBC and Seeking Alpha.
When did the Bull Bear indicator come into existence?
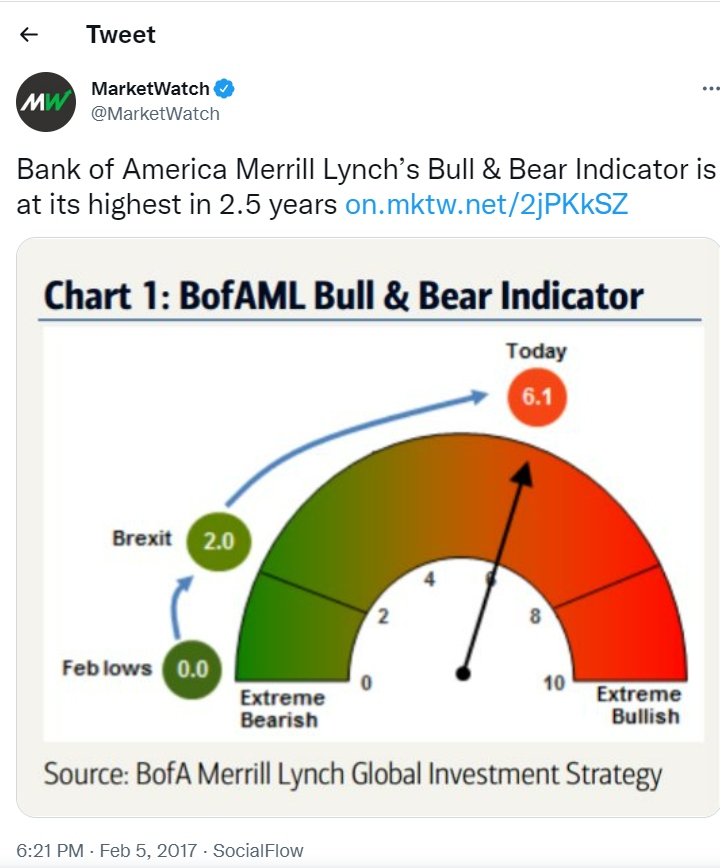
MarketWatch had tweeted about it back in February 2017.
CNBC says that Bank of America Merrill Lynch has been tracking its reading since 2002.
Is the Bull Bear indicator the same as the Bull Bear Power indicator?
The Bull and Bear sentiment indicator by Bank of America is not to be confused with the Bull Bear Power indicator.
The Bull and Bear Power indicator, or sometimes the two indicators “Bull Power” and “Bear Power,” is an indicator based on the Elder-Ray index, a technique developed by Dr. Alexander Elder to measure buying and selling pressure.
Is the Bull Bear indicator the same as Bull Bear Ratio?
While they both measure market sentiment, the Bull Bear Ratio is different and is by Investor Intelligence polls market professionals to determine sentiment.
Conclusion
While Bank of America’s Bull Bear sentiment indicator may be quite sophisticated and has existed for a long time, it is not accessible to retail investors.
Instead, the retail investor relies on financial media to report on its reading.
At least now, when you hear the Bull Bear indicator in said media, then you will know what they are referring to.
We hope you enjoyed this article on the Bull Bear Indicator. If you have any questions, please send an email or leave a comment below
Trade safe!
Disclaimer: The information above is for educational purposes only and should not be treated as investment advice. The strategy presented would not be suitable for investors who are not familiar with exchange traded options. Any readers interested in this strategy should do their own research and seek advice from a licensed financial adviser.


