
With trading available on mobile phones, you can sell bull put spreads from anywhere, perhaps even at a beach in some exotic country.
But we are actually talking about where on the option chain we should be selling bull put spreads.
At what delta?
Should we sell at the money near the 50 delta?
Or should we sell far out-of-the-money at the 15 delta?
It depends on what characteristics you want your bull put spread to have.
A spread at-the-money will have different characteristics than one far out-of-the-money.
Let’s see what we mean.
Contents
Spread Near the Money
Suppose an investor is bullish on Nvidia (NVDA) and wants to see a bull put spread with the April 19, 2024 expiration that is 35 days away.
Instead of highlighting any particular brokerage by showing a screenshot of its option chain, we will show you the option chain on OptionNet Explorer analytical software.
Your brokerage platform may look slightly different, but the concept would be the same.
Here, we see the option chain of the April 19th expiration of the NVDA underlying stock.
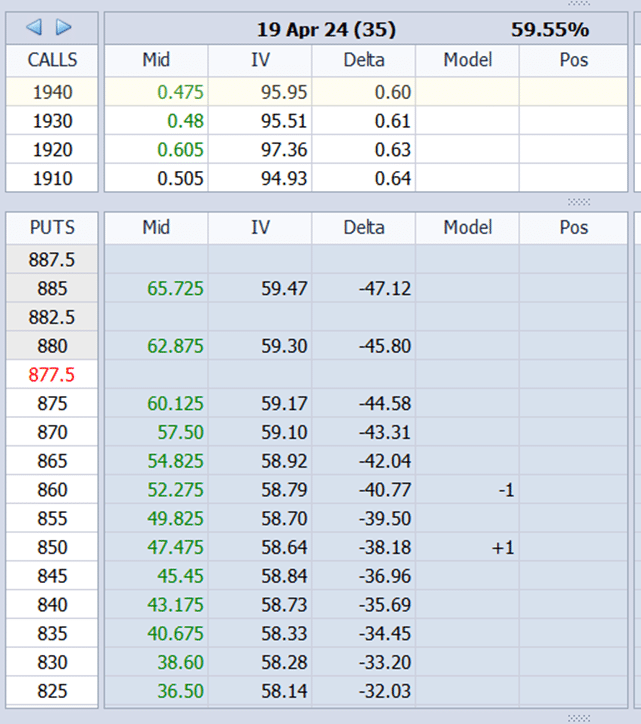
The current price of the stock is around $878.
That is why the $877.50 strike price is highlighted in red; it is closest to the current price.
Moneyness Of Options
If we were selling puts at that $877.50 strike or one strike above or below, such as the $880 strike or the $875 strike, we would be selling at the money.
If we were selling put options below the strike prices, such as the $860 or the $825 strike, etc, we would be selling out-of-the-money.
Please keep in mind that this only applies to put options.
If we were selling call options at strike prices below the current price, such as selling calls at the $860 or the $825 strike, we would be said to be selling call options in the money.
What is considered in-the-money for call options is out-of-the-money for put options.
And vice versa.
What is considered in-the-money for put options is out-of-the-money for call options.
Intrinsic Versus Extrinsic Values
The way to remember is to know that out-of-the-money options have no intrinsic value. Intrinsic value is the value you would get if you exercised the option right now.
For example, the $860 put option is out-of-the-money when NVDA trades at $878.
That is because that option currently has no intrinsic value.
It has no intrinsic value because if an investor exercises the $860 put option right now, the investor will receive no benefit (or no value from that option).
Why?
A $860 put option gives the investor the right to sell NVDA at the strike price of $860.
Selling NVDA at $860 a share is financially useless (no value) because the stock is trading at $878.
If the investor had NVDA stock, he would sell it at the market value of $878 rather than exercise his put option to sell it at $860.
This is why the $860 put option is useless right now.
It has no intrinsic value right now.
That is not to say that the put option is completely useless.
It can potentially be useful in the future if NVDA stock moves below $860.
An out-of-the-money option can become in-the-money and vice versa.
An option with no intrinsic value now can have intrinsic value in the future and vice versa.
Because the put option has the potential to be of use in the future, it does have value.
It has “extrinsic value.”
While the $860 put option has no intrinsic value, it has extrinsic value as long as it still has time till expiration.
If it has time, it still has the potential to be useful.
But if it has no more time, it will no longer have that potential, and its extrinsic value will go to zero.
The price of the option consists of both its intrinsic and extrinsic value.
Option Chain Delta
Going back to the picture of the option chain.
The investor is modeling the sale of a bull put spread.
He is selling one put option at the $860 strike and buying one option at the $850 strike.
The delta column shows that the $860 put option is at the -40.77 delta. We ignore the sign and say the $860 put option is at the 40 delta.
We see that the $850 put option is at the 38 delta.
So this bull put spread is roughly at the 40 delta.
By selling this bull put spread, the investor receives a credit of $480.
You can confirm this based on the mid-price shown in the option chain:
Sell one April 19 NVDA $860 put @ $52.28
Buy one April 19 NVDA $850 put @ $47.48
$5228 – $4748 = $480
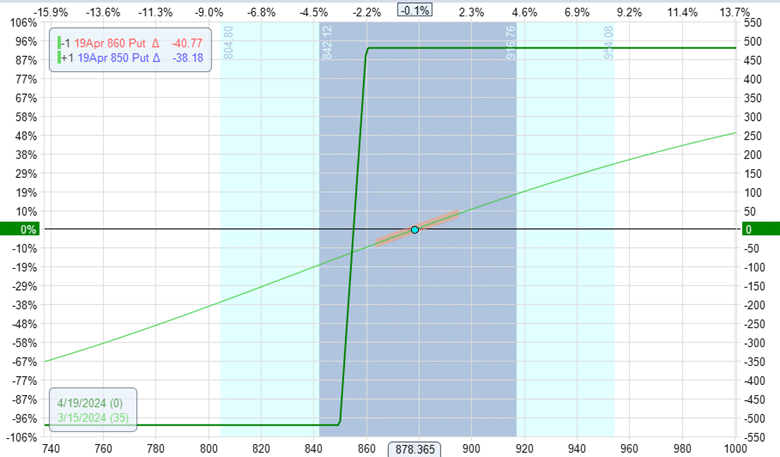
Its expiration graph looks like this:
Its Greeks are:
Delta: 2.5
Theta: 1.0
Vega: -1.8
The graph shows that the maximum potential reward is $480 (same as the initial credit received). And the max risk in this trade is $520.
That is about a one-to-one risk to reward if you take 520 divided by 480.
Spread Far From The Money
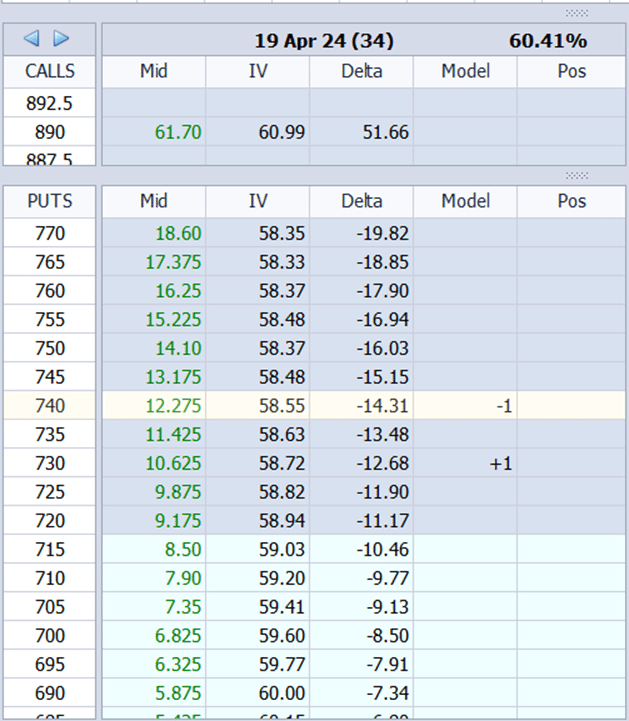
Below, we are looking at the same option chain, except this time, the investor decides to sell the $740 put and buy the $730 put.
The spread width is the same as in the earlier example.
They are both 10 points wide.
However, the investor only receives a credit of $165 for this spread.
However, the short put is at the 14.3 delta.
The long put is at the 12.68 delta, as seen on the option chain.
We can say that this spread is at the 14 delta.
It has different characteristics and produces a different-looking expiration graph:
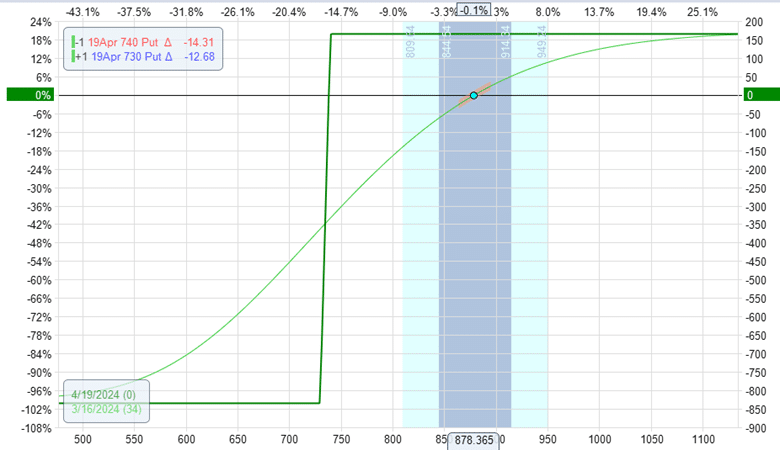
The reward in this trade is $165.
Because we collect a smaller credit, the maximum risk is higher at $835.
The risk-to-reward in this trade is 5-to-1.
The Greeks of this trade are:
Delta: 1.63
Theta: 3.92
Vega: -4.81
Compare And Contrast
We see that selling at the money (the first example) has a better risk-to-reward.
The investor is risking one dollar to make one dollar.
Selling far out-of-the-money (second example), we risk five dollars to make one dollar.
However, selling far out-of-the-money has a higher probability of profit.
There is about a 14% chance that the price will end up at the short strike of the far out-of-the-money spread at expiration.
In contrast, there is a 40% chance that the price will breach the short strike of the at-the-money bull put spread.
How did I come up with these statistics?
The delta on the option chain can be interpreted as the percent chance that the price will get to that strike at expiration.
Since the short strike of the second example was sold at the 14 delta, there is a 14% chance that the price will end up below that strike.
Similarly, there is a 40% chance that the price will break below the $860 strike.
These statistics are not exact but rough approximations.
When looking at the Greeks, the first example of selling at the money is more directional because it has a larger delta and smaller theta.
Selling further out-of-the-money (second example) is less directional and has greater income contribution from time decay.
Its theta is larger but has a smaller delta.
Conclusion
Ultimately, where to sell your bull put spread depends on how directional you want your trade to be.
If strongly directional, sell close to the money.
If you want greater theta, sell further out-of-the-money.
If you use the bull put spread to hedge another position, you can position where you want to sell it to get the delta you want.
Want a more positive delta?
Sell closer to the money. If you want less delta, sell further away.
If you want a good risk-to-reward, sell closer to the money.
If you want a good probability of profit, sell further away from the money.
If you want both, there is no such thing.
We hope you enjoyed this article on where to sell a bull put option spread.
If you have any questions, please send an email or leave a comment below.
Trade safe!
Disclaimer: The information above is for educational purposes only and should not be treated as investment advice. The strategy presented would not be suitable for investors who are not familiar with exchange traded options. Any readers interested in this strategy should do their own research and seek advice from a licensed financial adviser.


Great stuff. Thx again for all the continued knowledge.