


Contents
Steady Options Review – SteadyOptions.com is an online forum and community with numerous categorized articles, educational materials, and a supportive community for traders looking to learn their particular trading style.
Its blog has been awarded among the top options trading blogs in the past.
The primary objective of SteadyOptions.com is to help individual investors generate consistent profits by employing well-researched options strategies.
The platform offers a range of subscription-based services listed here, which provide subscribers with access to certain sections of the forum depending if they are active traders, longer-term investors, and depending on the strategy they prefer to trade.
In this review, we will be focused primarily on the “Steady Options” subscription.
This subscription has the highest returns, aiming to target a 5% to 7% return per month.
We believe this is their core and most active strategy.
This subscription is designed for active traders with 15 to 20 monthly trades using a capital allocation of $10k to $100k for the strategies.
Many readers here probably would fall into this category.
The frequently asked questions will briefly describe the other subscriptions at the end.
Is SteadyOptions An Alert Service?
Some users might get the impression that this is an alert service for option trades.
This is not an alert service in the strict sense of the word.
SteadyOptions will not send SMS text alerts.
They made it clear that these are not trade recommendations or financial advisors, and it says as such on every official trade post.
They are simply sharing what trades they are doing and commenting on those trades to educate the people who have paid subscriptions to the forums.
For the official trades, they will post if they adjust or exit the trade along with the fill price and the P&L achieved on the trade.
What you are paying for is access to the forums.
If you decide to perform the same trades they are trading, then so be it.
They are fine with that.
If you want to get notified by email whenever they post to the forum topic, you need to make sure that you click on “follow” for the forum and click on “follow” for the topic within that forum.
Each trade will have a separate topic.
Technically speaking, you are not getting trade alerts but email notifications of forum posts.
The forum posts are well organized and cleanly structured, so it is pretty easy to see what trades the official SteadyOptions team is posting.
Some trade alert services out there will not disclose the methodology of how they arrive at the trade choice.
This is so that the subscribers depend on alert service to become profitable.
SteadyOptions are not like this.
They are different.
Their goal is to teach you their methodology so that you can learn to do this independently without them.
Whether this takes one month or one year will depend on you, your level of experience, and the amount of work you put in.
Or if you rather let them do all the work and piggyback off their trades, that’s fine too.
SteadyOptions has gained a reputation for its transparent approach to trading.
The platform openly discusses both winning and losing trades, providing a realistic perspective on the challenges and potential outcomes of options trading.
The SteadyOptions team likes to include screenshots of their broker order in their posts.
This is to remind everyone that they are placing live trades and are putting their own real money where their mouth is.
It is a team with several members, including Kim Klaiman posting official trades in the forums.
Who Is Kim Klaiman?
Kim Klaiman is the founder of SteadyOptions.
He is a software engineer who became an options trader.
He went down the path of many options traders who tried directional and non-directional trading and did the usual iron condors, and this and that, etc.
In 2011, he perfected his skills to become particularly good at a particular trading style.
What Is That Style Of Trading?
It is not a secret that Kim’s favorite strategy, as described in his YouTube video posted in 2015, is the pre-earnings long straddle.
As a quick overview, a long straddle is purchased with an expiration date right after the earnings report.
Wait for the options to increase implied volatility (IV) as it approaches earnings and exit the trade before the announcement to avoid the volatility drop.
This strategy is also described in an article that he wrote on OptionAlpha titled A Good Option Strategy: Exploiting Earnings – Associated Rising Volatility.
When he says “Exploiting Earnings,” he really means exploiting the pre-earnings run-up in implied volatility.
He clearly states that he does not believe in holding the position across the earnings event.
Nuanced Decisions in Every Trade
However, just knowing this strategy at a high level is not enough.
The results the SteadyOptions team achieves are not only because they have practiced this particular strategy long enough that they know all the nuanced decisions that go into these trades.
They also use tools and backtesting to do their analysis for each trade.
They compare the pricing of the straddle to that of previous earning cycles – not on an absolute dollar value but on a percentage basis of the stock price since the stock price can be drastically different from several earnings cycles ago than the price today.
What is the straddle price in relation to the current stock price is known as the relative value of the straddle.
They have to decide how many days before earnings to enter the straddle.
For some stocks, it is sooner; for others, it is later.
When to take off the trade is equally important. Is there an optimal entry day and exit day combination for this particular stock based on past history?
What is a good profit target?
Other factors include techniques such as scaling in, adjusting as needed, and position sizing.
Some of how Kim goes about making the above decisions is revealed in an OptionAlpha podcast where he talks through a typical straddle trade.
However, this podcast was recorded a while ago.
The market might have changed, and the fine details of the strategy may have been tweaked to suit the current market.
SteadyOptions Performance
Kim continues to actively perform this strategy to this day in 2023, which is a testament that he has found something that has worked consistently for a long time – at least for him.
You can see SteadyOptions’ monthly performance results for the last 11-plus years on the performance page up until the current day, April 2023.
The average of those monthly returns is a very respectable 7.25% return on the portfolio per month.
In the last full year (which is the year 2022), it made an astounding 90.5% return – starting with $10,000, it ended the year with $19,061.
This was not a cherry-picked year.
Because the year before, it did even better.
If you scroll to the bottom of the page, you can get the start/end dates and P&L of every single trade for the past 11-plus years.
Their returns are tracked by Pro-Trading-Profits, an independent third party.
We subscribed to the SteadyOptions forum to look inside and followed a few of their trades.
They have a good win rate, which gives new subscribers confidence in the strategy.
A lot of their trades hit profit targets without adjustment.
And if not, they can often exit with positive P&L.
The key to their success is that they are very selective of their entry and the price at which they enter.
How they make their selection and entry criteria for each trade is the art that they perform.
Some Actual Statistics
Let me summarize for you some real numbers based on publicly available information on their performance page.
For the 107 closed trades so far in the year 2023 up to mid-May, there were 75 winners and 32 losers.
This is a win rate of 67%.
The important number is that their model portfolio grew from $10,000 to $13,013.
That averages out to be about a 7% to 8% monthly return, a good number for non-directional income strategies.
That 7% return means a 7% gain on the portfolio size of $10,000 – not 7% on the capital at risk in the trade.
This is a more conservative display of results because the distinction occurs when one is not using the full portfolio in trade allocations.
We then plotted the equity curve in a spreadsheet.
This is not bad. Starting with a capital of $10,000, the largest drawdown from peak to trough is $716.
The capital was at $10,598 on February 13, 2023, and down to $9882 on March 5.
During this period, it saw four consecutive losing trades, the largest sequence of consecutive losses seen so far in the year.
In comparison, the largest sequence of consecutive winning trades is 11.
The equity curve tells you how “tradable” a strategy is – how it might feel if you are trading it.
While one might be a bit disappointed that there were no significant gains in the first couple of months (capital back down slightly below starting capital on March 1), at least the trader is not having sleepless nights concerned that half their money is gone.
From an initial investment of $10,000, the equity never fell below $9,700.
This strategy is certainly tradable, even by the most timid of traders.
If a trader is still sleepless with this kind of equity curve, all they need to do is size down the position size and/or have a larger portfolio with a greater percentage of the portfolio sitting in cash.
Each trade is about $1000 in risk.
While many of the trades can be scaled down in size, some trades are at the smallest size with one contract.
If you want to see the equity curve for 2022, they have it shown on this page.
Few and far between, you might see an occasional trade with a large percentage loss, such as a UNH calendar that took an -87% loss on April 13, 2023.
The loss in dollar amount on this trade was $455, which is the largest loss seen so far for the year.
This trade lasted 14 days and was not fully scaled in yet, so the capital allocation was probably around $500.
The best lessons are learned from losing trades.
Any subscribed member can go back into the forums, follow this trade through, and read the discussions to see what happened and if anything could have been done that would have changed the outcome.
These losses are typically on low-risk, high-reward trades such as calendars.
Wait, why was this trade a calendar?
Isn’t the primary trading strategy the long straddle?
That is a good question and one with a good answer.
But to explain, we have to review how the straddle works.
How The Long Straddle Work
A straddle consists of a long put option and a long call option at the same strike price and expiration.
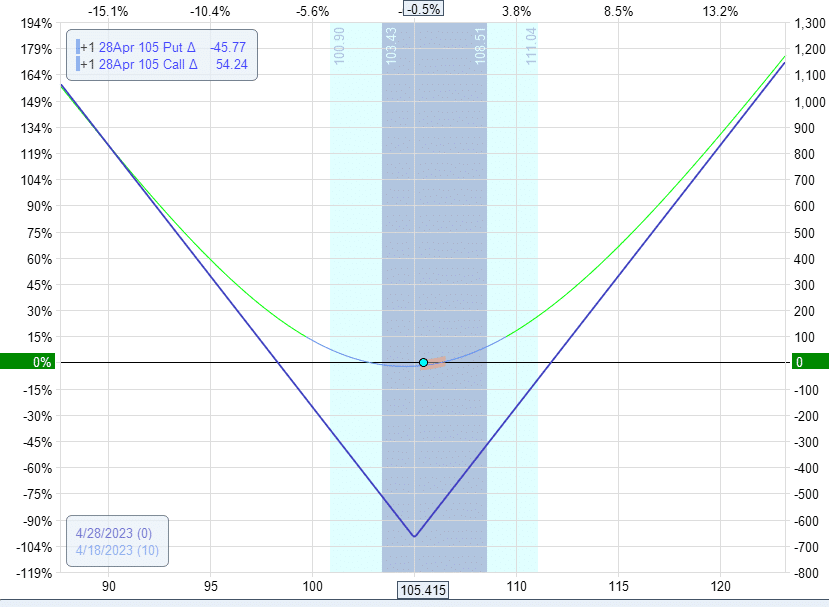
Suppose an at-the-money straddle was purchased on April 18, 2023, at the $105 strike of Alphabet (GOOGL).
The expiration date of April 28 was selected because it expires immediately following GOOGL’s earnings on April 25 after market close.
Date: April 18, 2023
Price: GOOGL @ $105.42
Buy one April 28 GOOGL $105 call @ $3.65
Buy one April 28 GOOGL $105 put @ $3.05
Net debit: -$670
This debit would be the maximum possible loss on the trade, as can be confirmed by the risk graph:
Delta: 8.5
Theta: -33
Vega: 13.8
Gamma: 9.6
Because the trade only has one to two weeks till expiration, it is a high gamma trade.
This means the straddle will benefit if the stock makes a large move.
As can be seen, by the T+0 line, the stock’s direction does not matter.
The straddle is a long vega trade, meaning that if implied volatility increases, the trade will benefit. Implied volatility usually will increase as we approach earnings.
However, it is theta negative, which means that it loses money every day we are in the trade where the stock price does not move.
The only problem the straddle will encounter is if the stock does not move.
In that case, the question comes down to whether the increase in implied volatility will be able to overcome the time decay.
If the implied volatility (IV) is more than enough to offset the negative theta, then the straddle can be profitable.
If time decay is too fast, then the straddle will not be profitable.
No one will know the answer to this question in advance.
However, we can get an idea of how the stock behaved in previous earnings by backtesting the stock in previous cycles under the same days to earnings conditions.
If it is determined that the implied volatility typically does not go up enough for the particular stock to overcome time decay, then a straddle will not be profitable.
Instead, do the opposite, which is to sell the option instead of buying the option that is right after earnings.
That is the calendar. Sell the option with the expiration that is right after the earnings report.
Then buy the long option with one or two weeks later expiration.
Why not sell the option that is expiring right before earnings?
You would think that the IV of the option after the earnings event would prop up earnings.
It is a bit counter-intuitive, but there is a good reason to have the front short option expiration after the earnings event.
It is not a typo. You can read their article Calendar Spread Strategy.
No sign-ups are needed. Scroll down to the section “Pre-earnings calendars.”
You will understand the reason after we finish our GOOGL trade example.
Continuing our GOOGL straddle example, the trade is meant to be taken off before the earnings announcement.
On the morning before the earnings announcement, the straddle is down -$104.50, or -15%. So the straddle did not work in this case.
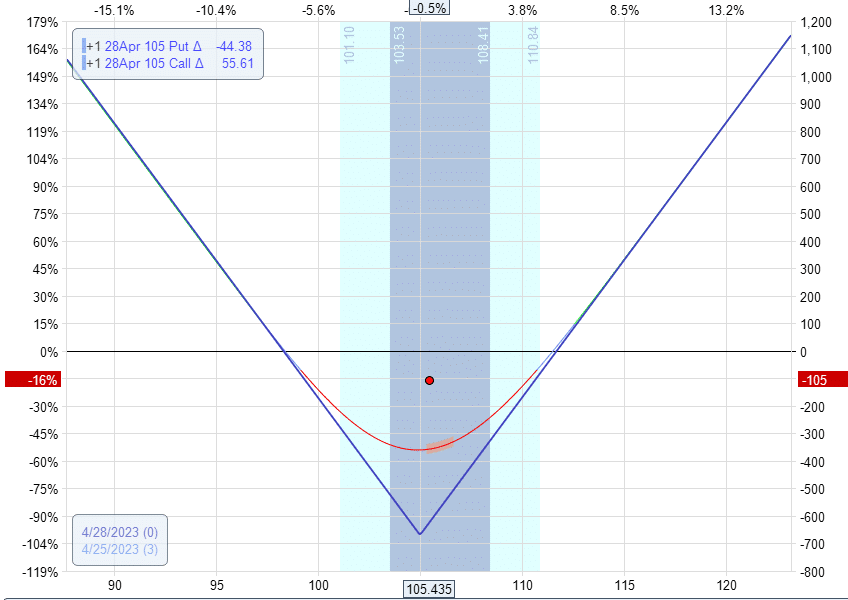
Now let’s do the pre-earnings calendar with the front short option expiration after the earnings date.
Date: April 18, 2023
Price: GOOGL @ $105.42
Sell fifteen April 28 GOOGL $105 put @ $3.05
Buy fifteen May 5 GOOGL $105 put @ $3.43
Net debit: -$563
Delta: 4.6
Theta: 83.5
Vega: 31.42
Gamma: -8
Three days later, this calendar is in profit of $135, a 24% return on risk.
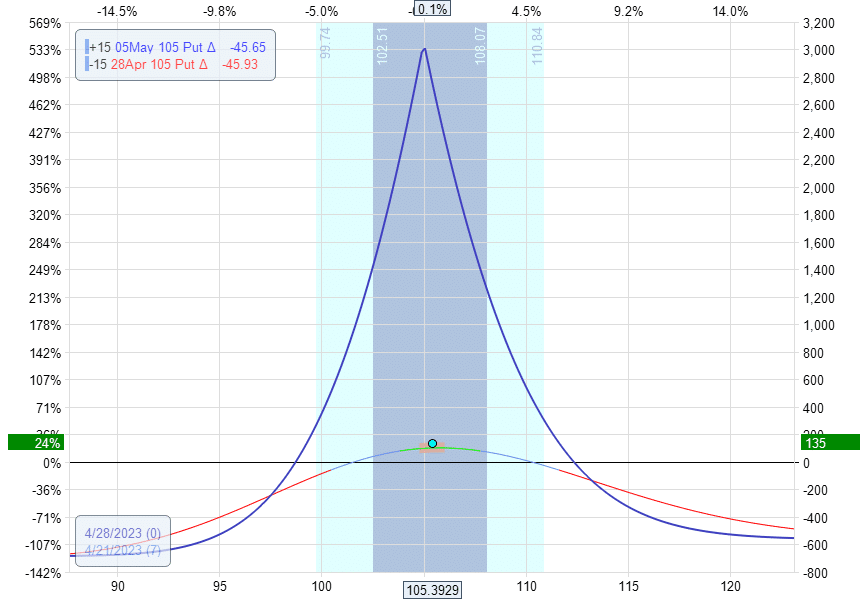
The calendar worked.
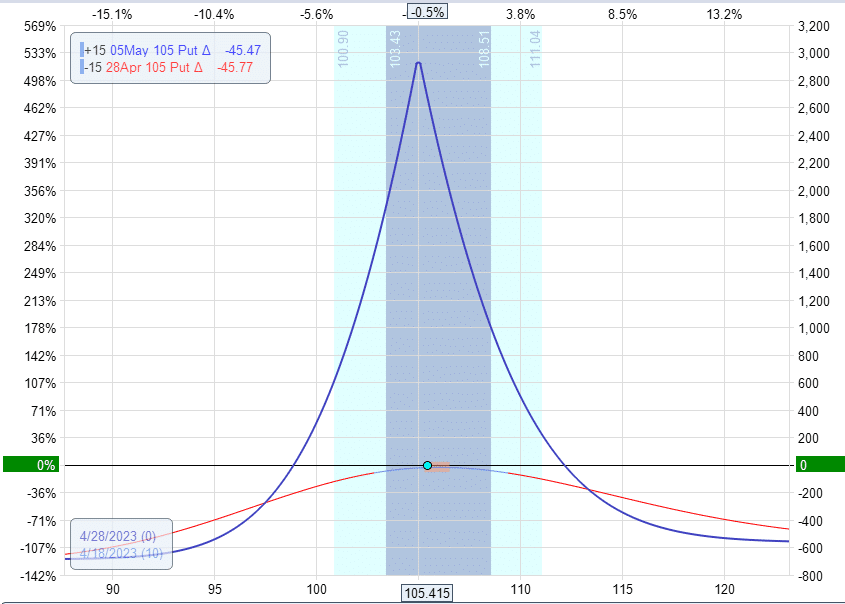
Now let’s do the calendar with the short front expiration before the earnings date instead of after the earnings date.
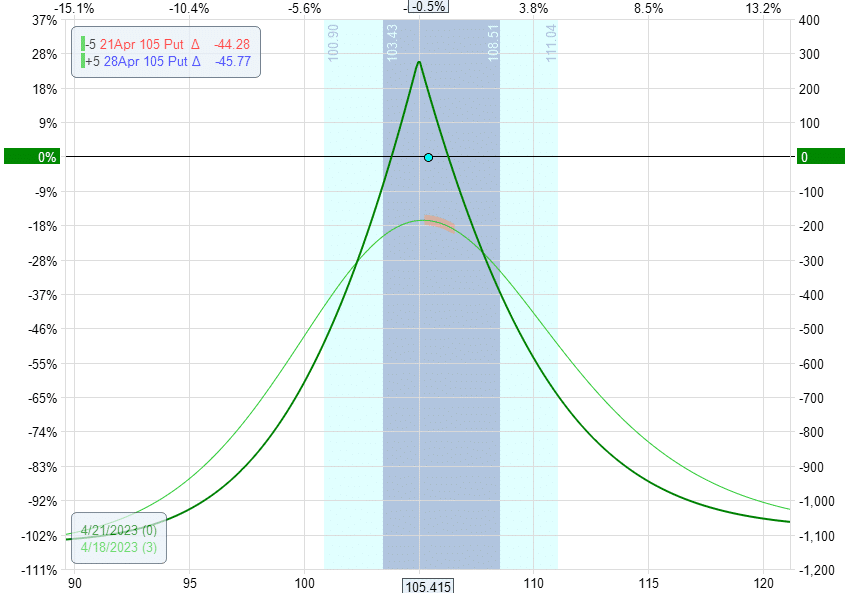
You can immediately see the problem if you compare this with the graph of the other calendar.
This calendar does not have a good reward to risk, and its profitable range is less.
Frequently Asked Questions:
As of the time of this writing, Steady Options has five subscription services:
- Steady Options (the subscription we’ve been talking about in this review)
- Simple Spreads
- Steady Vol
- Anchored Trades
- Steady PutWrite
How is the Simple Spreads subscription different from the Steady Options subscription?
The Steady Options subscription involves time-sensitive strategies more suitable for experienced options traders with more time to monitor the market.
Sometimes if you miss the trade by a few hours, you will not be able to get the price that they got it at.
On the other hand, the Simple Spreads subscriptions are more suitable for new options traders since it involves longer days-to-expiration strategies such as leveraged covered call and vertical put spreads.
The leverage-covered call is like a covered call, except it uses a deep-in-the-money call (like 90-delta) instead of stocks.
These calls expire 6 to 9 months out, and selling covered calls 3 to 6 weeks out.
These strategies target 5% to 10% return per trade and target 3% to 5% return per month on a $25,000 portfolio.
What is the SteadyVol subscription?
It is for volatility traders. The strategy uses debit and credit spreads and iron condor with VIX options.
The goal is to capture profits when a VIX spike occurs.
This is a relatively new subscription service with performance data available only for the last month of 2022 and the first few months of 2023.
Based on the data so far, the average monthly return is 2.9%.
Who is the Anchored Trades Subscription for?
These trades are meant for longer-term holdings in any portfolio.
They maintain constant exposure to the market with the main goal of capital preservation.
As such, it is not meant to achieve stellar returns.
Its goal is to have positive returns under all market conditions.
The strategy is to be long the S&P 500 and hedged with put options so the investor does not lose much money during a bear market or market crash.
It met its goal of positive returns of 38%, 32%, and 36% for 2019, 2020, and 2021.
But unfortunately, it could not meet its goal in 2022, which had a -28% return.
In mid-2020, they started “Diversified Anchored Trades,” which includes doing the same on QQQ, IWM, EFA, and SPY.
When you subscribe to Anchored Trades, you get both of these strategies.
What is the Steady PutWrite subscription all about?
As its name implies, the strategy is to sell (write) put options contracts on the S&P 500 and other ETFs for diversification.
In other words, the strategy primarily sells cash-secured puts intending to beat benchmark indices but with lower volatility.
Does SteadyOptions have a free trial?
When it first started many years ago, it did.
But now it does not have any free trial, nor refunds.
I guess it wouldn’t be fair to provide a free trial where someone can go in and save all the forum material, strategies, and educational materials; and then take however long to study the downloaded material and not have to pay anything.
How to adjust the long straddle?
The long straddle starts as a delta-neutral position.
However, as the stock moves, it loses its delta neutrality. Some traders will roll one of the legs to maintain delta neutrality.
Other traders might not do anything and hope the stock continues in that direction, in which case the straddle will make money.
There are pros and cons to both actions.
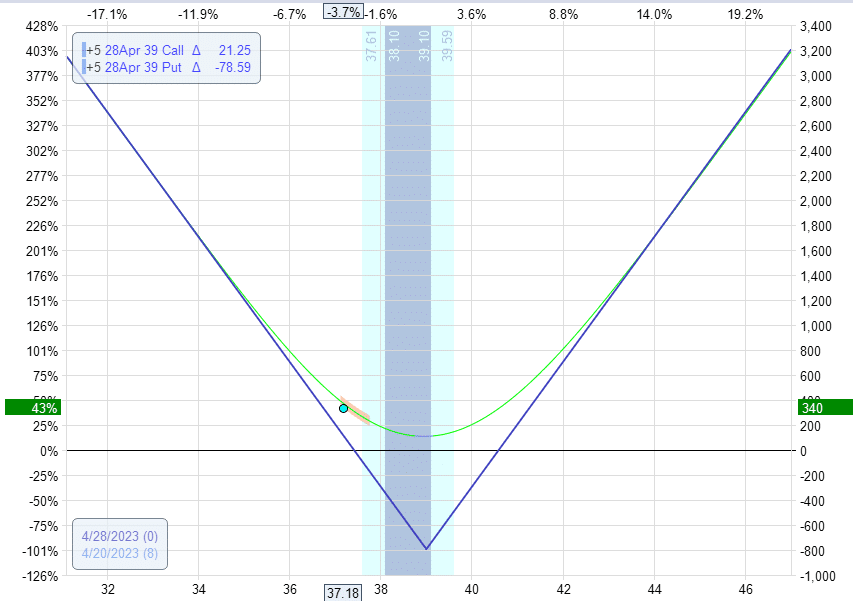
Let’s take the example of a long straddle at a strike of $39 for Verizon (VZ)…
Date: April 17, 2023
Price: VZ @ $39.22
Buy five April 28 VZ $39 call @ $0.95
Buy five April 28 VZ $39 put @ $0.65
Net debit: $795
Delta: 53
Theta: -34
Vega: 27
Gamma: 202
Three days later, the VZ price dropped, and we captured $340 in profits, as shown in the graph below.
Delta: -286
Theta: -40
Vega: 16
Gamma: 133
We can take the profits. Or we can do nothing and get more profit if VZ continues down.
Or we can roll the long put down to $35 like this:
Sell to close five April 28 VZ $39 put @ $2.03
Buy to open five April 28 VZ $35 put @ $0.23
Net credit: $900
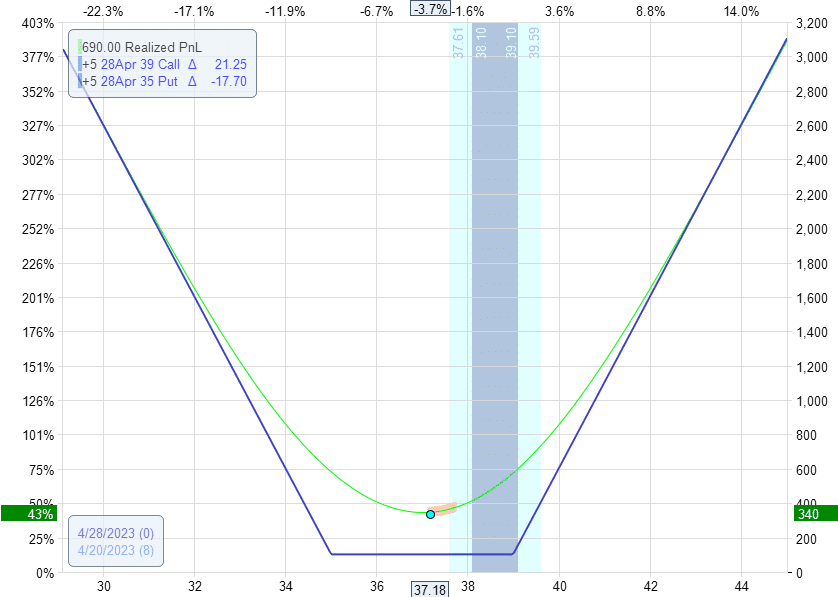
Delta: 19
Theta: -40
Vega: 15
Gamma: 120
This locks in the gains we have.
Now we have a riskless trade.
It resets the delta back to neutral. And if the price moves more in either direction, we can gain more.
Conclusion
This review aims to give you a flavor of what SteadyOptions is all about so that you can decide if their strategies are right for you.
If you are a purely directional trader, this may not be right for you because they do non-directional strategies.
If you like to trade across earnings, that is not what they do.
However, if you like short-term non-directional strategies, this may be your cup of tea.
Unlike the typical non-directional strategies, which make money if the underlying does not move, the straddle is a non-directional strategy that profits when the market makes big moves.
Long straddles can also act as a hedge against a black swan event such as a market crash. IV will increase, which benefits the trade.
And the large directional move benefits the trade.
Straddles are long vega that will make a good complementary strategy to your short vega trades, such as iron condors and butterflies.
If you are like many non-directional traders, you might have a lot of iron condors, butterflies, and calendars, many of which may be on indices such as SPX or RUT.
Wouldn’t adding a non-directional strategy that you can place on equities would be nice?
If the answer is yes, then SteadyOptions may be right for you.
They know how to trade long straddles. And you would be learning from the best.
Or if you rather just piggyback on their trades, that would be fine too.
They do all the backtesting and analysis for you and have the experience to know when to enter when to adjust, and when to exit.
We hope you enjoyed this article about this Steady Options review.
If you have any questions, please send an email or leave a comment below.
Trade safe!
Disclaimer: The information above is for educational purposes only and should not be treated as investment advice. The strategy presented would not be suitable for investors who are not familiar with exchange traded options. Any readers interested in this strategy should do their own research and seek advice from a licensed financial adviser.


Great article as usual … thanks Gav
Thanks Chris.
Very nice article. Thanks for sharing a new successful trade service. I have traded the earnings and hold for the IV crash. Never thought of earnings trade this way. Would like to explore this further.
You’re welcome.
Nice article thank you for posting. I was a previous subscriber to steady options, but stopped it because, as you noted, you have to watch the service very carefully and time your trades very quickly and I just couldn’t do that and got hurt a few times. Hence my returns suffered. Also, I wonder about the feasibility of a double calendar, selling the front months multiple times in terms of weekly’s prior to expiration instead of holding until after expiration.
Thanks for sharing your experience.
Members who learn the strategies don’t really need to wait for the notifications, they become more independent and open and close trades based on the discussion topics.
The setup you mentioned could work, but it will be much less resilient if the underlying moves. We discussed it on the forum many times.
Great write-up on this service, Gavin. I was looking at thewebsiteand saw this disclaimer:
What is the minimum account size to trade those strategies?
I recommend at least $5,000 account to start with, $10,000 is better. I do NOT recommend trading accounts larger than $100,000 due to potential liquidity issues.
Any idea what he means by this?
Steve, it means that many trades are not scalable in terms of number of contracts.
Gavin, thank you so much for the comprehensive and objective review! It gives prospective members a good idea what to expect.
I’ve had a SteadyOptions membership in the past, and found it informative. The reason I didn’t continue with it is that I’m Canadian, and we do not have access to the same low fee option trades available in the U.S. SteayOptions published track records do not include fees on the premise that fees are insignificant due to the low cost of option trading, but unfortunately that doesn’t hold true in Canada.
Thanks for sharing Wayne. Yes, not really fair for you is it? Have you tried Interactive Brokers?
Wayne, I’m a Canadian as well. I’m using Interactive Brokers. Their average commissions are around 0.40/contract. a 100% yearly return would be reduced to around 75-80% with IB commissions. I think most traders would be very happy with that kind of return.
I’m curious, is there any assignment risk associated with the earnings strategy?
I’m pretty fuzzy on how the assignment process can work, so I’m asking generally.
Let’s say you have automation to close the contracts at 2pm, but the contracts got assigned late in the day…and you’re away from the computer (or whatever other situations…). My understanding is you then have to buy the stock tomorrow when the market opens — but this is after the earnings are out, so there’s probably a big gap up or down?
Depends what strategy you are looking at. If it’s a long straddle, you are the option owner, so you decide if and when to exercise the option.
If you’re talking about the Calendar Spreads, then yes, the short option could have assignment risk if it is ITM.
Options cannot be assigned during market hours. Once you see that the options has very little time value and assignment risk becomes real, you just close the whole position.