







Contents
- Double Top Breakout
- Ascending Triple Top Breakout
- Quintuple Top Breakout
- Bearish Patterns
- Low Pole Reversal
- High Pole Reversal
- More Examples
- How Options Traders Use P&F Chart Patterns
- FAQ
- Conclusion
This article is not meant as an in-depth tutorial on how to read point-and-figure charts.
But rather, it is a tour of the various chart patterns in P&F charts.
The vertical y-axis is price.
The columns of X’s (an uptrend) and the columns of O’s (an downtrend) are formed from left to right.
An X or O is drawn only when the volatility in price movement is sufficient to warrant one.
There is never an X and an O in the same column.
When price makes a significant enough of a price reversal, a new column is formed to the right.
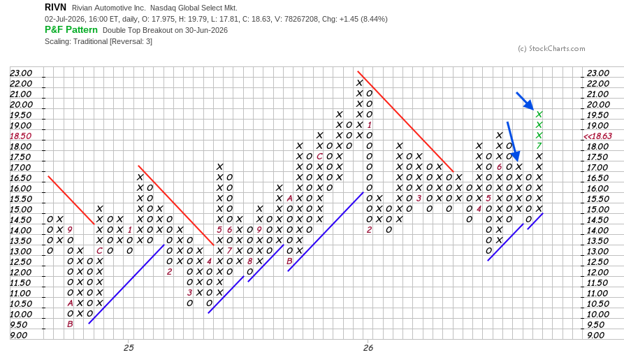
We start with the most common and simplest of all P&F patterns – the double-top breakout.
Double Top Breakout
This is when the latest column of X goes higher than the previous column of X.
Source: StockCharts
As one is becoming familiar with reading P&F charts, it helps to see how they translate from candlestick charts.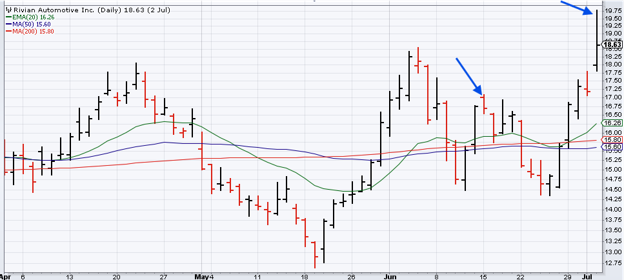
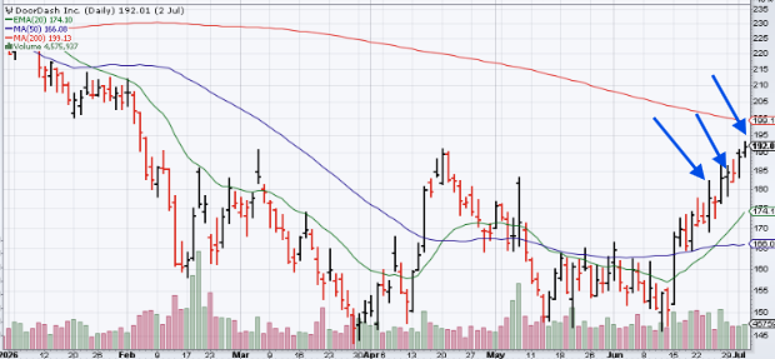
This pattern indicates that the current uptrend went higher than the previous uptrend.
Ascending Triple Top Breakout
The triple top breakout is similar in concept but with three ascending tops…
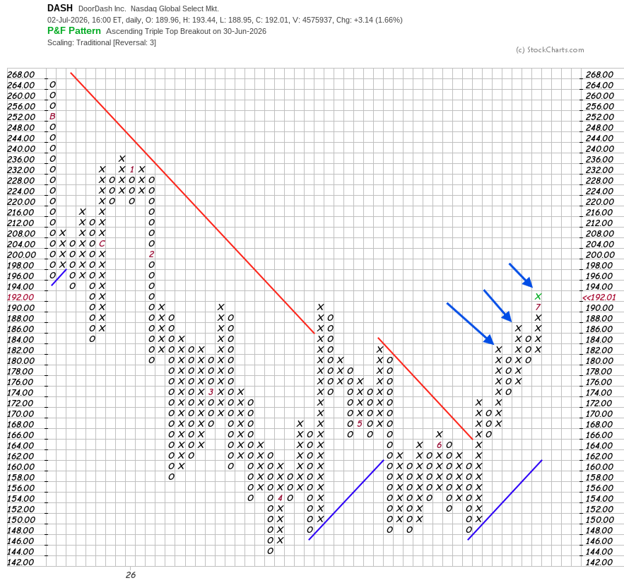 We can use the numbers in the columns to correlate the time period in the candlestick chart.
The “7” that you see in the last column of X means that was when the start of the July month occurred.
The “6” is the start of June.
“1” is January.
There is no “10”.
Instead the letter “A” is used to represent October.
“B” for November.
And “C” for December.
The “26” on the bottom horizontal axis of the chart represents the year 2026.
Quintuple Top Breakout
If a triple is three peaks, then a quintuple top has five peaks…
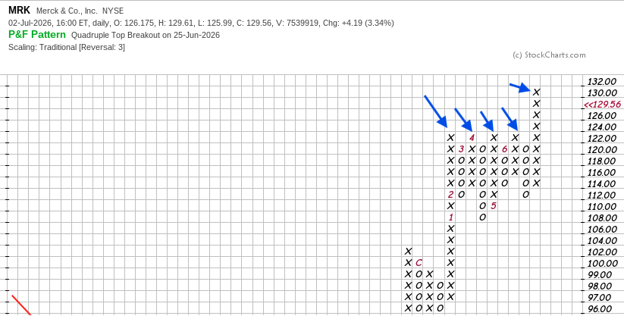
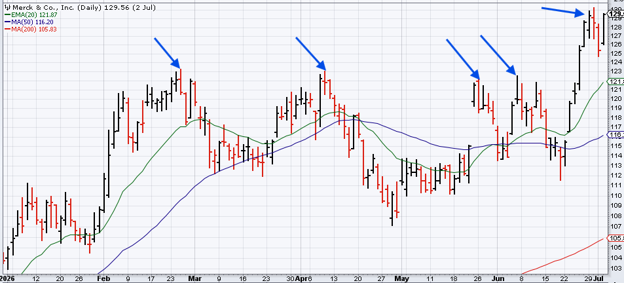
The word breakout means that the last peak is higher than the rest.
This example is not an ascending breakout because the four other peaks are equal height rather than ascending.
Note that the number “4” shown in one of the X columns takes the place of where an X would have been there.
This makes the four columns of X the same height, which we can also clearly see in the candlesticks…
Bearish Patterns
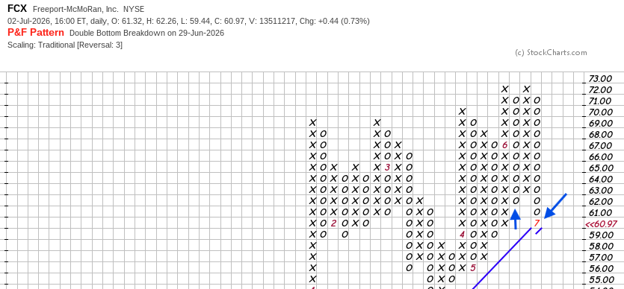
Double bottom breakdown
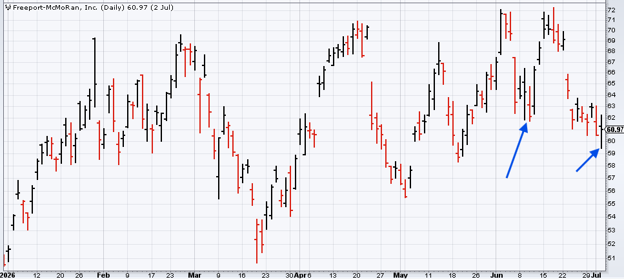
The double bottom breakdown is when the latest column of O’s goes below the previous column of O’s.
Triple bottom breakdown
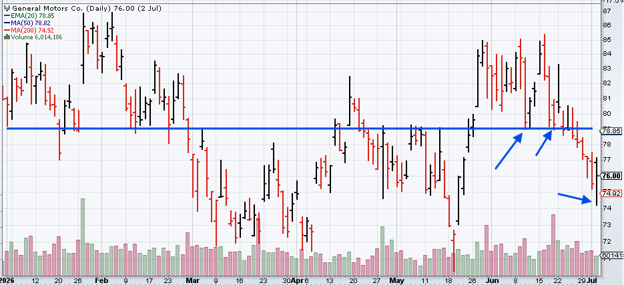
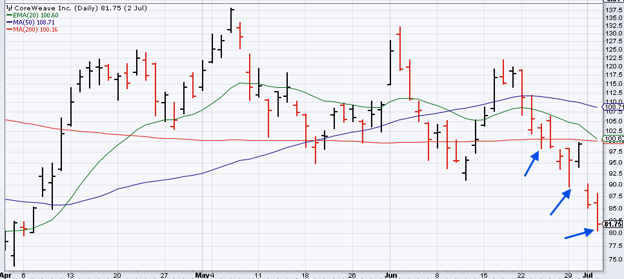
Below we have a triple bottom breakdown.
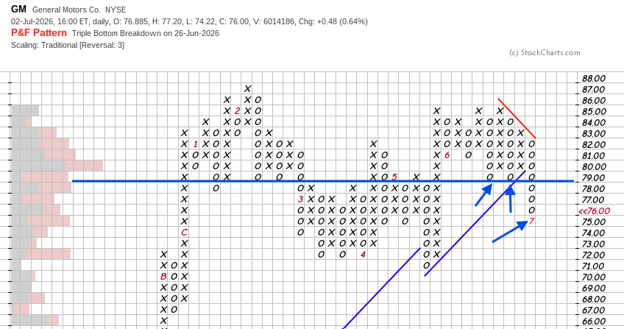
Support and resistance levels are easier to identify on Point & Figure charts because multiple columns of Xs and Os often terminate at the same price levels.
The breakdown was especially significant because the price not only fell below the previous two lows, but also breached a heavily traded support zone.
By enabling the Volume by Price overlay in StockCharts‘ Point & Figure charts, we can see that area around the $80 level was heavily traded.
Descending Triple Bottom Breakdown
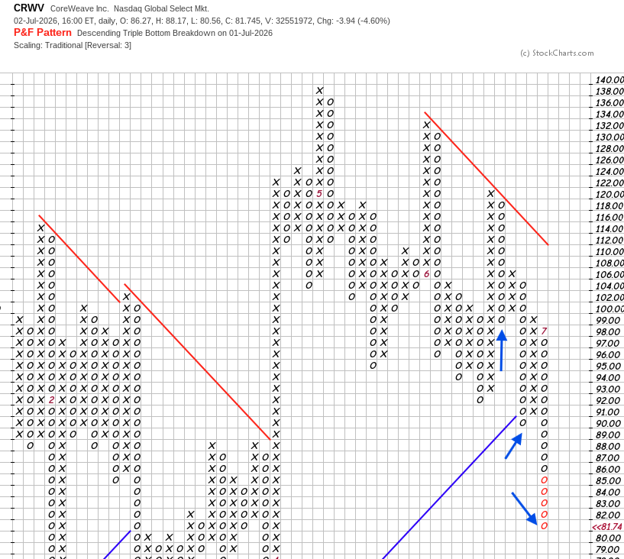
Here is another triple bottom breakdown, but it is also a descending breakdown…
Low Pole Reversal
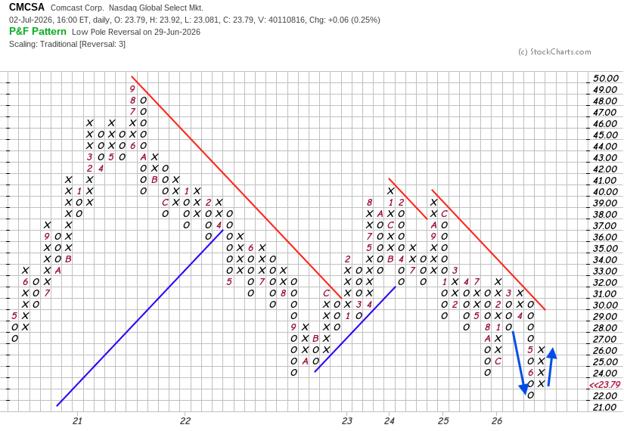
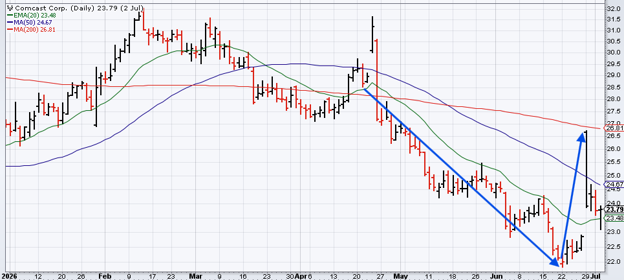
A Low Pole Reversal occurs when a column of O’s falls below a previous low by at least 3 boxes before reversing to rise by at least 50 percent of the fall.
High Pole Reversal
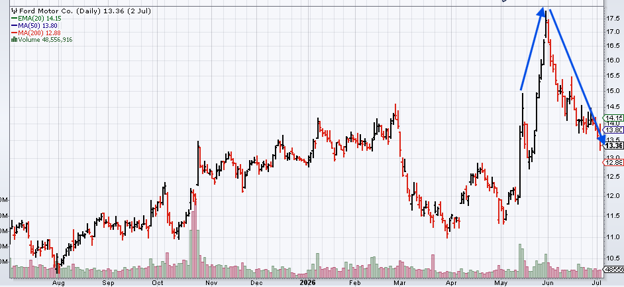
Similarly, here is an example of a High Pole Reversal…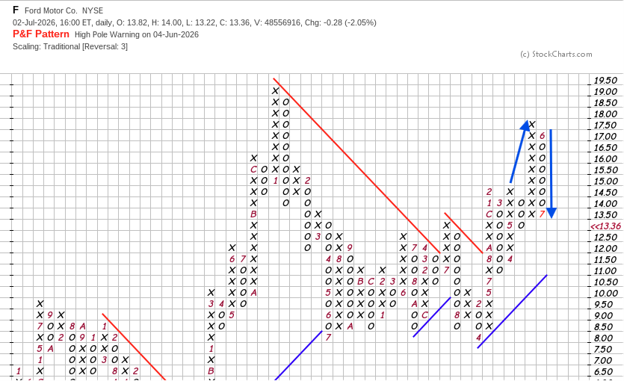
More Examples
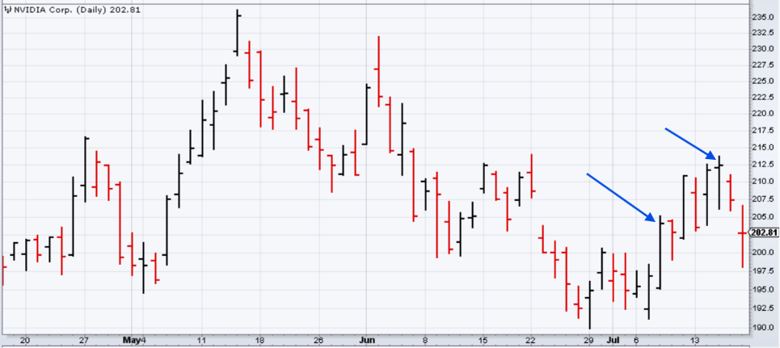
Here is a bullish double top breakout even though the last column is a column of O’s.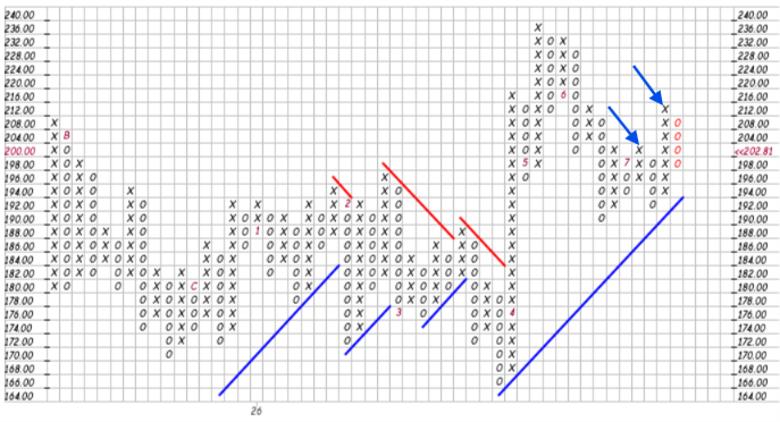 A double top breakout – or any stronger breakout pattern, such as a triple top or ascending triple top breakout – is considered a buy signal on a Point & Figure chart.
Once generated, a buy or sell signal remains in effect until it is reversed by an opposite signal.
In this example, no sell signal has occurred.
A sell signal would require a double bottom breakdown, which has not taken place.
The current column of O’s simply indicates that the stock is undergoing a pullback within a longer-term uptrend.
As long as the existing buy signal remains intact, the primary P&F trend is still considered bullish.
How Options Traders Use P&F Chart Patterns
For options income traders, P&F patterns serve as directional filters that confirm whether a trade setup has technical backing.
Bullish breakout patterns — double top, ascending triple top, quintuple top — support bullish options positions: bull put spreads placed below P&F support levels, covered calls on stocks in confirmed uptrends, or cash-secured puts on stocks where the P&F chart shows buyers clearly in control.
Bearish breakdown patterns — double bottom, triple bottom breakdown, descending triple bottom — support bearish positions: bear call spreads placed above P&F resistance levels, or avoiding new bullish positions entirely on stocks showing multiple breakdown signals.
Pole reversals are particularly useful as warning signals for existing positions. A High Pole Reversal appearing on a stock where you hold an open bull put spread is a prompt to review the position — the reversal doesn’t guarantee further decline, but it signals that momentum has stalled and the trade deserves closer monitoring.
The practical workflow: use the Nasdaq Dorsey Wright screener to identify stocks with buy signals and high Tech Attribute scores, confirm the P&F pattern type from this guide, then check implied volatility rank before placing the options trade.
FAQ
What Is The Most Reliable Point-and-Figure Chart Pattern?
The Ascending Triple Top Breakout is widely considered among the most reliable P&F patterns.
Three ascending peaks indicate sustained buying pressure over multiple consolidation periods, and the breakout above all three is a strong confirmation of an established uptrend.
The Bullish Catapult — a triple top breakout that pulls back and breaks out again — is considered even more significant when it occurs, as the second breakout through resistance confirms the level has converted to support.
What Is The Difference Between A Double Top Breakout And A Triple Top Breakout?
Both are bullish breakout signals.
A double top breakout means the current column of X’s exceeded one prior X peak — a standard buy signal.
A triple top breakout means the current X column exceeded two prior X peaks at similar levels — a stronger confirmation that resistance has been overcome.
In general, the more prior peaks that are exceeded, the stronger the breakout signal.
What Is A Low Pole Reversal And Is It Bullish Or Bearish?
A Low Pole Reversal is a bullish pattern.
It occurs when a column of O’s drops at least 3 boxes below a prior O low (a “pole” of significant decline) and then reverses upward by at least 50% of the fall.
The dramatic decline followed by a significant recovery suggests sellers exhausted themselves, and buyers stepped in with conviction.
It is considered a counter-trend signal rather than a trend-continuation signal.
How Do I Identify Support And Resistance On A P&F Chart?
Support and resistance on P&F charts are identified at price levels where multiple columns of X’s peak at the same level (resistance) or multiple columns of O’s bottom at the same level (support).
When a triple bottom breakdown occurs, the level where three O columns previously found support is now broken — that former support typically becomes resistance on any subsequent rally.
The Volume by Price overlay on StockCharts can confirm which support/resistance levels are most significant based on historical trading volume.
Can P&F Patterns Be Used On Any Timeframe?
P&F charts are inherently designed for daily data — the traditional scaling assumes one price update per day, as in the newspaper-era origins of the technique.
That said, StockCharts and similar platforms allow you to construct P&F charts from intraday or weekly data.
The patterns themselves work on any timeframe, but most P&F practitioners use daily charts, and the signal reliability is best established on daily data.
Conclusion
As you gain experience, these patterns become easier to spot.
Whether you use them to identify breakouts, or simply to cut through market noise, P&F charts provide an unique perspective on market behavior.
Want to Trade Options on Technically Strong Stocks?
Finding stocks with strong P&F patterns is the first step.
Options Income Mastery covers the second step — how to structure bull put spreads, iron condors, and covered calls on technically confirmed setups with defined risk and systematic trade management.
Learn more about Options Income Mastery →
We hope you enjoyed this tour of Point-and-Figure chart patterns.
If you have any questions, please send an email or leave a comment below.
Trade safe!
Disclaimer: The information above is for educational purposes only and should not be treated as investment advice. The strategy presented would not be suitable for investors who are not familiar with exchange traded options. Any readers interested in this strategy should do their own research and seek advice from a licensed financial adviser.