
Today, we are looking at low IV options strategies. The main focus will be on strategies that do well when volatility moves from low to high. These are known as positive vega strategies
Contents
- Introduction
- Positive Vega Strategies
- Long Calls and Puts
- Calendars
- Calendar Straddle
- Double Calendars
- Diagonals
- Synthetic Covered Call
- Double Diagonals
- Conclusion
Introduction
Implied volatility (IV) exhibits a mean-reverting characteristic.
When it is higher than average, it eventually returns to the mean or the average.
When it is lower than normal, it tends to eventually go back up to its average.
Today we are talking about options strategies to use when IV is lower than normal.
We want to look at strategies that benefit when IV goes back up to its mean.
The strategies that do well when IV goes up are long vega strategies, ones where the Greek vega has a positive value.
When vega is a positive number, the value of the options position will increase for every point increase in IV.
The amount of increase is determined by the magnitude of that number.
When vega is negative, the spread will lose value for every point increase in IV.
In a low volatility environment, we want option strategies that have positive value so that the strategy can benefit when IV returns to its mean.
Positive Vega Strategies
The three broad categories of strategies that have positive vega are:
- long calls and puts
- calendar spreads (includes double calendar and calendar straddle)
- diagonal spreads (includes double diagonals and synthetic covered calls)
The VIX is the volatility index of the S&P500 index (SPX).
What constitutes low volatility is relative. What is considered low volatility now is not what was considered low volatility back in the year 2017.
Many investors look at the VIX range over a one or two-month period.
If the VIX is in the lower end of that range, that is good enough for them to consider it a low IV.
In the year 2021, any VIX under 18 would have been considered low.
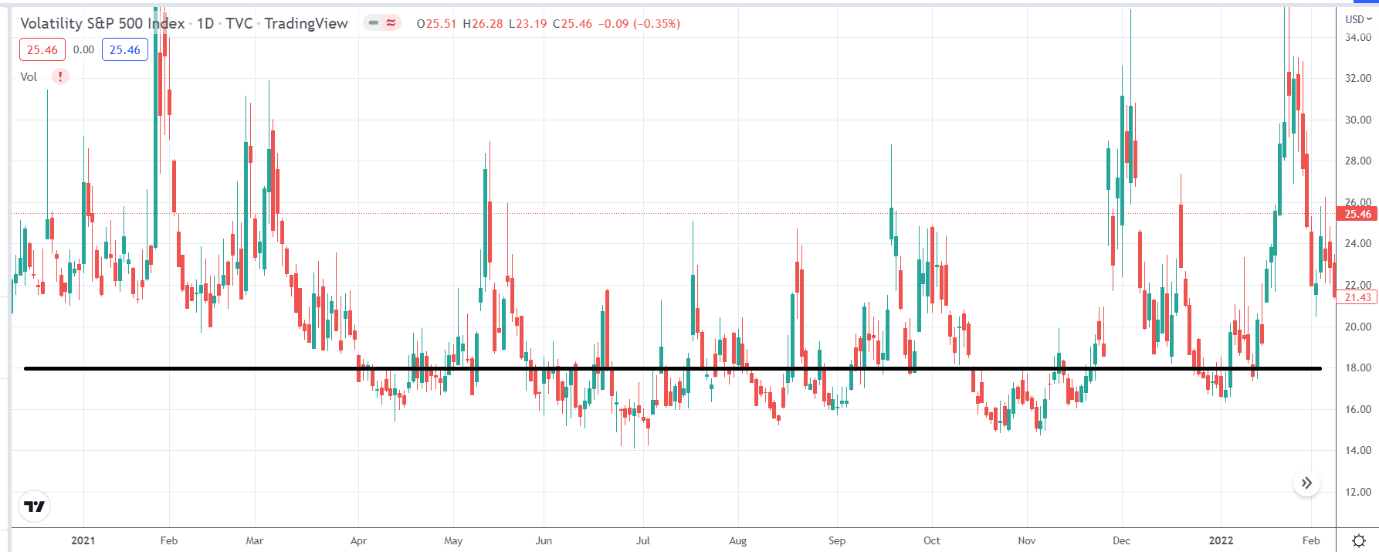
source: tradingview.com
For the year 2022, VIX under 22 would be considered low since you would rarely see VIX go down to 18.
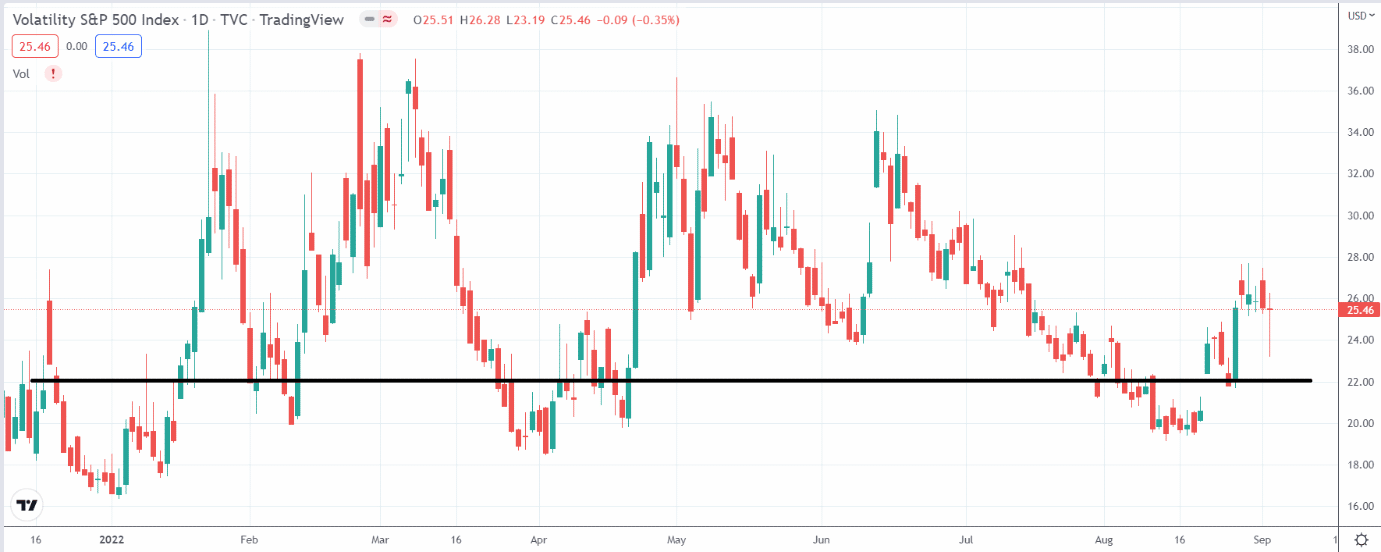
Other investors might even say VIX below 24 as being low.
This is not an exact science.
Low IV strategies can be considered if the investor thinks that VIX is lower than normal and that it might go back up.
Long Calls and Puts
A long call option does have positive vega.
Same for a long put option.
However, they are directional trades by themselves since there is only one leg and no other option to hedge it.
Only if an investor has a very strong opinion that a stock will make a big move in one direction, then a long call or a long put in a low IV environment may work.
Otherwise, we rarely trade a long call or put option by itself.
The point to remember here is that a long option has positive vega.
In an option spread, there will be a short option and a long option.
If your long option is bigger than your short option, you will have achieved positive vega, which is what we want if IV is low and we expect IV to increase.
Calendars
A calendar options spread consists of a short option with a short-dated expiration plus a long option with a longer-dated expiration.
For example, here is a calendar strategy initiated on March 31, 2022, with a short put option expiring on April 29 and a long put expiring on May 6.
Date: March 31, 2022
Price: SPX @ 4593
Sell one Apr 29 SPX 4600 put @ $88.50
Buy one May 6 SPX 4600 put @ $102.15
Total debit: –$1365
Max risk: $1365
Max reward: $2900
Reward-to-Risk ratio: 2.1
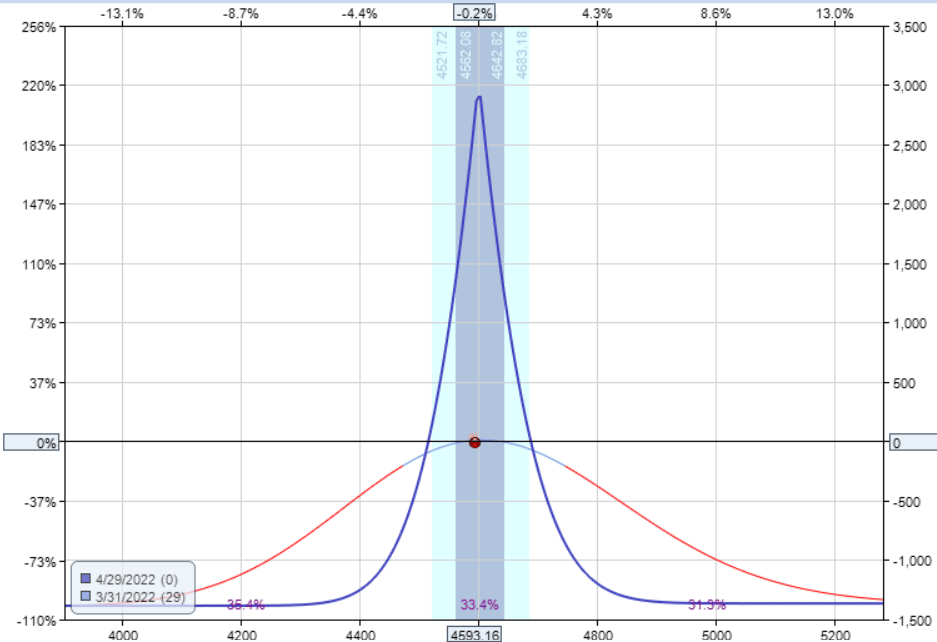
source: OptionNet Explorer
The Greeks of the position are:
Delta: 0.34
Vega: 58.95
Theta: 9.61
The long option expires one week later than the short option.
Note that we have a positive vega of 59.
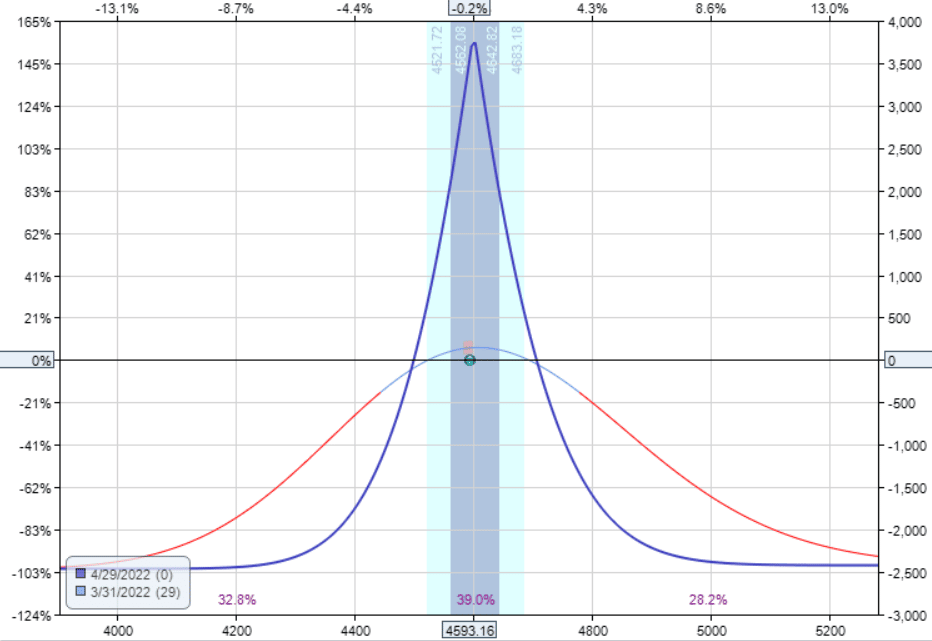
If we make the long option expiration two weeks later than the short option, the vega would be even higher at 112.
For example:
Date: March 31, 2022
Price: SPX @ 4593
Sell one Apr 29 SPX 4600 put @ $88.50
Buy one May 13 SPX 4600 put @ $112.70
Total debit: –$2420
Max risk: $2420
Max reward: $3700
Reward/Risk: 1.5
source: OptionNet Explorer
Delta: 0.63
Vega: 112.36
Theta: 18.29
The greater the difference in expirations between the short and long options, the more sensitive the calendar is to volatility changes.
It also means that we get larger theta.
The calendar would cost more because the farther away long option will be more expensive.
Since the max risk of the calendar is the debit paid, this increases the max risk and decreases the reward-to-risk ratio.
However, looking at the expiration payoff graph, the second calendar has slightly wider expiration breakeven points which means that there is a greater range in which this calendar can be profitable.
These calendars are placed with the short strikes close to where the current price of the underlying is at.
These are known as “at the money” calendars, which do not have any directional bias.
Calendars can be made directional by putting the short strikes at the price where you think the underlying will go.
These calendars are using put options, but they could have just as well been done with call options, and everything would be about the same.
Calendar Straddle
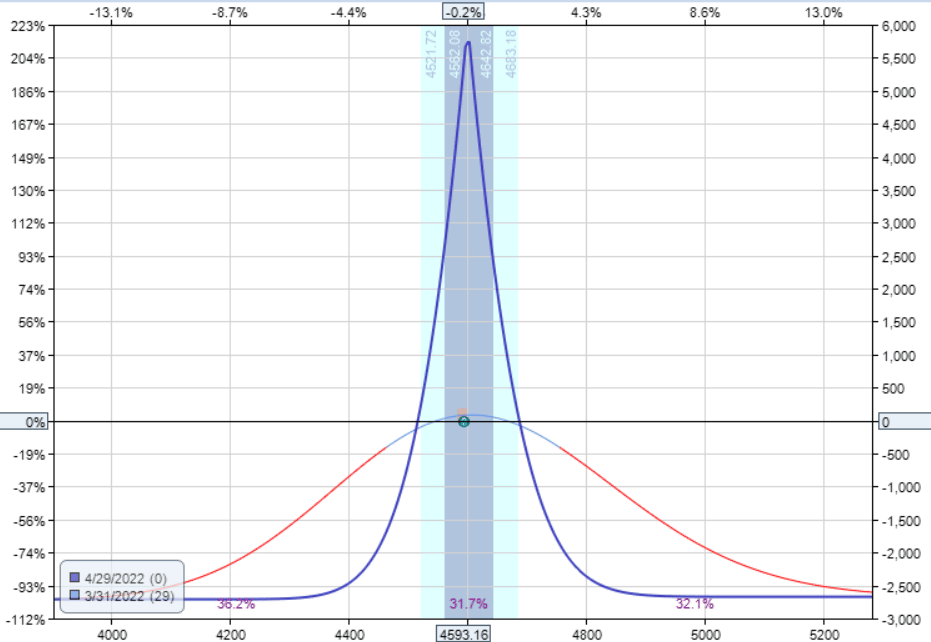
Or we can initiate a put calendar and a call calendar simultaneously and with the same strikes. For example:
Date: March 31, 2022
Price: SPX @ 4593
Sell one Apr 29 SPX 4600 put @ $88.50
Buy one May 6 SPX 4600 put @ $102.15
Sell one Apr 29 SPX 4600 call @ $80.20
Buy one May 6 SPX 4600 call @ $93.45
Debit: –$2690
The payoff graph looks just like a calendar because it is really just two calendars on top of each other
source: OptionNet Explorer
Some investors call this a calendar straddle.
A straddle is a put option and a call option at the same strike and expiration.
We are selling a straddle with April 29 expiration.
And we are buying a straddle with May 6 expiration.
Double Calendars
When the price starts to move outside the calendar expiration payoff graph, some investors like to add another calendar.
On April 1, the price of SPX dropped to 4530. If we add another calendar at 4450, we get a double calendar options structure.
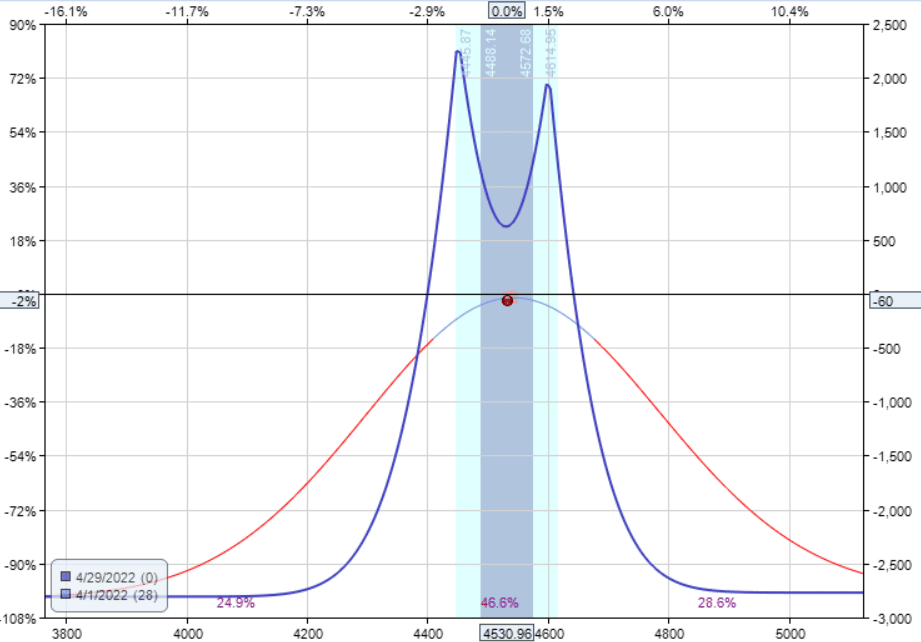
While you can place both calendars together at the same time, we like to just place one calendar and see which direction the price moves and then place the second calendar.
Diagonals
Diagonals are similar to calendars in that they have options expiring at different expirations.
Unlike calendars, diagonals have their two options at different strikes.
Here is a put diagonal on Zoom (ZM).
Date: August 31, 2022
Price: ZM at $80.82
Sell two Sep 16 ZM $70 put @ $0.82
Buy two Sep 30 ZM $65 put @ $0.99
Total debit: –$34
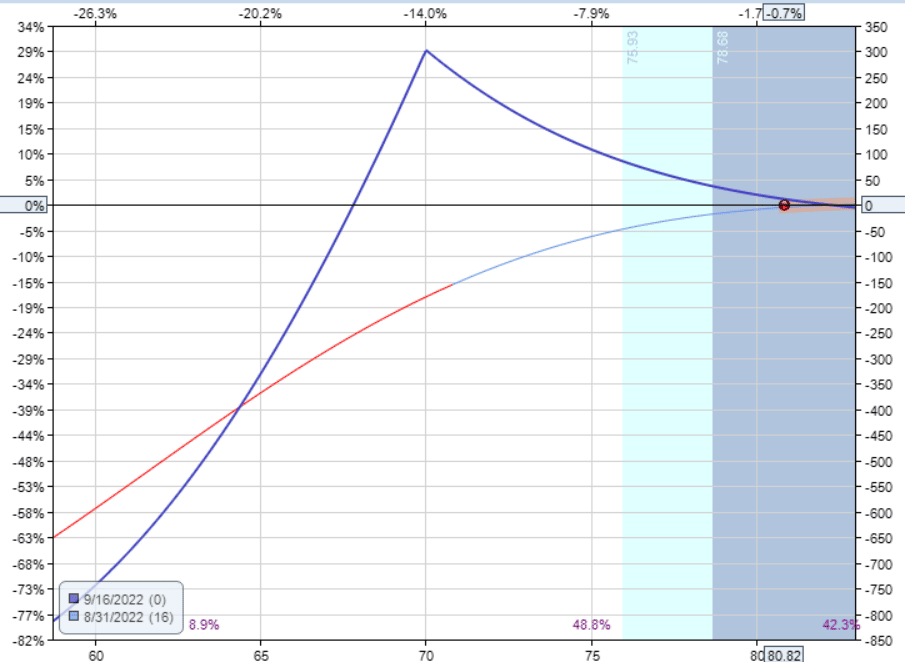
This particular diagonal has positive delta, positive vega, and positive theta.
Delta: 4.17
Vega: 1.61
Theta: 5.04
That means that it will profit if the price goes up if the IV increases, and if time passes.
Although this is just an example, you may be questioning why we are putting on a diagonal when VIX on that day is a high value of 26.
A couple of reasons:
- The VIX is the volatility of SPX. It is not the volatility of the stock like Zoom. The volatility of a stock can be affected by many things, one of which is earnings. If we look at the IV of Zoom, we see that it is at the low end of its two-month range.
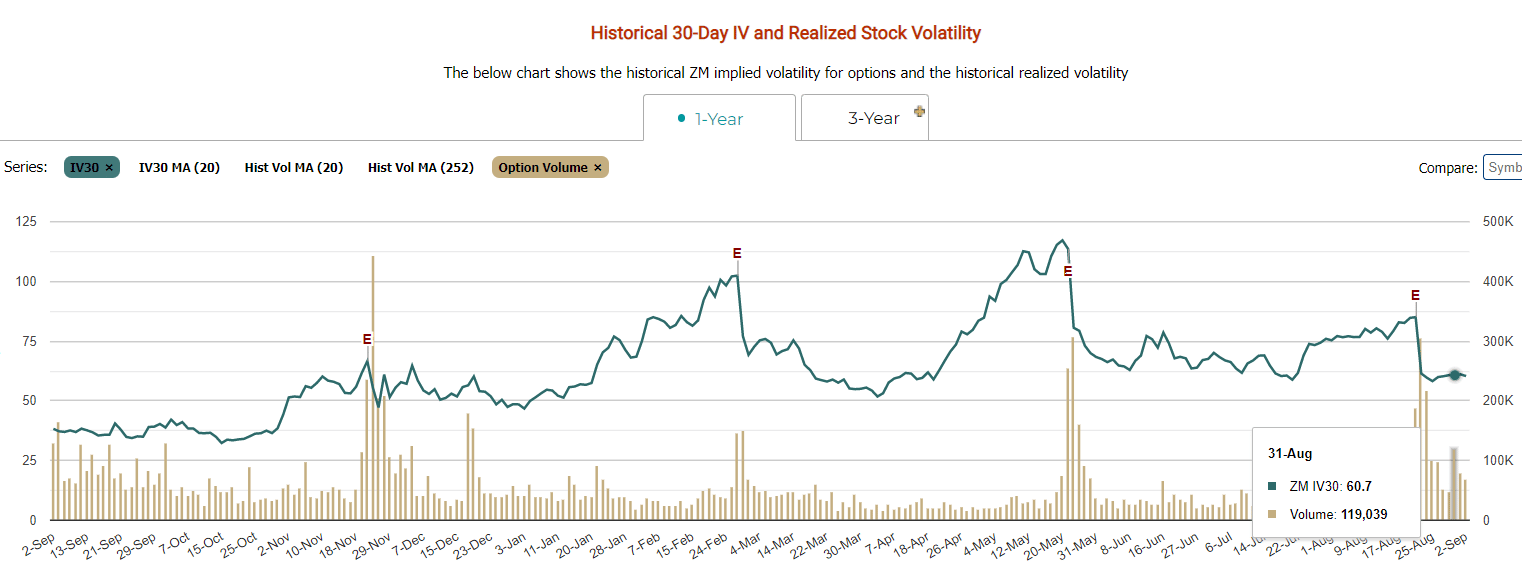
source: marketchameleon.com
Sometimes the IV of a stock does have some correlation with the volatility of the overall market. Often, the IV of a stock is low after its earnings announcement, which is the case here with Zoom.
2. The vega on this trade is quite low, which means that it is not sensitive to changes in IV. Some traders who do not have an opinion on the direction of IV changes may prefer a small vega so that volatility does not go against them.
Synthetic Covered Call
Synthetic-covered calls are also in the family of diagonals because the two options involved have different strikes and expirations.
Here is a synthetic covered call on the gold ETF GLD.
Date: August 31, 2022
Price: GLD @ $159.27
Buy one Oct 21 GLD $155 call @ $7.45
Sell one September 5 GLD $163 call 2 $0.53
Total debit: –$692
We are buying a long call at the 70 to 80 delta with an expiration about 51 days out.
This long call is the stock replacement substitute.
Then we sell a short call with a strike above the current price.
This call will have shorter expiration, such as one or two weeks.
The sale of this call brings in income to offset the cost of the long call.
The expiration graph looks somewhat like that of the covered call, except that it is curvy.
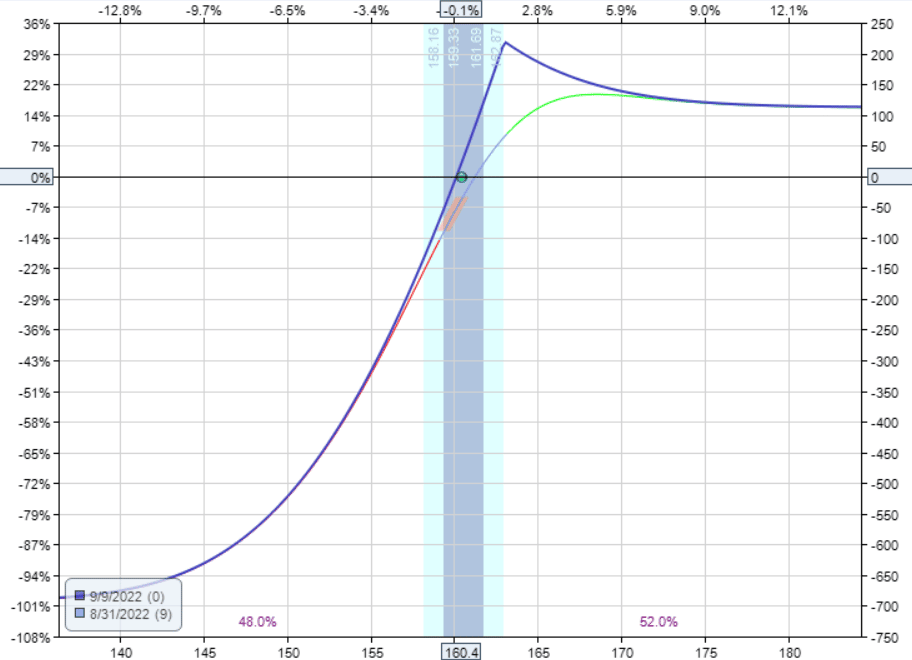
It has a max loss on the downside equal to the total debit paid (in this case, $692).
The trade was initiated when the implied volatility of gold was in the middle of its volatility range.
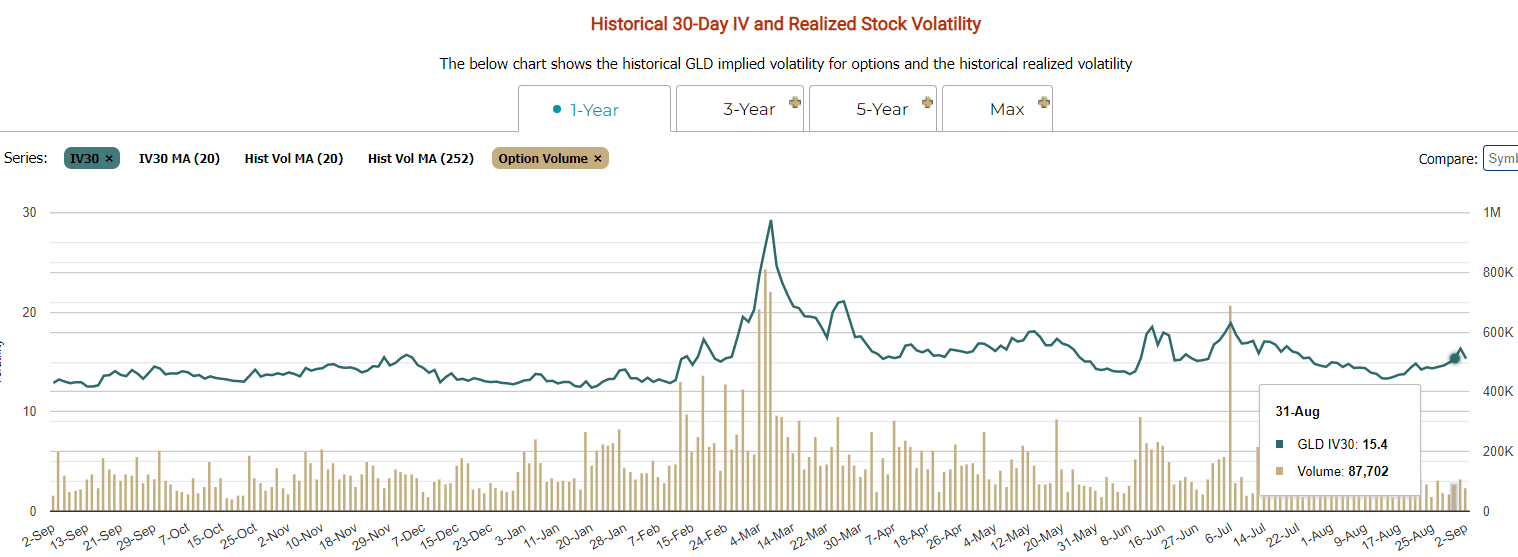
source: marketchameleon.com
Its IV is not particularly low. But that’s okay. If you look at its Greeks:
Delta: 47.8
Vega: 11.87
Theta: 3.45
You will see that its delta is four times as large as its vega.
This means that this trade’s primary driver of profit is the price movement.
Any effect of volatility changes is secondary.
You can see from the payoff graph that this is quite a bullish directional trade, which covered calls and synthetic cover calls are.
Bearish Diagonal
An investor who is bearish on a stock may do a similar diagonal but with puts instead.
Date: August 31, 2022
Price: AXP @ $154
Buy one Nov 18 AXP $175 put @ $22.98
Sell one Sep 16 AXP $145 put @ $1.39
Debit: –$2159
Delta: -58.11
Vega: 11.83
Theta: 6.33
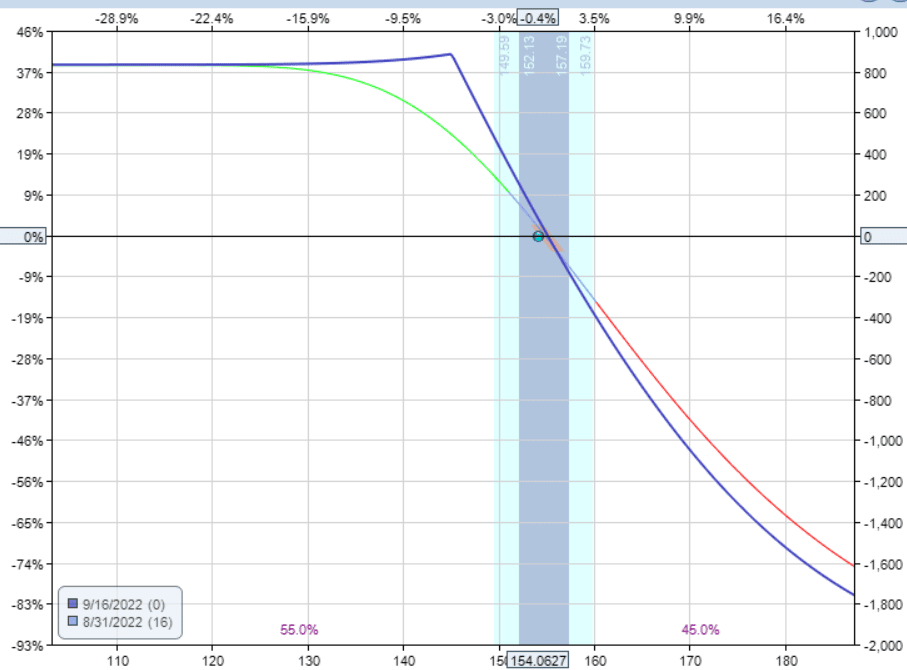
Similar to that of a covered call, when the short option expires, the investor can sell another option while maintaining the long option.
Double Diagonals
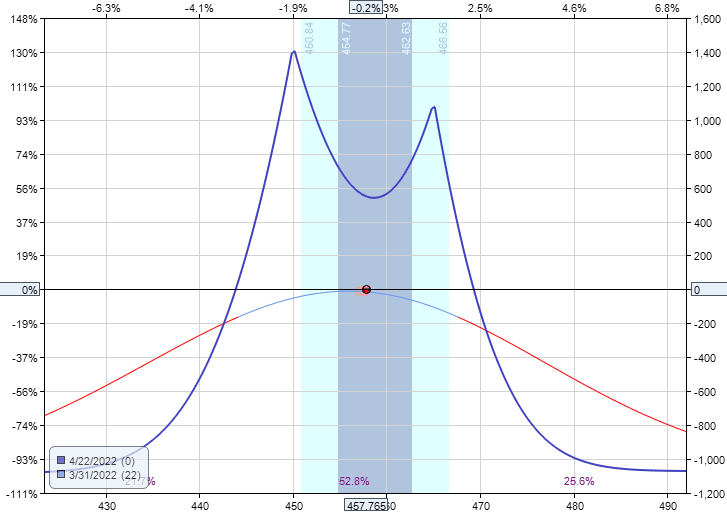
Let’s look at an example of a double diagonal on SPY, the ETF tracking the S&P 500.
Since SPY is highly correlated with SPX, we can use the VIX index to measure the IV of SPY.
Date: March 31, 2022
Price: SPY @ 457.77
Buy five April 27 SPY 448 put @ $5.05
Sell five Apr 22 SPY 450 put @ $4.75
Sell five Apr 22 SPY 465 call @ $3.56
Buy five Apr 27 SPY 467 call @ $3.41
Total debit: $78
Delta -4.36
Vega: 32.37
Theta: 18.35
source: OptionNet Explorer
The expirations of the long options and the short options are only five days apart.
The closer they are, the smaller the net vega and the less sensitive to volatility changes.
But you also get less theta.
Since this trade is placed during low IV, we could have placed the long options with longer expirations.
This will give us more theta and more vega.
We are always glad to get more theta. We are not too concerned with more vega because the low IV means that IV will likely go up to our benefit.
Unlike double calendars, double diagonals are almost always placed with both diagonals at the same time.
The upper diagonal is usually done with the calls.
And the lower diagonal is usually done with the puts.
This is to keep the options out of the money at the time of trade initiation.
While it is common for double diagonals to have positive vega, some double diagonals can have negative vega — as in this next example:
Trade Details:
Date: March 31, 2022
Price: SPY @ 4593
Buy five April 27 SPY 443 put @ $4.02
Sell five Apr 22 SPY 450 put @ $4.75
Sell five Apr 22 SPY 465 call @ $3.56
Buy five Apr 27 SPY 470 call @ $2.41
Total Credit: $940
Delta -3.92
Vega: -12.64
Theta: 29.86
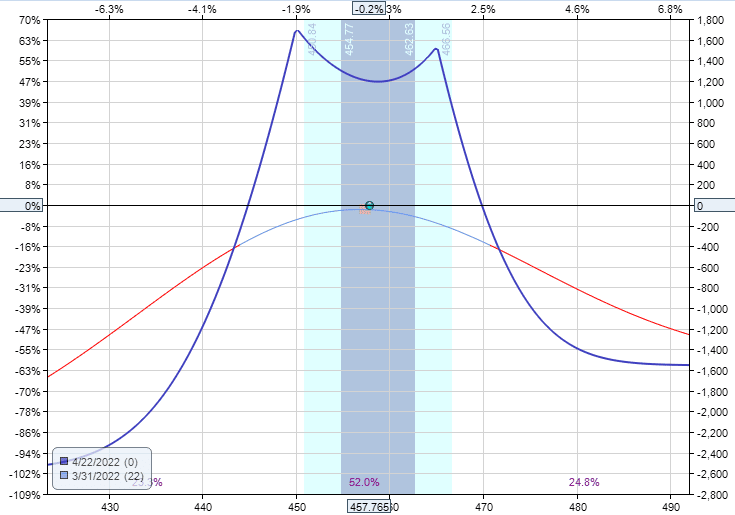
This is achieved by having a greater distance between the strikes of the call diagonal and a greater distance between the strikes of the put diagonal.
The width of the put diagonal was made wider than the call diagonal in order to get over delta closer to zero.
The graph may look more unbalanced because of this, but the deltas are more balanced.
Another interesting thing is that this double diagonal is initiated with a credit instead of debit.
This double diagonal is somewhat similar to that of an iron condor.
Conclusion
Calendars and diagonals are good strategies for low IV environments.
Double diagonals are quite interesting as they can be constructed for either high volatility (make them negative vega) or low- volatility environments (make the positive vega).
As we start on our options journey, we primarily look at delta and monitor the price movement of the underlying.
And we should since this is the primary driver of wins and losses.
As we become more experienced, we take volatility into account when deciding which strategy and which strikes and expirations to use.
Hopefully, this article has given you insights on how to use volatility in the decision-making process.
We hope you enjoyed this article on low IV options strategies.
If you have any questions, please send an email or leave a comment below.
Trade safe!
Disclaimer: The information above is for educational purposes only and should not be treated as investment advice. The strategy presented would not be suitable for investors who are not familiar with exchange traded options. Any readers interested in this strategy should do their own research and seek advice from a licensed financial adviser.


