


Today we are looking at the indecision candlestick. We will look at what they mean and how to trade them. Let’s get started.
Contents
- Introduction
- Indecision Candles And Patterns
- How Indecisions Candlestick Occurs
- What Do Indecision Candlesticks Mean?
- Indecision Candlesticks For Reversals
- Trend Continuation Signals
- Spinning Top Pattern
- Bottom Line
Introduction
Markets do not always trend. Periods of balance between bears and bulls is a common phenomenon that results in financial instruments struggling for direction.
The lack of direction in price action signals a fierce battle between market participants resulting in unique candlesticks.
Indecision candlesticks are usually the results of an intense battle between buyers and sellers trying to push the price in each direction.
The patterns that come about due to indecision candlesticks can provide hints to the direction price are likely to move in the long run.
Indecision Candles And Patterns
Long wicks and small bodies normally depict indecision candlesticks.
The small bodies and wicks indicate buyers tried to push the price higher but experienced strong resistance from sellers.
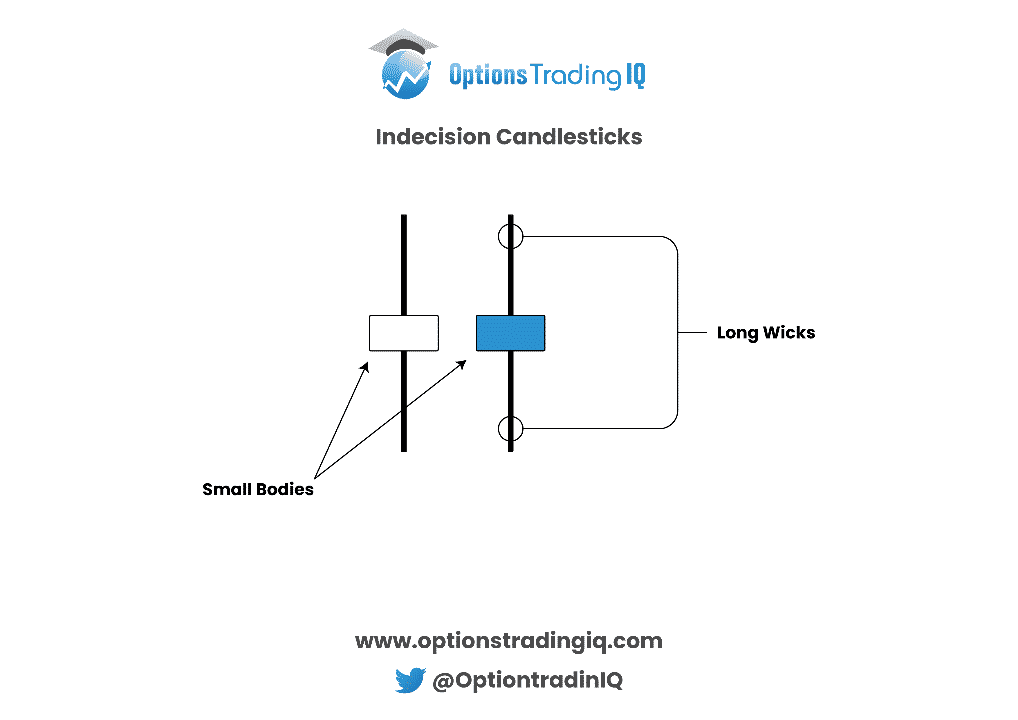
Likewise, as sellers tried to push prices lower from the opening price, they also experienced strong opposition from buyers, which resulted in price bouncing and closing close to the opening price.
The long wicks in either side, signals price tried to move both up and down during the trading session but faced strong opposition.
The market struggling to maintain either higher or lower prices amounts to indecision.
How Indecisions Candlestick Occurs
If the price of a security is in a downtrend, there may reach a point whereby buyers feel the price has moved lower significantly, probably to oversold territory.
In this case, they may start to enter the market, betting that the price will reverse.
The placing of buy orders as the price was moving lower often results in a significant reduction in downward momentum.
In most cases, sellers fight back in trying to prevent the price from correcting higher.
The result is usually a standoff between buyers and sellers, resulting in increased volatility.
The lack of an outright winner results in price opening and closing near where it opened.
The indecision candlesticks that come about signal the imbalance, resulting in price being relegated to a range.
An imbalance will only come when buyers or sellers accrue sufficient momentum to push the price in one direction.
What Do Indecision Candlesticks Mean?
Indecision candlesticks indicate that buyers and sellers are active in a trading session.
Given the balance between buy and sell orders, prices often end up opening and closing at the same level.
Amid the indecisiveness, the patterns that come about can be used to predict the probable price direction.
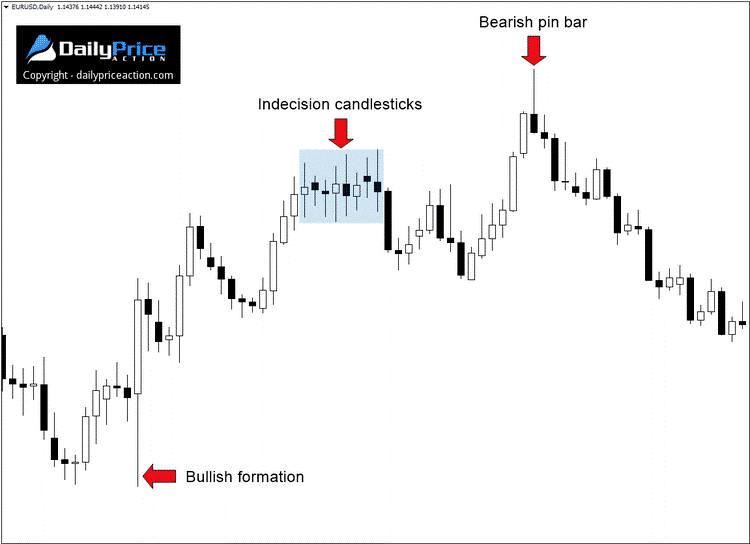
Source: Dailypriceaction.com
In the chart above, the EUR/USD was in an uptrend until indecision in the market resulted in price moving in a range.
The chart above clearly shows small-bodied candlesticks with relatively long wicks in both directions.
The indecision candlesticks are a common phenomenon at the tops and bottoms of long-running trends.
The candlesticks form as the price comes to support or resistance levels triggering a fierce battle between buyers and sellers.
The candlesticks also form as new orders both on the buy and sell-side flood the market resulting in a balance in either direction.
The high order volume from buyers and sellers results in large amounts of money exchanging hands, creating indecision candle structures.
The standoff between the buyers and sellers often results in the price remaining range-bound as no force has the momentum to push the price in a given direction.
The longer the consolidation, the more powerful the breakouts tend to be, once buyers or sellers win the battle
Indecision Candlesticks For Reversals
Indecision candlesticks often act as excellent price reversal signals.
When such candlesticks occur as the price is trending in a given direction, the same could signal that momentum is fading away.
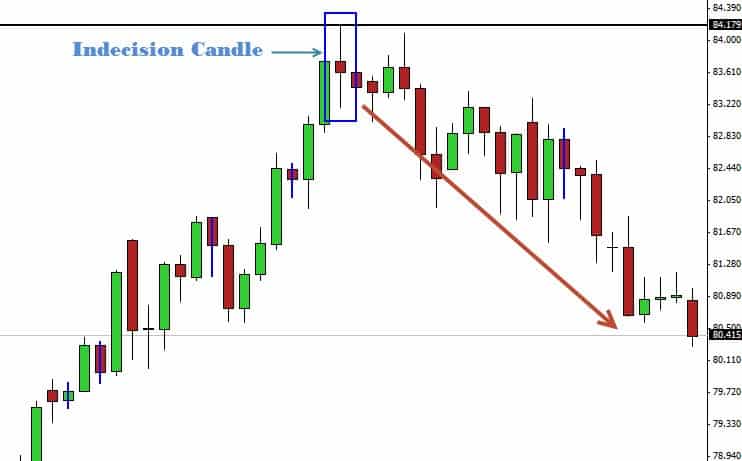
Source: Theforexguy.com
Consider the chart above whereby the price was trending up until an indecision candlestick occurred at the top.
The indecision candlestick affirms buyers are losing momentum, and the sellers are increasingly coming into the fold.
The indecision indicates an intense battle between buyers who tried to push the price higher but failed. Likewise, sellers attempted to push prices lower but also failed.
The result was the price closing near where it opened.
The second candlestick, after the indecision candlestick only went to confirm that sellers are gaining momentum and that a reversal is in play.
Afterward, sellers won the battle, consequently pushing the price lower.
Trend Continuation Signals
While indecision candlesticks do signal potential reversals whenever they occur, they can also signal trend continuation.
Therefore, they also act as reliable price continuation signals.
Given that indecision candlesticks represent indecisive price behavior that halts price movement, once certainty creeps back, the result could be price moving in the direction of the underlying trend.
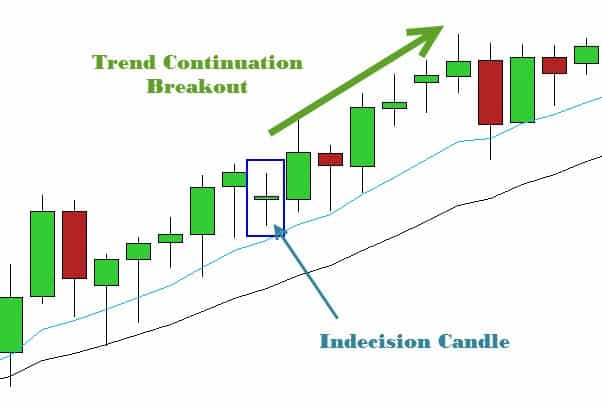
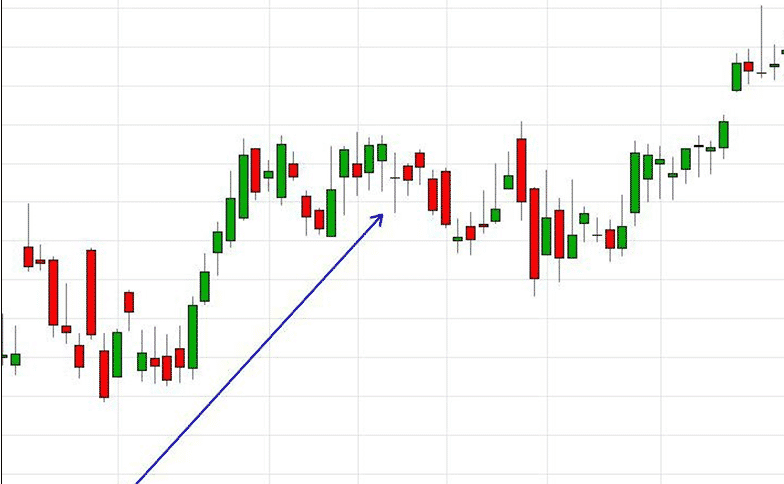
Source: Theforexguy.com
The chart above shows an indecisive candlestick that appeared in the middle of an uptrend. Buyers and sellers battled it out for direction.
In the end, buyers ended up winning, resulting in price resuming the uptrend.
Spinning Top Pattern
Spinning top indecisive patterns form at the top of an uptrend or the bottom of a downtrend.
Whenever such patterns come into play, they result in a battle between buyers and sellers, with neither able to push the price up or down.
Source: Beyond2015.org
The chart above shows that prices resorted to trading in a range, oscillating up and down without any clear direction.
The range-bound market held for some time before buyers overpowered sellers and pushed price higher.
Traders commonly use the spinning indecisive pattern to measure market volatility.
Given the indecisiveness in play, it becomes extremely difficult to predict the direction that the price is likely to move once the consolidation comes to a halt.
Bottom Line
Indecision candlesticks occur during times of balance between buyers and sellers.
As the two struggle to push the price in either direction, candlesticks with small bodies and long wicks emerge.
The appearance of these candlesticks’ signals indecision in the market, with prices struggling to move in either direction.
The balance between buyers and sellers results in price moving in a range until an imbalance occurs, forcing price to reverse or move in the direction of the underlying trend.
Trade safe!
Disclaimer: The information above is for educational purposes only and should not be treated as investment advice. The strategy presented would not be suitable for investors who are not familiar with exchange traded options. Any readers interested in this strategy should do their own research and seek advice from a licensed financial adviser.


Nice explanation