


Elliottt wave theory is a type of technical analysis that is based on the idea that certain patterns repeat consistently over the long-term.
Let’s take a look:
Contents
- Introduction
- The Theory
- The Motive (Impulse) Waves (Wave 1 to 5)
- The Corrective Waves (Waves A, B, and C)
- Fibonacci Numbers
- Surfing the Elliott Wave
- Much Ado About Nothing
- The Verdict
Introduction
So, you are into your forced retirement due to health issues.
You have been an accountant, finance professional, and trader for as long as you can remember.
Surely, you risk being cursed into oblivion.
What do you do?
You do a colonel Sanders although you do it before him.
You get down in your house and chart out stock data for several decades manually.
Yes, because in the 1930s, you did not have advanced charting tools available today.
As you do it over the long-term, your graph shows you a pattern of 5 trend lines in one direction and 3 trend lines in the opposite direction.
This pattern seems to be repeating over the period and can be one of the ways to predict stock price movements.
This particularly interesting gentleman was Mr. Ralph Nelson Elliott and hence the pattern was named Elliott wave.
He used the wave patterns to predict stock prices hitting lows in 1935 and received accolades (and money) for the same.
This led to the development of Elliot wave theory which is one of the most important technical trading tools used today.
The patterns were attributed to the investor behavioral psychology and can be a result of the herding behavior in the stock market.
Now the good thing is that this pattern seems to occur over the short term as well as long term periods.
The Theory
The theory states that price movements in the market repeat themselves over time due to investor sentiment.
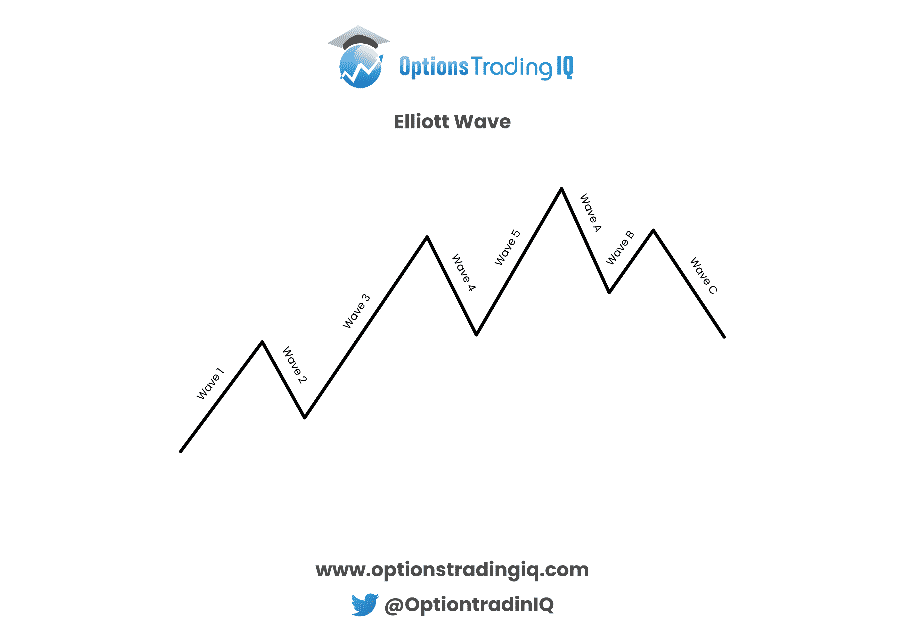
The Elliott waves are divided into two wave or pattern types:
- Motive waves – move in the direction of an ongoing trend and usually consist of 5 waves.
- Corrective waves – are a set of three waves that have a movement opposite to the direction of the motive waves.
The prediction using Elliott waves is not fool proof, but some rules have been described to increase the probability of recognizing the waves.
These rules relate to the type of waves and are described here.
The Motive (Impulse) Waves (Wave 1 to 5)
The motive waves which consist of 5 waves are divided into three waves in the direction of the trend and two waves in the opposite direction.
The three waves in the direction of the trends are the “motive” waves (Wave 1, 3, and 5).
The two waves in opposite directions are also called the “corrective” waves (Wave 4 and 5).
Technical analysts should be mindful of three golden rules while recognizing the motive waves:
- Wave 2 will not retrace below wave 1.
- Wave 4 will not retrace below wave 3.
- Wave 3 will always be above wave 1 and will never be the shortest wave.
One of the things to consider is that each of the waves can be composed of several waves. The way to identify them is that motive wave will be composed of 5 sub-waves and each corrective wave will consist of three sub-waves.
The Corrective Waves (Waves A, B, and C)
The corrective waves are a set of three waves with the net movement opposite to the motive waves.
One of these waves (wave b) will be in the direction of the motive wave whereas waves A and C will be in the direction of the corrective wave.
There are no established rules for identifying the corrective waves as we have done for the motive waves.
It is also not necessary that there are three waves in the corrective wave pattern.
However, these waves can still consist of several sub waves that would follow a pattern like the primary waves.
Fibonacci Numbers
Elliott used the Fibonacci number in his theory.
The most important numbers are 38%, 50%, and 62%.
The retrace of the waves should end near these percentages of the preceding wave.
Traders set price targets based on these percentages and put in buy or sell orders at these percentages to benefit from the trend reversals.
Surfing the Elliott Wave
We see that the Elliott wave pattern consists of 5 waves.
One way to benefit from this is to identify wave formation and buy on the dips and short on the peaks.
This can be challenging because the identification of patterns can be difficult.
At the end of impulse waves i.e., the first five waves of the pattern, there is a trend reversal. Based on the trend the trader may buy or sell at this point.
Identification of 5 waves is easier than identifying if each individual wave is a sub-wave of the five waves.
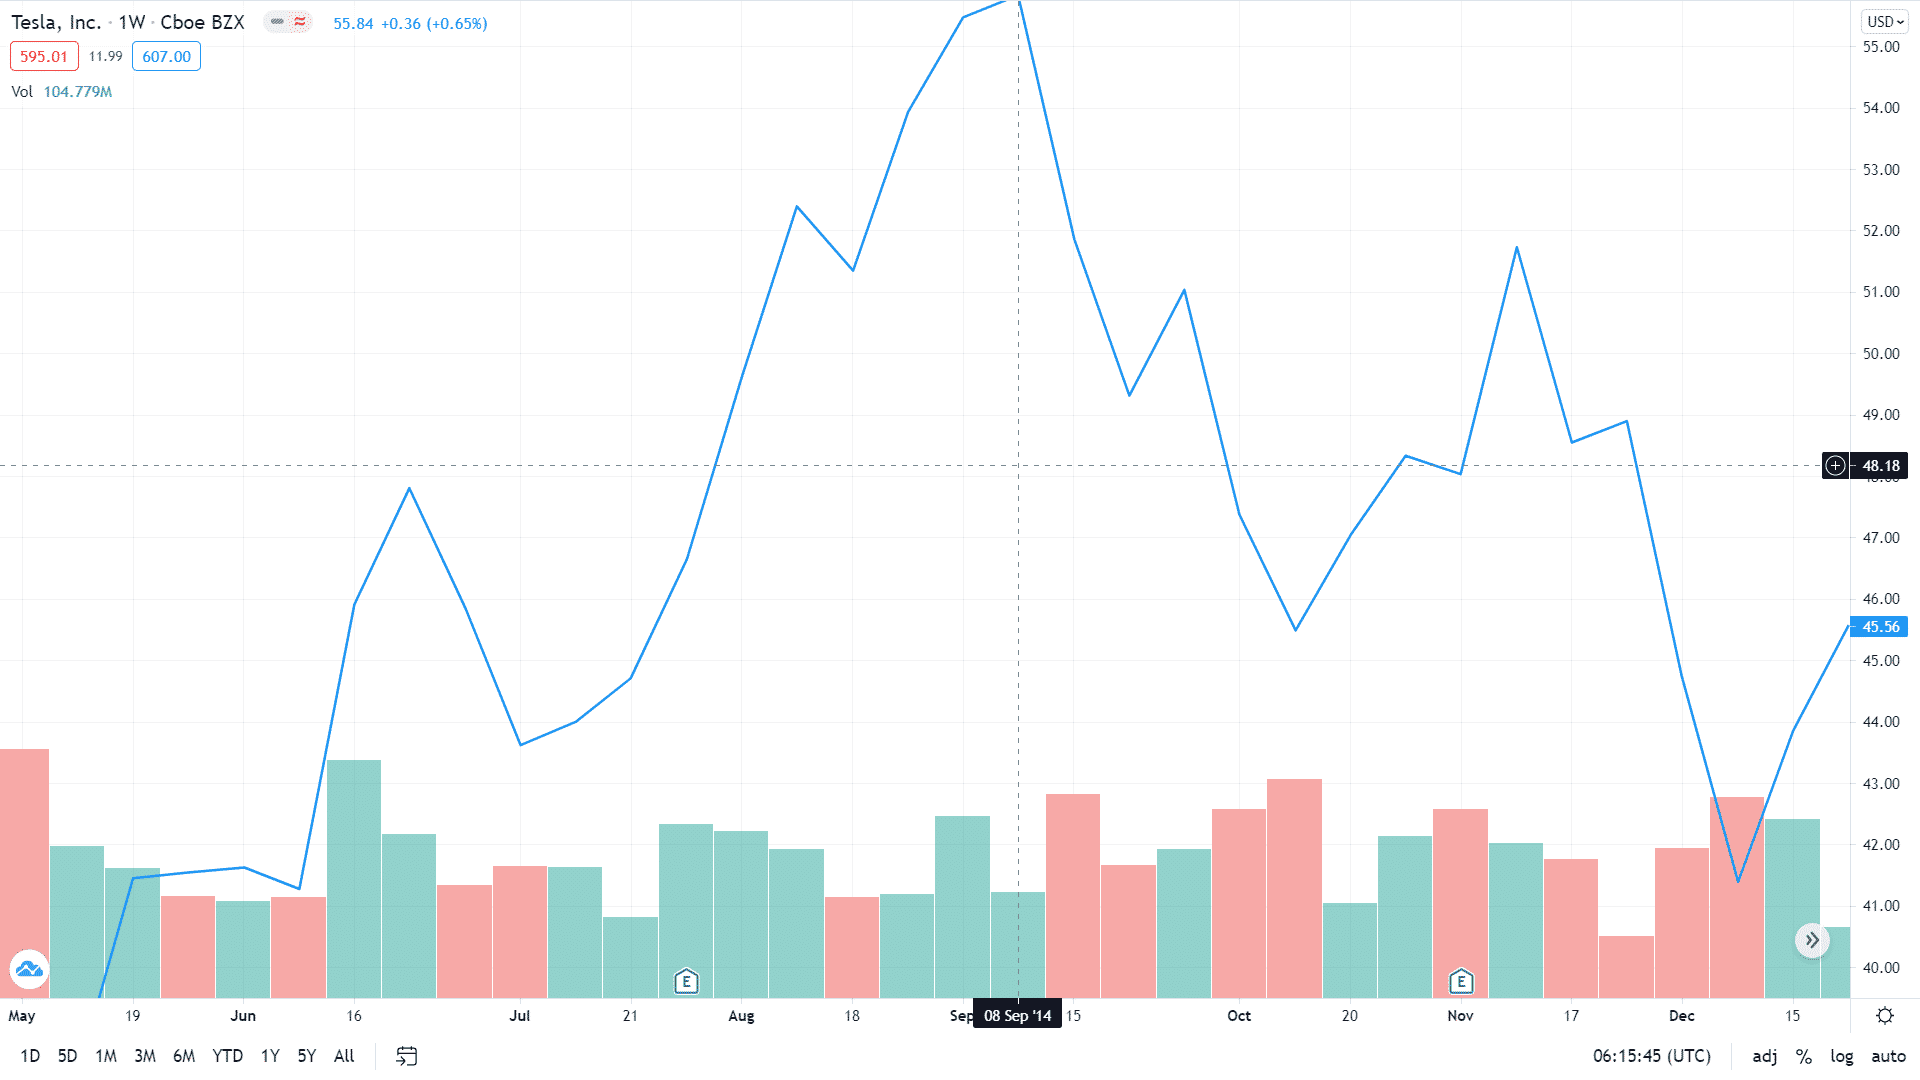
Let us see an example from Tesla in 2014. We need to refer to the price line graph.
The Elliott wave pattern starts around 9th June at $41.33.
The waves are identified as:
- 9th June – Wave 1 – $41.33 to $47.80
- 23rd June – Wave 2 – $47.80 to $43.56
- 11th Aug – Wave 3 – $43.56 to $52.36
- 18th Aug – Wave 4 – $52.36 to $51.31
- 8th Sep – Wave 5 – $51.31 to $55.81
- 22nd Sep – Wave A – $55.81 to $49.32
- 29th Sep – Wave B – $49.32 to $51.04
- 6th Oct – Wave C – $51.04 to $47.23
The pattern undergoes a correction at $55.81.
This would be a good point to short the stock or take profits on long positions.
A similar Elliott wave pattern was detected before the decline in the Bitcoin prices at the start of the May 2021 which is represented below.
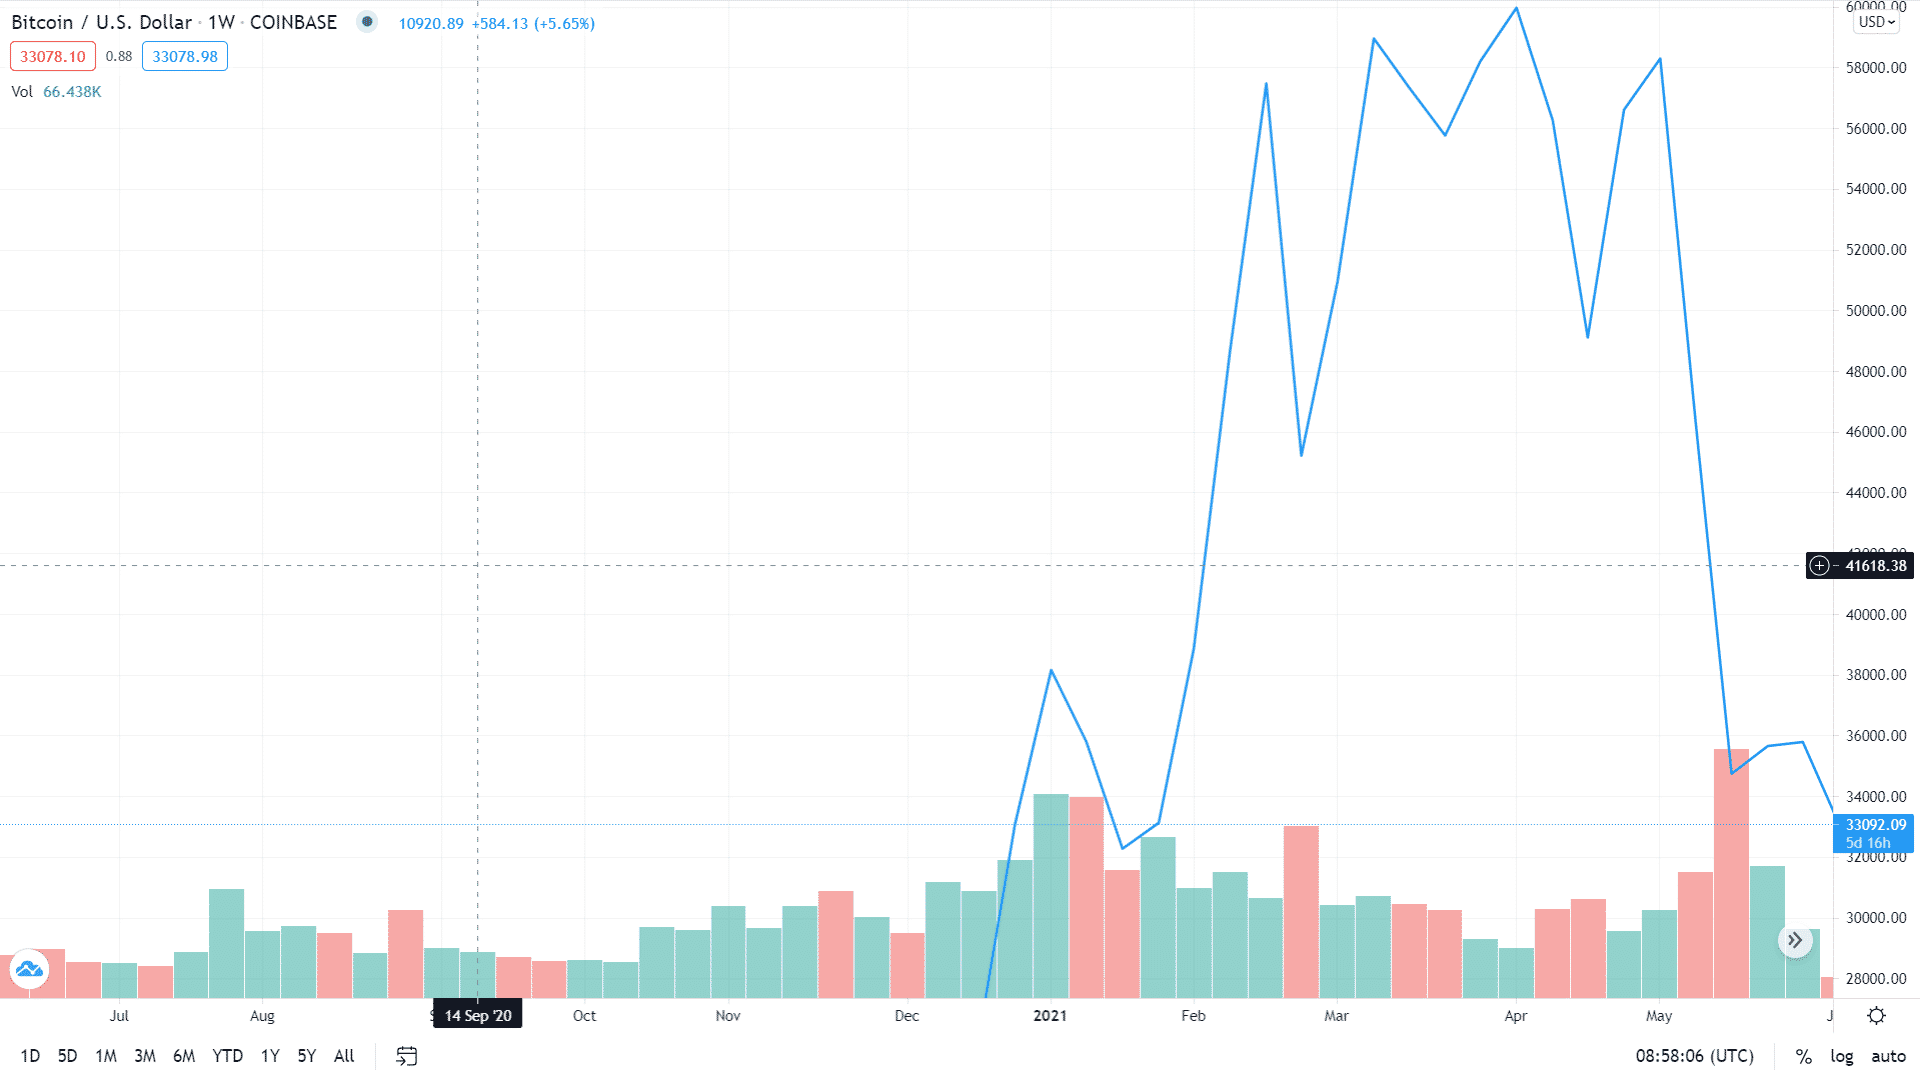
The price declined by nearly 40% from the May highs.
Correct identification of the forming Elliott wave pattern could have given a trader an indication to enter a short position or move out of the long position.
Much Ado About Nothing
So, I have talked about how Elliott wave theory can be a useful tool to make profitable trades.
However, like all technical analysis tools, it has had its share of criticism.
The primary criticism of technical analysis tools not working in efficient stock markets is always there.
In addition a number of denunciations include:
-
- Uncertainty in prediction – The Elliott wave pattern can consist of waves within the wave (something akin to Inception).
It is hard to differentiate between the primary and the secondary waves.
In fact, advanced technical analysis charting techniques have provided up to 8 levels of waves. This becomes too cumbersome for new traders.
- Uncertainty in prediction – The Elliott wave pattern can consist of waves within the wave (something akin to Inception).
-
- High level of Subjectivity – The waves do not always follow the rules regarding their size and retracements.
Since the theory was proposed several structural changes have occurred which have impacted world trade as well as the stock market.
This has led to weakened predictive ability from the theory.
- High level of Subjectivity – The waves do not always follow the rules regarding their size and retracements.
-
- Difficulty in recognition – It is possible to identify the Elliott wave only after it has passed.
Traders can guess if a proper Elliott pattern is being formed only after two or three waves, but they can never be certain.
This may lead to losses due to wrong recognition.
- Difficulty in recognition – It is possible to identify the Elliott wave only after it has passed.
-
- No academic backing – The theory has not been backed by extensive research and there is an absence of economic principle to support it completely.
-
- Difficulty in Quantification – The Fibonacci sequence and the retracement percentages based on the Fibonacci sequence is seldom followed.
The ratio between the waves does not have any specified ratio.
This results in increased recognition of the wave patterns.
- Difficulty in Quantification – The Fibonacci sequence and the retracement percentages based on the Fibonacci sequence is seldom followed.
-
- Extensive Resources – Recognition of Elliott wave patterns are not as easy as they sound.
They require advanced charting tools which are usually out of reach of a small-scale investor.
In the recent past, machine learning tools have been integrated with the charts to predict using Elliott waves.
They have provided some promising results.
However, with more and more investors making use of the same, this advantage is likely to vanish.
- Extensive Resources – Recognition of Elliott wave patterns are not as easy as they sound.
-
- Time consuming – Even if you can accurately identify patterns, the patterns may last more than your investment time horizon.
This may lead to uneasiness and making irrational decisions.
- Time consuming – Even if you can accurately identify patterns, the patterns may last more than your investment time horizon.
The Verdict
Elliott wave theory can be a good indicator of market movements and can help with market trend reversals.
This helps to make profitable trades.
However, precaution is the key here.
The recognition of waves needs to include sub-waves within each primary wave.
Therefore, it is necessary to make use of other technical patterns (RSI, MACD, oscillators, Bollinger bands, etc.) in conjunction with Elliott waves. While not fool proof, it may increase the probability of making the correct decision.
Just like all trading tools, you need some time to be able to use Elliott wave theory with considerable ease.
It is better to invest smaller amounts in the beginning and then increase your investments as you get used to it and develop intuition over time.
Trade safe!
Disclaimer: The information above is for educational purposes only and should not be treated as investment advice. The strategy presented would not be suitable for investors who are not familiar with exchange traded options. Any readers interested in this strategy should do their own research and seek advice from a licensed financial adviser.


