


The bullish calendar spread is just like any other calendar spread, except that it is placed at some distance above the current price of the underlying.
It can be used by itself as a directional trade.
Or it can be used as a hedge to an existing larger options structure that is being threatened.
Let’s look at the former scenario first.
Contents
- Using the Bullish Calendar as a Directional Trade
- P&L of Calendar
- The Greek Theta
- The Greek Delta
- The Greek Gamma
- The Greek Vega
- Using a Bullish Calendar to Adjust Iron Condors
- Using a Bullish Calendar to Adjust Butterflies
- FAQs
- Conclusion
- Related Articles
Using the Bullish Calendar as a Directional Trade
Take a look at Eli Lily (LLY) on August 12, 2022.
Before that day, LLY was in a big decline with large red candles.
Then it went into a consolidation range, evidenced by much smaller candles and wicks on both ends.
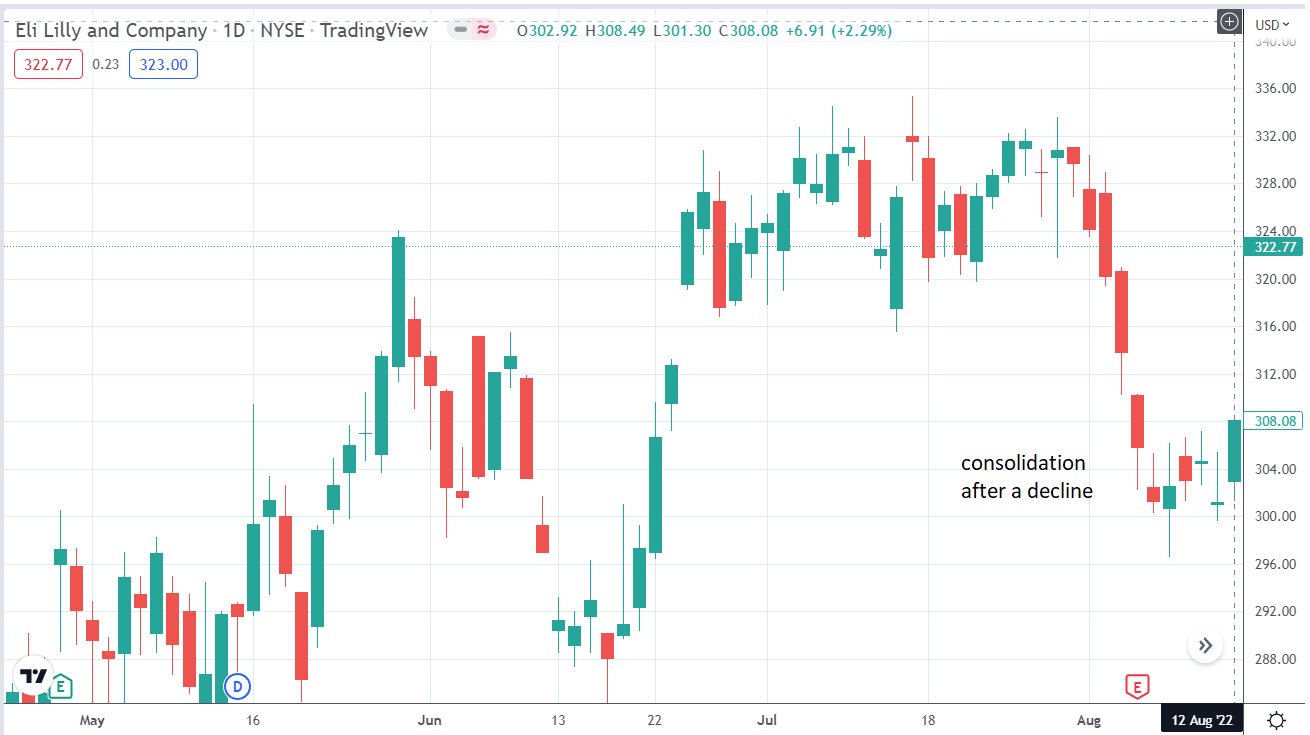
On August 12, LLY broke out of the consolidation range on the upside and is about to close near the top of the day’s range (an indication of bullish sentiment).
Suppose a trader believes LLY is about to reverse upward from the consolidation range.
One way to capture that move is to use a bullish calendar targeting the price to go to the $315 level.
Date: August 12, 2022 (at the last 10 minutes of the day)
Price: LLY at $307.85
Sell three Aug 26 LLY $315 call @ $3.27
Buy three September 2 LLY $315 call @ $4.48
Total Debit: $363
Here is the payoff graph as modeled by OptionNet Explorer:
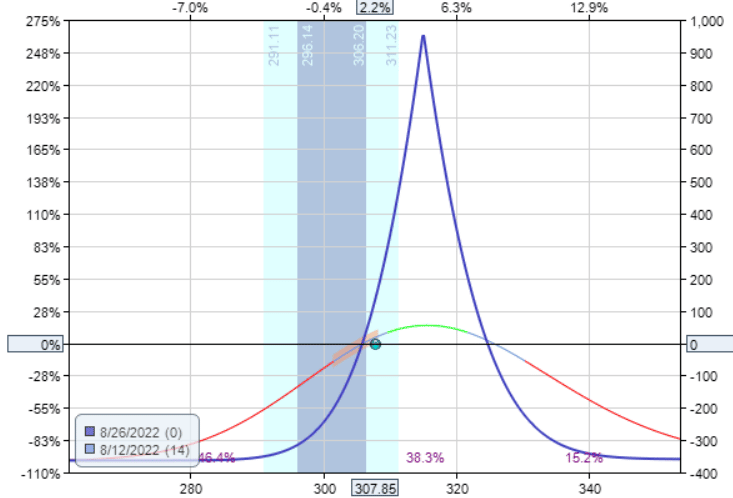
The short call has two weeks to expiration. And the long call has three weeks to expiration. The call that we sold is the one that expires sooner.
This option is known as the “front option” or the “front leg.”
The call that we bought is always the one that expires later.
This is known as the “back leg.”
This is the protective option used to limit our losses if we lose big on the front option.
Exit Strategies
The calendar trade ends when the front leg expires.
However, traders can and often do exit the trade earlier than that.
In our example, the difference in expiration between the short and long calls is one week.
The shorter this difference in relation to the duration of the short option, the more tall and narrow the calendar becomes.
For stocks like Eli Lilly, the smallest difference is one week.
The difference can be made even shorter for indices, but anything less than four days difference is not recommended.
A tall narrow calendar has a better reward-to-risk ratio than a short wide calendar.
In our example, the maximum theoretical reward from this trade is $950 if the price lands at exactly $315 at expiration.
The max loss in any calendar is the debit paid for that calendar (assuming that neither of the option legs has been adjusted or moved).
In our example, the debit is $363.
That gives our example trade a reward-to-risk ratio of 2.6.
$950 / $363 = 2.6
Short and wide calendars will have a lower, less favorable reward-to-risk ratio.
However, because they are wider, they have a higher probability of profit.
P&L of Bullish Calendar
A calendar’s profit and loss (P&L) jumps around a lot throughout the duration of the trade.
This is because the value of the short and long calls changes independently as the price of the underlying moves.
As the price of the underlying moves, the implied volatility of the front and back leg changes independently, affecting the options’ value.
Some traders like to just watch the P&L and take profit at their discretion.
Other traders like to put in a good-to-cancel order to take profit in case the P&L swings in their favor.
The amount of take-profit is up to you.
If you have multiple contracts (three contracts in our case), you can set different take-profits for each of the contracts.
In our example, let’s take profit at 50% of the debit paid.
0.50 x $363 = $182
So, we want to capture a profit of $182 from this trade.
This profit target would have been hit the very next trading day after the weekend when LLY went up, as speculated.
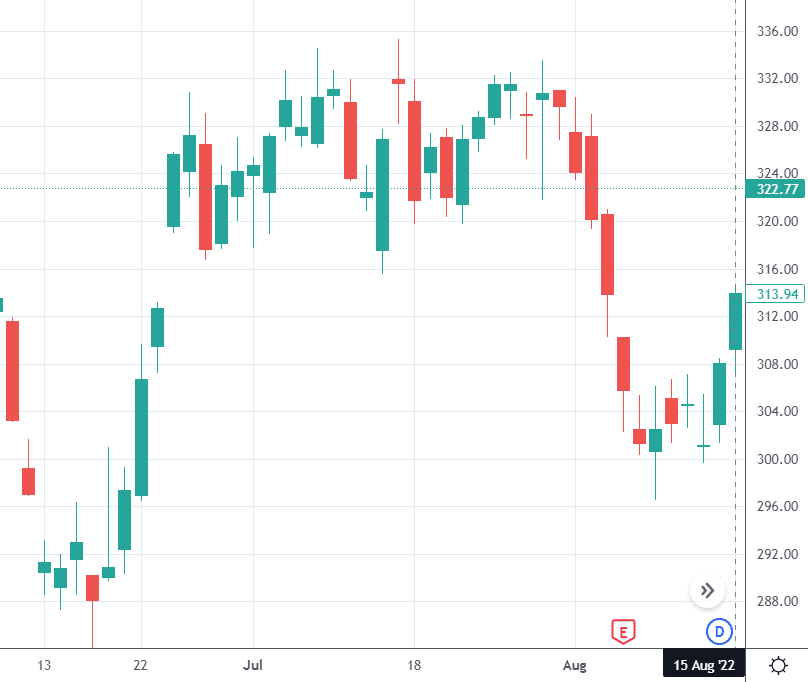
Note that the price never made up to $315 that day.
However, the calendar still was very profitable, as can be seen on the payoff graph:
The Greek Theta
What happens if the trader did not take profit but instead waited another day?
On August 16, the price of LLY still did not reach $315 but still stayed inside the payoff graph of the calendar.
The profit of the calendar spread increased to $267 due in part to the Greek theta.
The calendar makes money as time passes — as long as the price stays within a certain range inside the payoff graph.
Theta is typically positive of calendars (as long as the price is close to the option strikes).
Right now, theta is positive 15.5, meaning that the calendar should make $15 a day, provided everything else stays the same.
Theta is changing all the time.
As time gets closers to expiration, theta increases even more.
The Greek Delta
Right now, the Greek delta is showing a value of 8.
That means that the calendar will profit if the underlying price increases.
A negative delta means the calendar will profit if the underlying price decreases.
A value of 8 means it should profit $8 for every one-point price increase.
The Greek Gamma
Let’s see what happens if the trader waits another day.
On Wednesday, August 17, the price of LLY went up to $320.
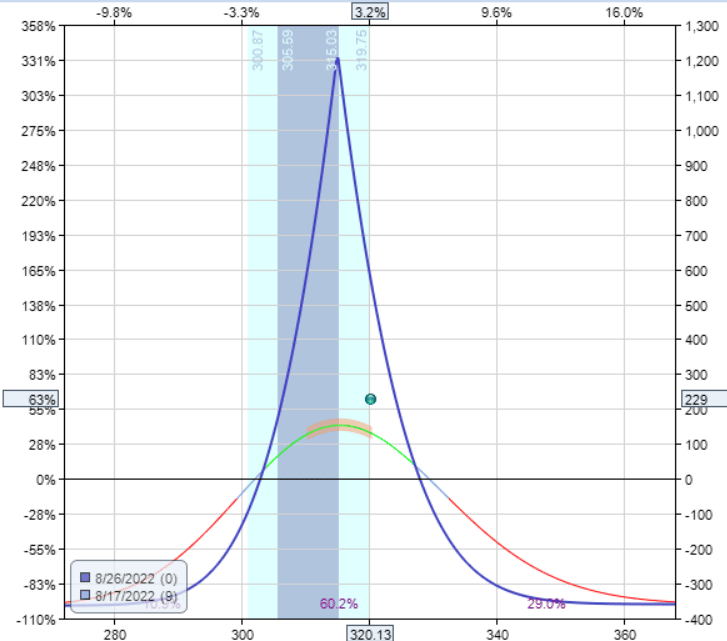
But the profit of the calendar dropped to $229.
What happened?
Theta was positive, and as time passed, we should have made money due to theta.
Delta was positive, and the price went up; we should have made money due to delta.
Why did we lose a bit of profit?
That’s correct about theta. Its value increased to 21.91.
Generally speaking, theta is the most predictable of all the Greeks.
The problem is with delta. It is now showing a value of -8, which means that we now lose money if the underlying price goes up.
This makes sense because the price of LLY has overshot our target of $315.
A negative delta means that the calendar prefers the stock to go back down in price.
The delta can change a lot in one day. It went from a positive 8 to a negative 8.
The Greek gamma measures the amount of change that can occur in delta.
Right now, gamma is -1.55.
When theta is positive, gamma is negative.
The larger the magnitude of gamma, the more that delta can change.
As we get closer and closer to expiration, the value of gamma increases.
That means that a small change in the underlying price can cause a large change in the P&L of the option spread.
For many traders, that means that if they have good profits already and it is getting close to expiration, they tend to take the profit and exit the trade before gamma takes it away.
The current profit of $229 is a 63% return on the initial debit invested.
There are nine days left till the expiration of the front option.
The price of the stock is relatively close to the strikes of the calendar. This would be a good time to take profit.
The Greek Vega
The position vega of a calendar is usually a positive value.
This value is determined by the implied volatilities of the front and back options.
A positive vega value means that if the aggregate implied volatility of the calendar increases, the calendar should make money — in theory, and if nothing else changes.
A larger vega value means that the options structure is more sensitive to changes in implied volatility.
The greater the difference between the front option expiration and the back option expiration, the larger the vega value will be.
And hence, the calendar will be more sensitive to implied volatility changes.
The expiration graph does not change for many options strategies as implied volatility changes.
For the calendar, this is not the case.
The expiration graph is not fixed.
It is only an estimate of the P&L at the time when the front option expires.
As implied volatility increases, the expiration graph will expand.
As implied volatility decreases, the expiration graph will shrink.
The calendar profits when the implied volatility increases and when the expiration graph expands.
In general, when the price of the underlying goes down, the implied volatility increases.
And when the price goes up, the implied volatility decreases, which should not be good for the calendar.
Yet, our bullish calendar profits when the price goes up.
This is because delta trumps vega. Delta is usually the largest driver of an option’s profits.
This calendar profits because the price moved from somewhat outside the expiration graph to the inside center of the expiration graph.
The effects of vega and theta are secondary.
Using a Bullish Calendar to Adjust Iron Condors
In our adjustment guide for iron condors, adjustment technique #7 uses the bullish calendar to defend an iron condor as the price moves up.
You might want to go back and review that technique.
It is especially helpful if you want the positive vega of the calendar to help balance the negative vega of the iron condor.
Adding a calendar can help if you believe that implied volatility will increase in the near future.
Using a Bullish Calendar to Adjust Butterflies
The same concept can be applied to defending other options strategies.
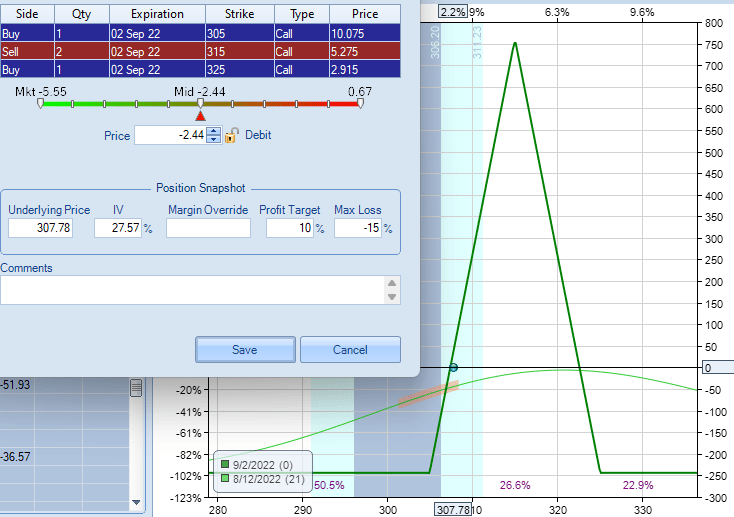
Suppose we have a non-directional butterfly on the RUT where we want the price to stay where it is and profit from theta decay.
This is the graph at the start of the trade on July 18, 2022.
Several days later, on July 22, the price has gone up and is starting to move outside the butterfly expiration graph:
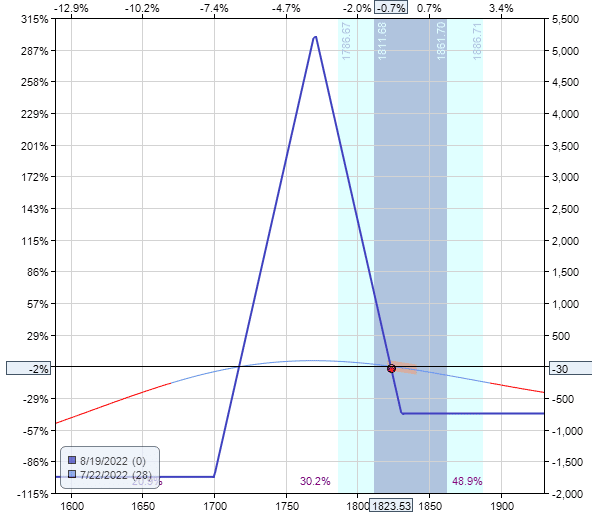
Delta is -3 and theta is 15, and vega is -30 at the time.
By adding a bullish call calendar centered at 1870, we get the following graph.
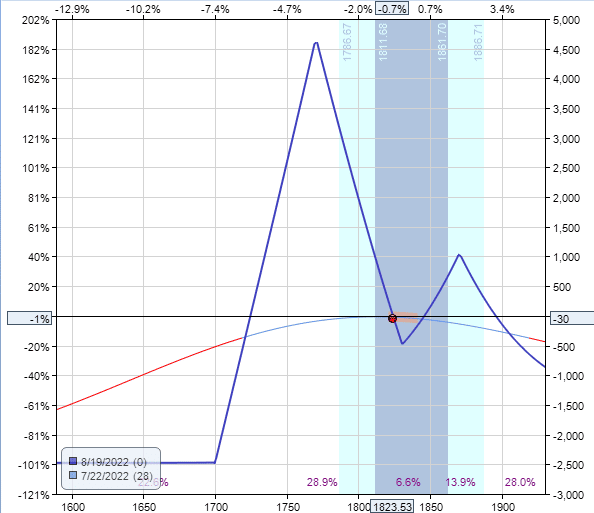
This calendar costs a debit of $745.
This adjustment decreases the delta down to -1, which flattens the T+0 curve and increases theta to 20. Vega is also neutralized down to -3.7.
Stepping forward in time, on July 29, the price of RUT continued to go up to 1875.
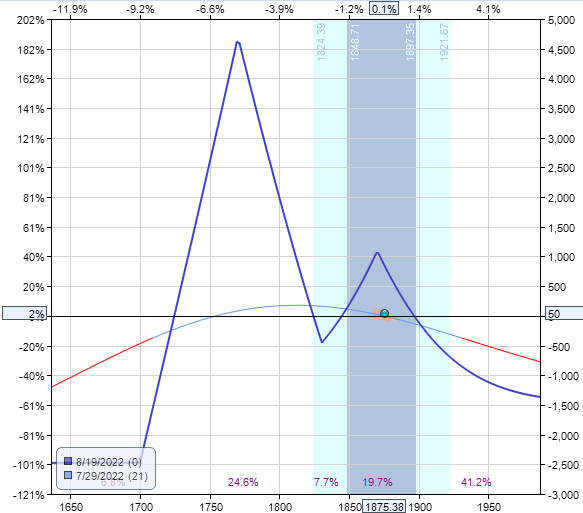
Delta is too negative at -5.5, and the price threatens to move up outside the fly and calendar option complexes.
The trade has a profit of $50, so one can just exit the trade and take the small profit.
There are still 21 days to expiration.
So another option is to move the bullish calendar up.
We sell the calendar for $920, which takes in a profit of $175 on the calendar itself.
And buy another calendar further up at 1920 strikes for a cost of $805.
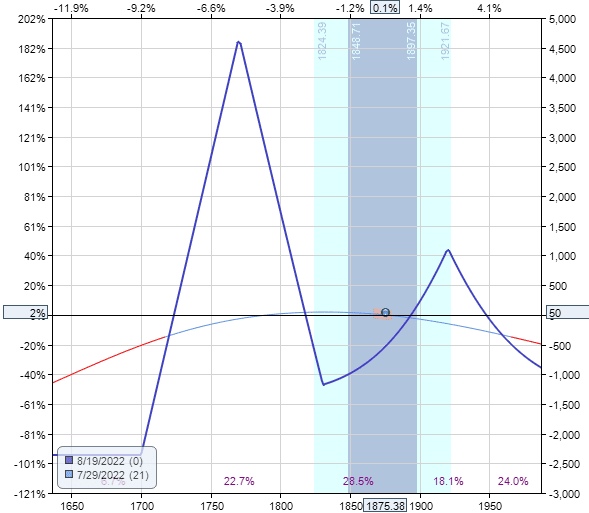
Another way of thinking about it is that we are rolling the calendar up for a credit of $115 = $920 – $805.
It is often the case that we get a credit in these situations because we are buying a calendar further away (which costs less).
We got paid $115 to move our calendar up, which reduces our delta and increases our theta.
As long as we still have time to expiration and we are not moving the calendar too far away from the butterfly, it is certainly an adjustment worth considering.
FAQs
Can we use puts instead of calls for the bullish calendar?
Yes, you can.
The payoff diagram and the Greeks will be the same.
But we prefer calls for the bullish calendar because the call options with strikes above the current price will be out-of-the-money.
Put options will be in the money.
Out-of-the-money options tend to have tighter bid-ask spreads.
And when trading close to expiration on stocks, out-of-the-money options have a lower risk of being assigned.
That’s why we prefer to use out-of-the-money options for directional calendars.
How is the bullish calendar different from the bullish butterfly?
The main difference is that calendar is positive vega.
The butterfly is negative vega.
That means that a calendar will benefit more if implied volatility increases.
Whereas the butterfly will benefit more if implied volatility decreases.
Other than that, the two are quite similar.
Here is a bullish butterfly for the Eli Lilly example.
Compare that to the bullish calendar graph above. It took only one butterfly to build a similar graph of the similar risk-to-reward ratio and similar max risk.
That means that each butterfly tends to cost more than each calendar. In our example, it took three calendars to be equivalent to the value of one butterfly.
How is the bullish calendar the same as a bullish-balanced butterfly?
They both can be constructed with high reward-to-risk ratios.
The max loss on both is the debit that was initially paid.
Is there an iron calendar, just like there is an iron butterfly?
No, there is no such thing as an iron calendar.
The word “iron” refers to the options structure containing both calls and puts.
A calendar can not be created with one call, and one put.
They both must be call options, or both must be put options.
Conclusion
Some investors may not be comfortable with calendar spreads because it consists of options at different expirations.
This causes the expiration graph to change slightly during the trade.
Its graph is an estimate and is not fixed.
It is also the reason why you see curved lines in the expiration graph.
But as you can see, there are many uses for the calendar.
The bullish calendar, in particular, is mainly a play on the directional movement of the underlying.
While we have discussed the nuances of the Greeks and the reward-to-risk ratio, etc., the main point is that as long as the price moves in the intended direction, the directional calendar is going to be profitable.
All other factors are secondary.
If the price moves in the opposite direction, the most we will lose is the debit paid for the calendar (assuming no adjustments were made).
We hope you enjoyed this article on the bullish calendar spread. If you have any questions, please send an email or leave a comment below.
Trade safe!
Related Articles
Double Calendar Spreads
Does it Matter if We Use Puts or Calls for Calendar Spreads
Controlling the Vega of Calendar Spreads
Calendarizing a Butterfly Spread
Calendarizing an Iron Condor
When do Calendar Spreads Have Negative Vega?
What are Reverse Calendar Spreads?
Calendar and Double Calendar Examples
The Double Calendar Pre-Earnings Strategy
Calendar Spreads with Weekly Options
Calendar Spreads 101
Bearish Put Calendar Spread
Disclaimer: The information above is for educational purposes only and should not be treated as investment advice. The strategy presented would not be suitable for investors who are not familiar with exchange traded options. Any readers interested in this strategy should do their own research and seek advice from a licensed financial adviser.


