


The term “Black Swan Index” that you might see in social media or financial articles is referring to CBOE’s SKEW index
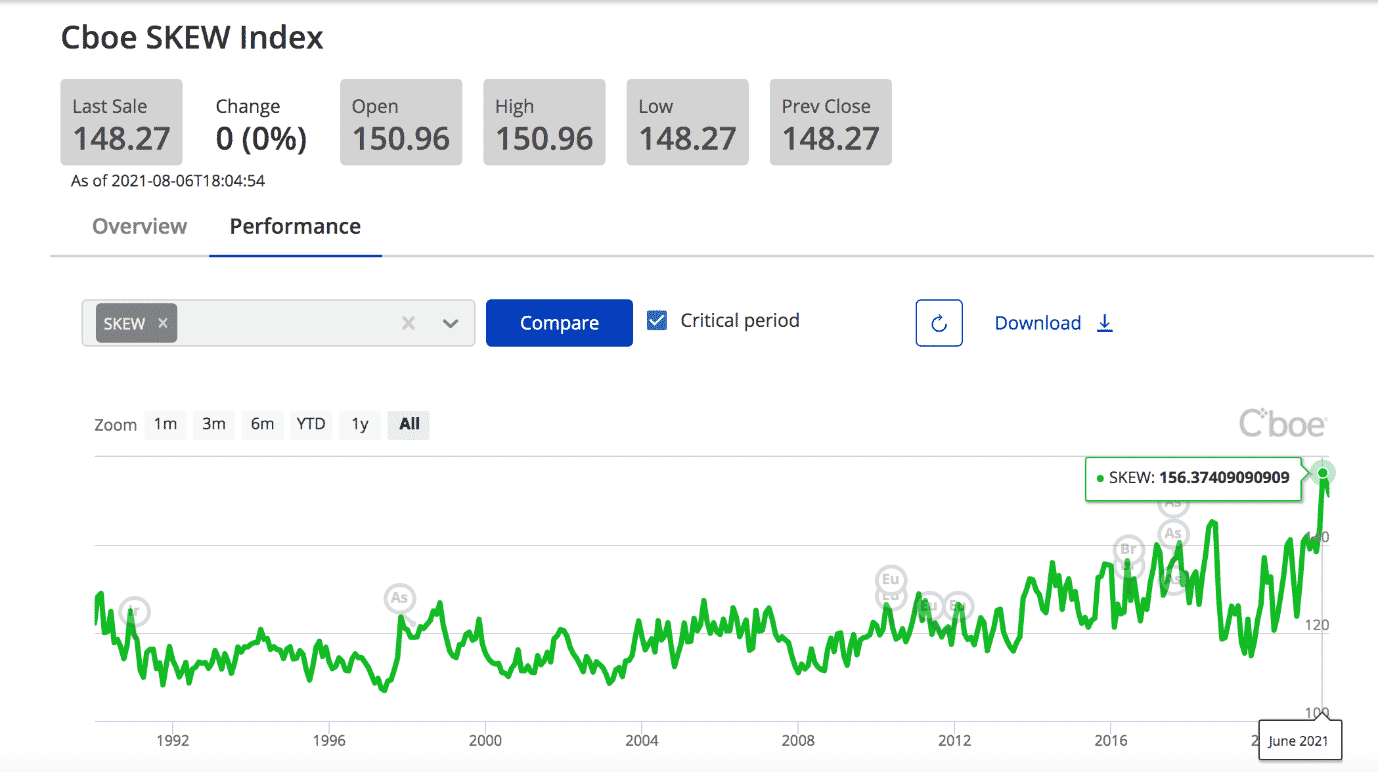
Source: CBOE Index Dashboard.You can also bring it up on many trading platforms using the symbol SKEW or $SKEW.
As you can see from the chart set to a timeframe of “All time”.
The index started in January 1990, and we see that SKEW reached all-time highs at 156 in June 2021.
Contents
- What Does This Mean?
- How Is SKEW Different From The VIX
- Are The Practical Applications?
- Can The SKEW Predict A Down Move?
- Why Is It Called The Black Swan Index?
- Conclusion
What Does This Mean?
Based on option prices of the S&P 500, the SKEW index measures investors’ perceived tail risk. SKEW value of 100 means normal skew and low tail risk; a value of 150 means high tail-risk.
Tail risk is the risk of the S&P 500 making a move greater than two standard deviations.
A greater than two-standard deviation move would be on the tail ends of the distribution curve — hence the name “tail risk”.
Although there are tails on both sides of the curve, investors are more concerned about downside tail risk.
A high SKEW index value indicates that put options are much more expensive than call options because investors use puts for downside protection.
Let’s look at the actual numbers to confirm if this is the case.
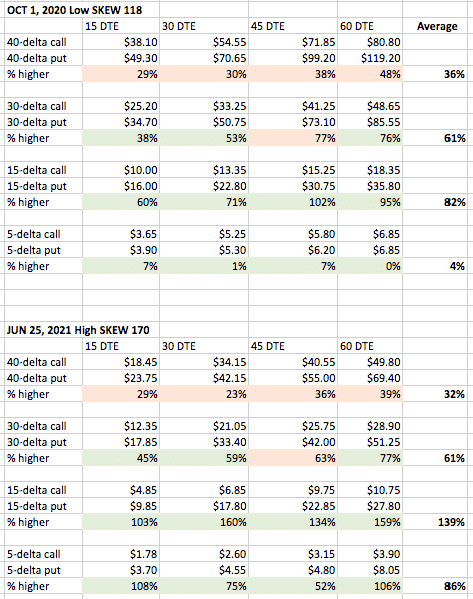
Data from: OptionNet Explorer
For example, in the first table (low SKEW environment), looking at the 30-delta and 15-days-to-expiration for calls and puts:
Low SKEW
Oct 1, 2020
SKEW: 118
Oct 16 SPX $3460 call @ $25.20
Oct 16 SPX $3295 put @ $34.70
The put is 38% higher priced than the call.
In the second table (high SKEW environment), we have:
High SKEW
June 25, 2021
SKEW: 170
July 9 SPX $4315 call @ $12.35
July 9 SPX $4240 put @ $17.85
The put is 45% higher priced than the call.
The fact that puts are higher priced than calls of the same delta is known as skew.
Puts are typically higher priced relative to the calls.
But it is even more so in a high SKEW environment and more so for strikes further away from the current price.
The green cells in the above table show that the skew is larger in the high SKEW environment than in the low SKEW environment.
The red cells show the exception to this.
The average column shows that there is not much difference in skew between the high SKEW environment versus the low SKEW environment at the 40 and 30 deltas.
However, at 15-delta, we see some skew differences.
The puts are 139% higher priced than the calls in the high SKEW environment, whereas they are only 82% higher priced in the low SKEW environment.
You see the greatest skew difference at the 5-delta (far out-of-the-money).
In this case, the puts are 86% higher priced in the high SKEW environment versus 4% higher priced in the low SKEW environment.
Download the Option Profit Calculator
How Is SKEW Different From The VIX
Both the VIX and the SKEW are calculated based on option prices.
Think of VIX as measuring how far investors think the S&P 500 will move from its mean.
While this captures one layer of perceived risk, the SKEW takes it one step further by measuring how much more likely a down move would occur than an up move.
In other words, how much fatter the left side tail is compared to the right side tail of the S&P 500 distribution curve.
The SKEW index can detect when far-out-of-the-money puts are in high demand, as indicated by a high SKEW value.
Demand for 5-delta puts suggests that investors are getting nervous and are buying protection.
It does this by measuring the slope of the implied volatility curve (aka the “smile graph”).
Here is an example implied volatility graph of SPX, where the vertical axis is the implied volatility (IV), and the horizontal axis is the strikes, with 4325 being the current price of SPX.
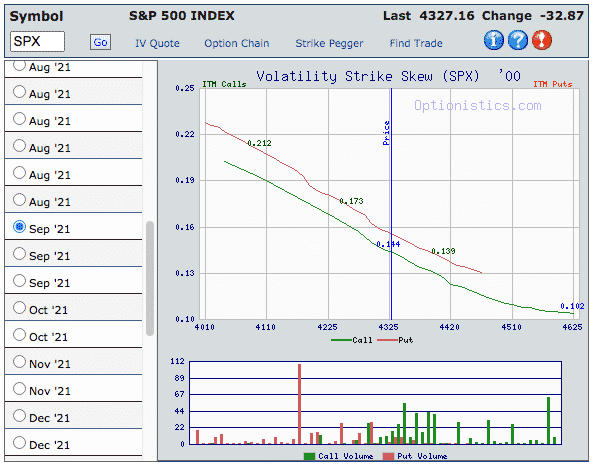
Source: Optionistics.com
The graph is not symmetrical.
The downside options have higher IV’s than the upside options.
Puts (the red line) have higher IVs than calls (the green line) across all strikes.
From this graph, the $4225 put has a higher IV (and therefore price) than the $4420 call.
Are The Practical Applications?
When SKEW is high, put premiums are rich and call options are inexpensive.
Some investors are tempted to sell put options, while others can buy call options.
Both are long strategies that benefit if prices go up but lose when prices go down.
However, a high SKEW signals “danger” because of the perceived increase chance of a large down move.
There is a reason why put options prices are high.
Those who sell them get paid to take on greater risks.
Similarly, there is a reason why call option prices are low.
Like everything in the market, you get what you pay for.
Can The SKEW Predict A Down Move?
We let you judge by yourself as we line up the SKEW with the SPX from 2016 to the present.
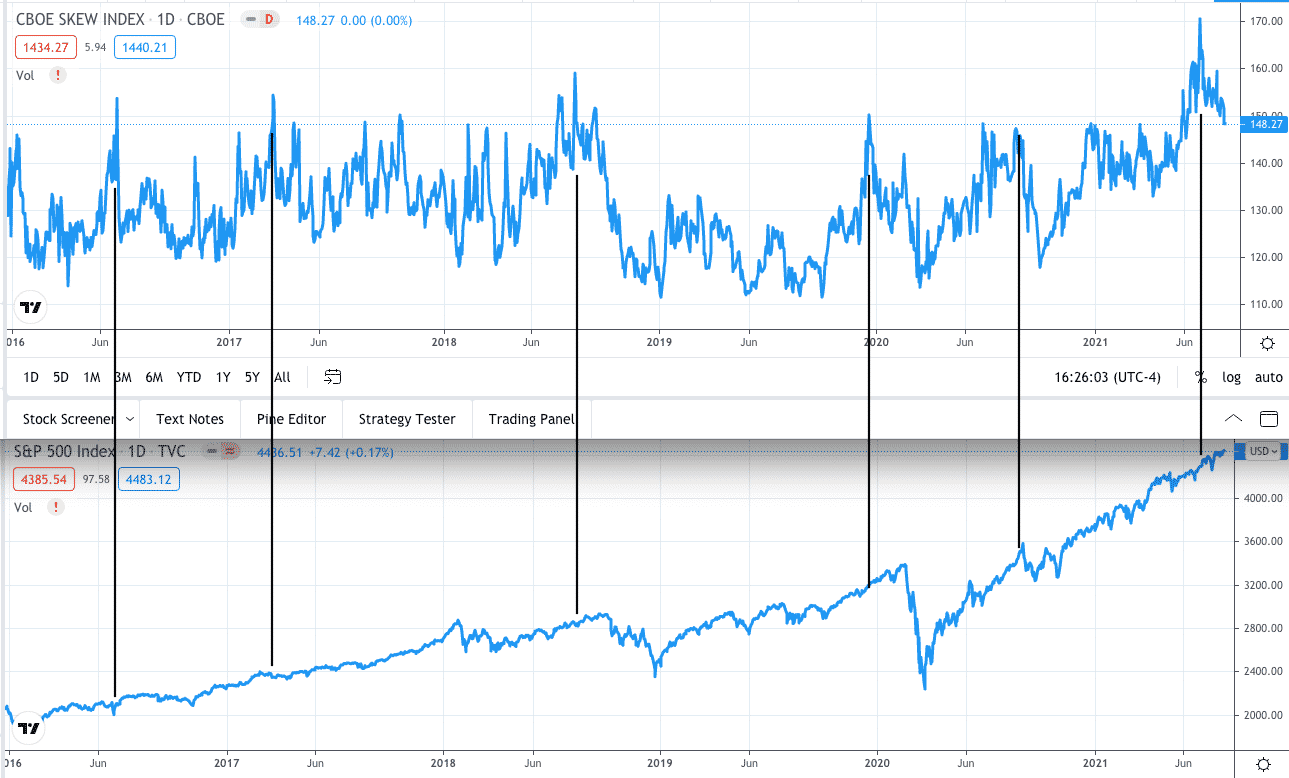
Not all the spikes in SKEW result in a down move.
If there is a spike, the SKEW can precede the sell-off by many weeks.
As of this writing, you see where the graphs end.
We don’t know as of yet how the recent high SKEW in June 2021 will play out.
There are no clear-cut answers.
Those investors who believe in the predictive nature of the SKEW will be careful of over-allocating on the long side and may have hedges ready or be in a “risk-off” position.
Why Is It Called The Black Swan Index?
While some people believe in the predictive nature of the SKEW, others scoff at the idea saying that it seems predictive only in hindsight, something that is known as retrospective distortion.
A black swan event, by definition, is unpredictable.
The term was popularized by Nassim Nicholas Taleb’s book “The Black Swan — the impact of the highly improbable“.
There are things that we know we know.
There are things we know we don’t know.
And then there are things we don’t know that we don’t know; black swan events belong to the latter category.
The story behind the term “black swan” goes like this.
Ancient Europeans only saw white swans and never saw any black swans.
Hence everyone thought that they knew there was no such thing as black swans.
It was not until 1697 when European explorers reached Australia and saw for the first time black swans.
While this may be a “black swan event” for the Europeans, it was not a black swan event for the Australians.
Living here in Australia, it is not uncommon to see black swans, especially in the wetlands of southwestern and eastern Australia.
Conclusion
The SKEW index measures investors perceived tail risk based on demands for out-of-the-money put options.
Whether that perceived risk will occur is anyone’s guess.
To learn more about the SKEW index, including its formula and sample calculations, read CBOE’s whitepaper on the SKEW.
Trade safe!
Disclaimer: The information above is for educational purposes only and should not be treated as investment advice. The strategy presented would not be suitable for investors who are not familiar with exchange traded options. Any readers interested in this strategy should do their own research and seek advice from a licensed financial adviser.

Amazon Associate Disclosure
Options Trading IQ is a participant in the Amazon Services LLC Associates Program, an affiliate advertising program designed to provide a means for sites to earn advertising fees by advertising and linking to amazon.com


