


Today, we have a guest post from Craig Iseli, the Chief Operating Officer of Spider Rock answering the question, what is volatility?
Contents
- Introduction
- What Is Volatility and Why Does It Matter to Investors?
- How Do Investors Measure Volatility?
Introduction
Investors take account of many different factors when considering whether to buy or sell stocks, options, and other securities.
The most important is the fundamental value of the security they are interested in, but they also pay close attention to market behavior, using data about how markets have behaved in the past and are expected to behave in the future.
Volatility helps investors to predict the potential risks and rewards of investing in a security, and it also has an impact on the price of derivatives that are influenced by these factors, such as stock options and futures.
What Is Volatility and Why Does It Matter to Investors?
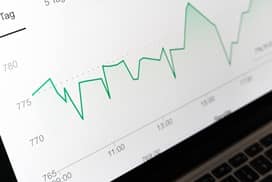
Volatility measures the size of the distribution of a security’s price over time.
That size, which is also called dispersion, indicates how much the price of a security deviates from its mean.
In simple terms, if the price of the security tends to rise and fall significantly—to swing up or down— around the average price, volatility is high. If the price remains close to the mean over time, volatility is low.
Volatility matters because high volatility is associated with risk.
If a security is less volatile, its price doesn’t exhibit large swings in either direction.
It stays more or less the same over time, gradually increases, or gradually decreases. In short, it’s more predictable.
It worth distinguishing between two types of volatility: historical and implied volatility.
Historical volatility measures a security’s volatility in the past. Implied volatility is a forecast of the expected future volatility.
Implied volatility is one of the factors that determine the price of options.
How Do Investors Measure Volatility?
The basic measure of volatility is the standard deviation from the mean price, which indicates how price values are spread around the average.
- Take the price at intervals over a period of time.
- Calculate the average price.
- Calculate the difference between the mean and each price (the deviation).
- Square those deviations and add them together.
- Divide the total by the number of prices.
- Take the square root.
In addition to standard deviation, there are other more complex volatility measures of interest to investors.
For example, beta measures volatility in relation to a security’s market.
The market is given a volatility of 1.0 and the security’s beta measures how much its movement deviates from that of the market.
A beta higher than 1.0 indicates greater volatility and is therefore considered riskier, although there are limitations to this approach to risk measurement and it is not useful for determining risk over the long-term.
You might be wondering how investors figure out implied volatility—how a security’s price is likely to change in the future.
One common tool is the Chicago Board Options Exchange Volatility Index, usually referred to as the VIX.
The VIX is a real-time index of the market’s expected volatility over the next 30 days.
While volatility is a useful and widely used proxy for risk because it’s convenient and easy to calculate, it should be understood that it is only one of many forms of risk analysis and should be used alongside other factors when making investment decisions.
About the Author: Craig Iseli is the Chief Operating Officer of SpiderRock, a SaaS solution for institutional portfolio managers to implement the trading and risk management of systematic, multi-asset strategies. Their data products are used by many institutional portfolio managers to enhance trading strategies.
Disclaimer: The information above is for educational purposes only and should not be treated as investment advice. The strategy presented would not be suitable for investors who are not familiar with exchange traded options. Any readers interested in this strategy should do their own research and seek advice from a licensed financial adviser.


The calculation that is outlined gives the variance. Normally volatility uses the standard deviation, which is even stated in the article. So the square root needs to be taken to get the volatility.
Thanks, updated.