


What is the ABE indicator? When I hear “Abe”, I think of Abe Lincoln.
But this has nothing to do with the 15th President of the United States.
In fact, it’s not even an indicator in the sense that an indicator is something like the MACD placed on the price charts.
The ABE is more like a gauge or a sensor than a weather sensor.
It is an environmental sensor.
It senses the market environment and tells you whether there is an edge in selling at-the-money option structures to profit from time decay.
ABE stands for “At-the-money Butterfly Edge.”
Typical near-the-money positive theta option structures include butterflies and even iron condors where the short strikes are near-the-money.
However, it will not apply to iron condors with far out-of-the-money spreads, such as spreads at the 10-delta.
The ABE indicator also applies to butterflies that are slightly off-centered.
For example, the rhino butterfly is technically not an at-the-money butterfly but very close to it.
The ABE indicator does not apply well to very short DTEs (days-to-expirations) options.
It is designed for option structures that are 10 to 90 trade-days-to-expiration.
Wayne Klump, the inventor of this indicator, likes to use trading days to expiration rather than the more popular DTE, which includes calendar days that are non-trading days.
He says that he uses the indicator himself all the time to inform him about position size and help with other decisions regarding his trades.
The ABE indicator ranges from 0 to 100 as a color gauge from red to green.
The higher the number, the better the edge and the more advantageous it is to put on these near-the-money positive theta structures.
It also shows a historical graph of the ABE values to see if they are rising or falling.
The best is when the value is high and rising.
The worst is when the value is low and dropping.
In an Aeromir presentation, Wayne gave some examples of how a butterfly reacted when, on April 11, 2019, the ABE was low and falling. And compared to how a butterfly reacted on August 16, 2019, the same year the ABE indicated a high edge.
On June 9, 2023, the ABE indicator read zero and is falling; this would be the worst time to put on an at-the-money butterfly.
And he showed what happened to an SPX butterfly when initiated on that day.
We could see nothing unusual on that Friday, June 9, 2023.
VIX was around 13.75, which is a bit on the low side, but we’ve been lower.
And the VIX futures term structure is in contango.
Just for our confirmation, let’s back-trade an SPX Rhino butterfly on June 9, 2023, using OptionNet Explorer.
Trying to extract money out of the market on that day was like pulling teeth.
The butterfly was in a slight drawdown from the start, and it remained in that drawdown for another 27 days before coming back to break even:
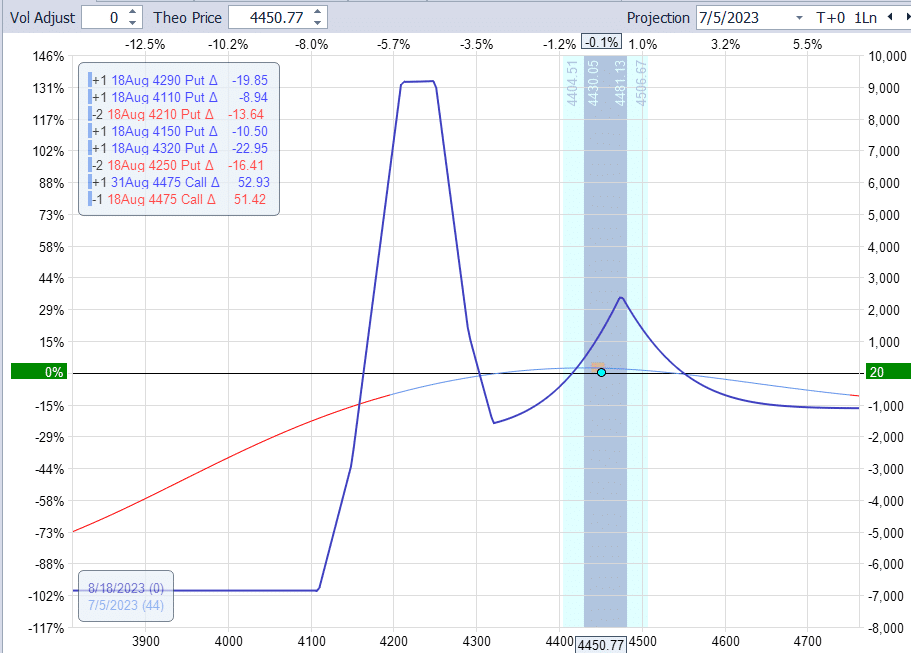
Ultimately, we could extract $80 out of the trade after 34 days.
This lackluster performance corroborated the low edge that the ABE indicator showed.
There is something to be said of longer-term trades.
Even if you entered it in unfavorable conditions, it had enough time to work out profits and/or wait until the market environment became more favorable.
A shorter-term 14-DTE trade would have fared more poorly.
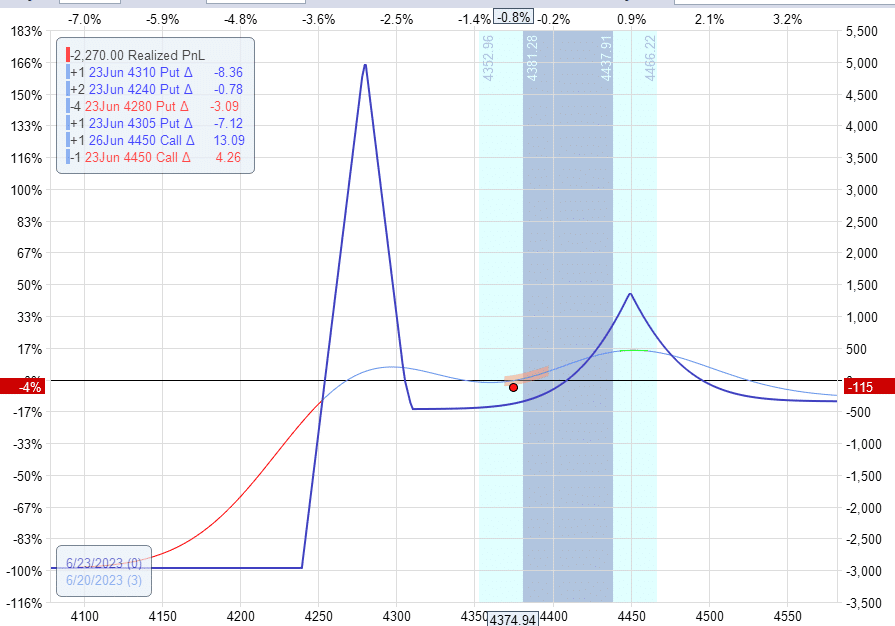
This trade, initiated on June 9, 2023, was down 4% with three days left till expiration.
When we compare how the butterflies had done when they were initiated on August 16, 2019, when the ABE showed a high edge, we saw that the longer-term Rhino trade made $390 in 34 days.
And the shorter-term butterfly made $120 in 7 days.
Frequently Asked Questions:
How does the ABE indicator work?
What factors in the market environment does it use to come up with this result?
No one knows. It is proprietary information known only to its inventor, Wayne Klem, and perhaps a few inner circle of colleagues. In other words, it is top secret.
Is the ABE indicator free?
No, it is by paid subscription at EnvironmentTradingEdge.
What underlying is this indicator applicable to?
It uses information that comes from the SPX index. So, it is most applicable to at-the-money structures trading on the SPX.
However, since other assets, such as the RUT or some equities, are somewhat correlated to the SPX, you may want to try to see if it works for those.
Some Thoughts
The ABE indicator appears to be somewhat predictive of whether butterflies have an edge on any given day.
Remember that having an edge does not necessarily mean the trade would win.
It only means that there is a slightly better statistical probability.
Remember that anything can happen in the markets.
We hope you enjoyed this article on the ABE indicator.
If you have any questions, please send an email or leave a comment below.
Trade safe!
Disclaimer: The information above is for educational purposes only and should not be treated as investment advice. The strategy presented would not be suitable for investors who are not familiar with exchange traded options. Any readers interested in this strategy should do their own research and seek advice from a licensed financial adviser.


