


In a previous post, we described Amy Meissner’s A14 options strategy and how she made triple-digit returns, as posted on Aeromir’s website and as shown in her brokerage statement in the A14 Introduction YouTube video.
I don’t doubt her results at all. After all, she is a very knowledgeable trader with decades of trading experience.
Contents
Introduction
The performance of any trading strategy depends on the market condition, the trader’s skill level, and the trader’s experience in trading that particular strategy and whether that strategy fits well with their trading style.
In terms of market condition, those results were achieved in very favorable market conditions of the bullish year 2021, where the SPX looked like this:
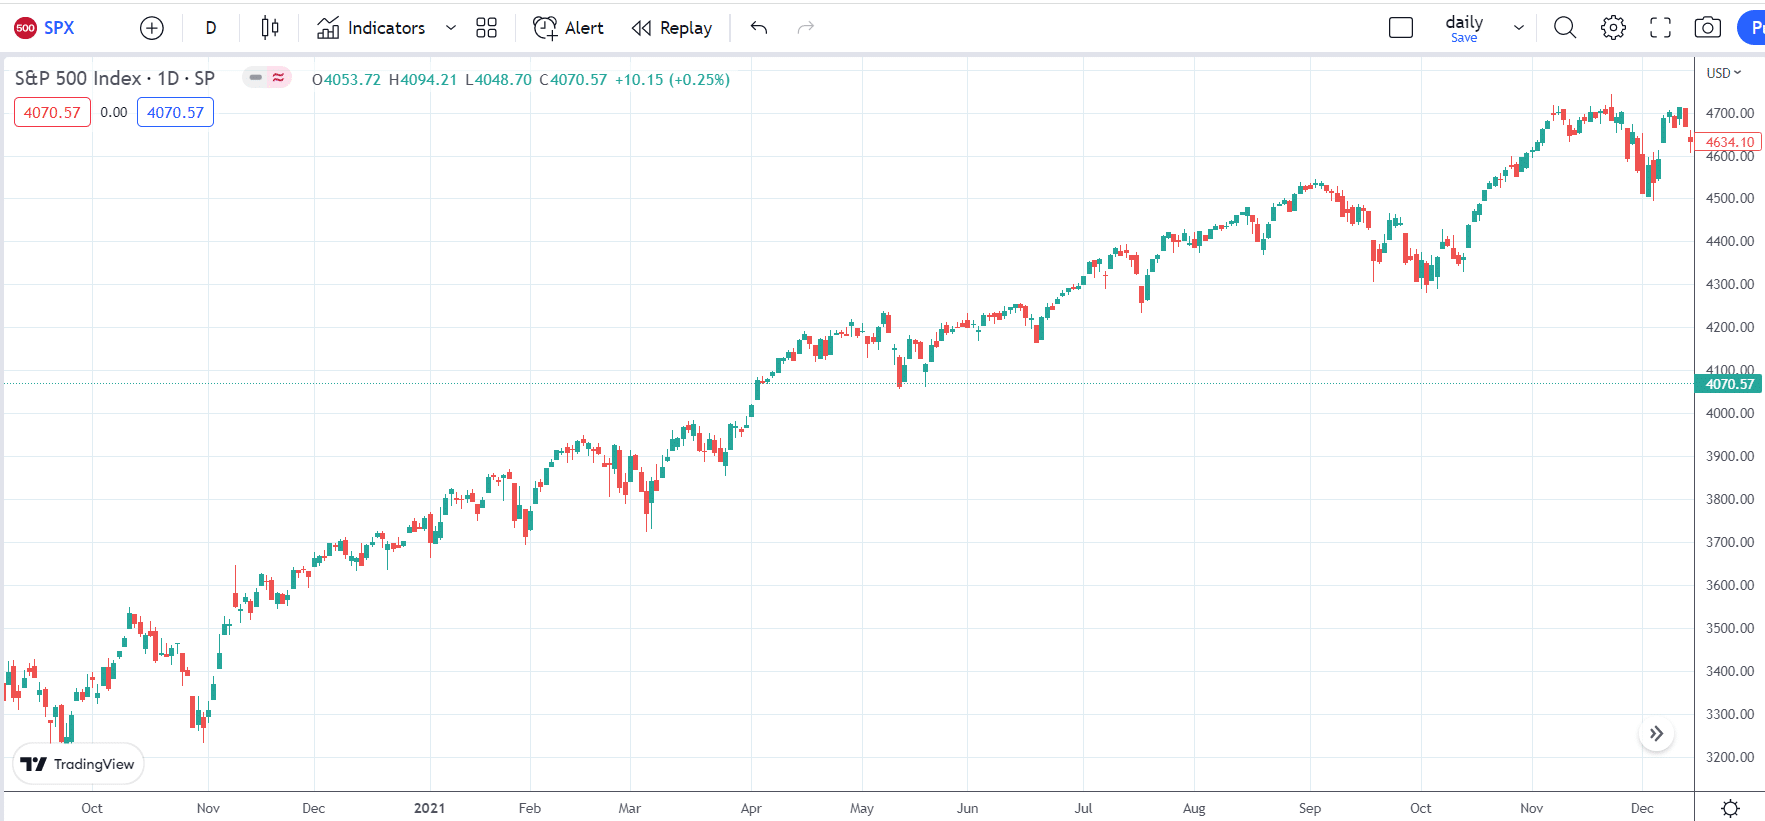
source: tradingview.com
As is with many delta-neutral broken-wing-butterfly strategies, the big losses are to the downside. The trade can be easily managed when the market goes up like this.
What I am more interested in is how the strategy does in a bearish market like the one we had in 2022, which looked like this:
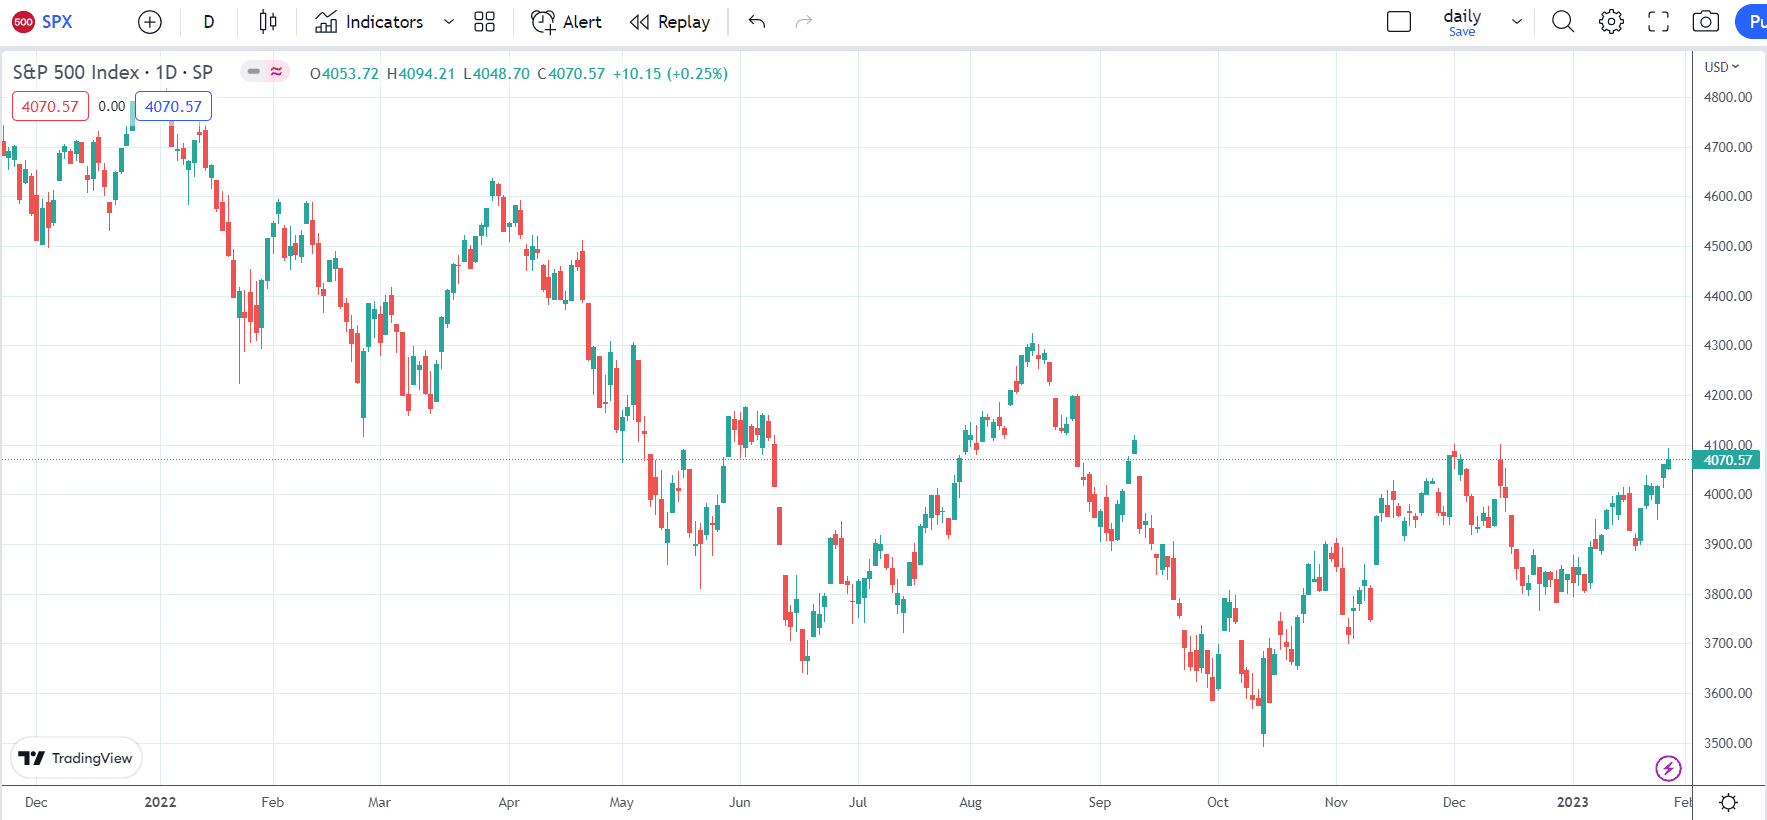
source: tradingview.com
As you can see, the two charts look quite different.
Fortunately, I have a student who took Amy’s A14 Weekly Options Workshop.
In fact, he said he watched it twice.
He backtested the A14 strategy using OptionNet Explorer for the bearish year 2022.
This is his result.
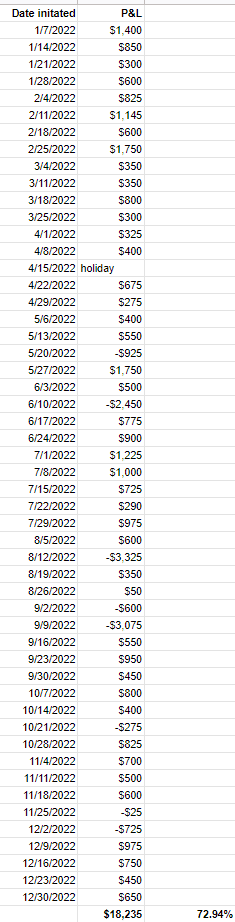
source: shared with permission
While the results are not as great as that of Amy’s, these are decent results with an annual return of 73% on $25,000 of planned capital.
That is a 6% return per month.
He was back-trading with a 10-lot size (10 butterflies), the same as was taught in the workshop.
Although he tried to follow the rules of the strategy as closely as he could, the rules left a lot of room for interpretation as well as the trader’s choice.
Therefore another trader trading the exact same market and rules can have different results.
The choice of strikes can be slightly different.
Checkpoint time and frequency of monitoring can be different.
And choices of adjustment are, to some extent, left to the trader’s discretion.
I’m willing to bet that if the same trader backtested the strategy again during the same period, he would likely get slightly different results.
Nevertheless, regardless of actual percentage return numbers, whether 115%, 73%, or even 20%, there appears to be a positive expectancy in this A14 strategy over most market conditions.
I like to say “most market conditions.”
In trading, you can never say any strategy works in “all market conditions.”
Because as soon as you say that, the market will throw you a scenario to prove otherwise.
More Stats
Based on the results, this strategy falls into the category of high-probability strategies.
This means that the strategy generates mostly winning trades.
However, when a loss comes, the loss is typically larger and can wipe out multiple wins.
Let’s look at the stats more closely.
There were eight losing trades out of 51 trades in the year, giving a win rate of 84% which is close to the 9-to-1 win-loss ratio claimed by the A14 strategy.
One week of trading was skipped because Friday, which is the day that the strategy is supposed to be initiated, landed on holiday.
And the rules didn’t say what to do in this case.
The largest loss was –$3325.
The largest win was $1750.
The average loss was -$1425.
Amy’s average win was $689.
The average loss is larger than the average win.
However, the high win rate makes up for that loss.
There were two consecutive losses seen.
But we did not see three consecutive losses.
It was smooth sailing in the earlier part of the year because there were four months of consecutive wins.
Charting out the equity curve of the backtest gives the following:
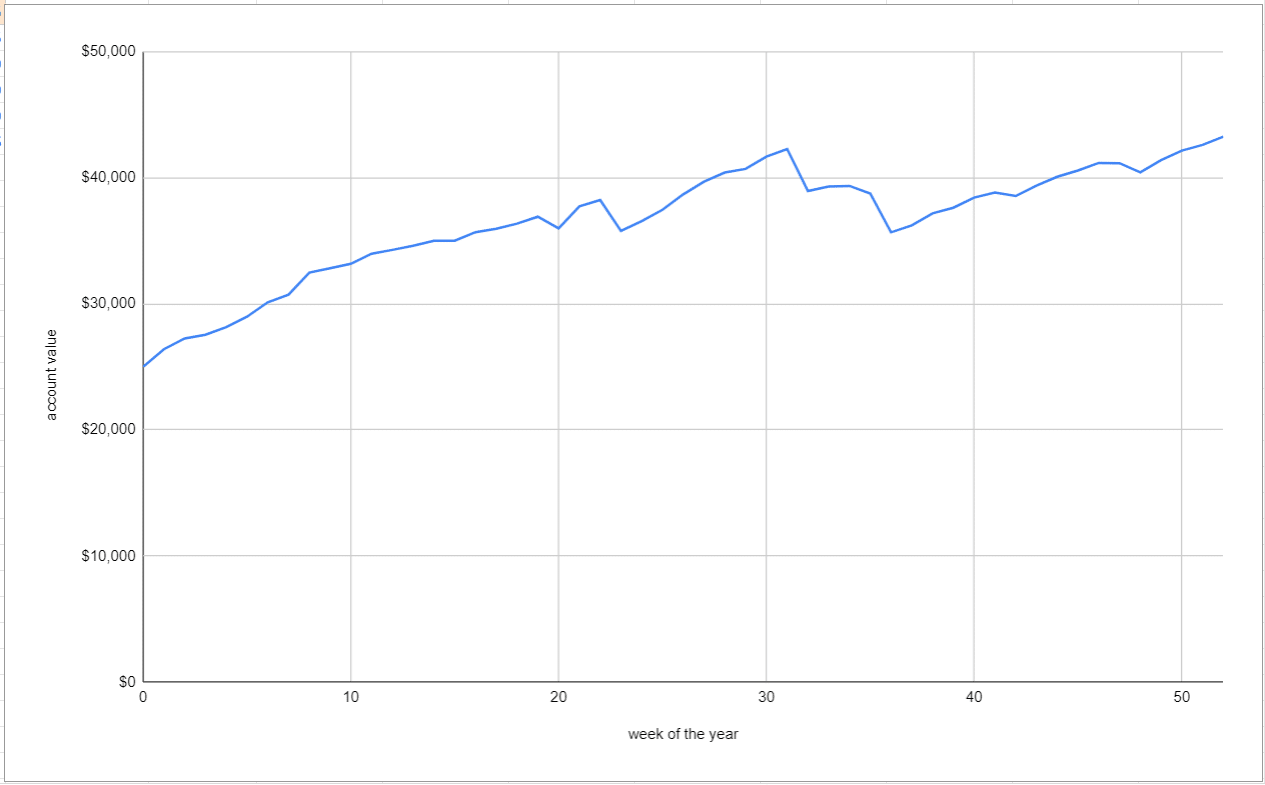
The largest drawdown occurred from week 31 (August 5) to week 36 (September 9), where the account dropped $6600 from a value of $42,260 to $35,600.
This period was also where the two consecutive losses occurred.
The 15% drawdown was fully recovered by week 51 (December 30) and took nearly four months.
It is important to know the max drawdown of any strategy. A 15% to 20% drawdown is about the most you want to see in any strategy.
Any more than that, and it would be too difficult to stomach for many traders (depending on their risk tolerance), and they may lose confidence in the strategy.
Unfortunately, larger drawdowns are the price that one has to pay for higher returns.
More conservative traders may want to pair this more aggressive A14 strategy with a more conservative strategy in the portfolio to moderate portfolio drawdowns.
Or they may want to adapt the strategy to their trading style.
For example, exiting instead of adjusting when the market is in backwardation (as indicated by the VIX term structure).
Or they may want to specify a maximum number of days to be in the trade so that they don’t go too close to expiration where gamma is so high that one bad price move in the underlying can cause a big loss in the P&L.
Conclusion
I feel that analytical software with historical options prices is a must-have for anyone trading these types of strategies.
Two good ones are OptionNet Explorer and OptionVue.
First of all, you need it to validate whether a new strategy has an edge or not.
You need to validate it over a large enough time period that covers bull and bear market conditions.
You want to get a feel for the strategy in terms of win rate, the number of days in trade, average P&L, max drawdown, etc.
Second, you need to practice and gain experience with a new strategy before putting real money on the line.
The rules of such strategies cannot be precise enough to tell you what to do in every possible market scenario.
Rules are just guidelines.
It is the trader’s decisions at critical points that determine the performance of the strategy. These decisions can only be fine-tuned with practice.
And thirdly, manually backtesting the strategy gives the trader confidence in the strategy. Imagine if my student did not perform the backtest and just started the A14 strategy in the live market precisely the week of August 5.
A month later, and with an account size $6600 smaller, he would have said that this strategy was a complete failure.
By backtesting at least a full year, he would have seen that this was just an occasional dip in an otherwise upward-trending equity curve.
While backtesting is beneficial for all these reasons, live trading may not necessarily replicate the backtested results for a variety of reasons.
Some of which may include changing market conditions, trader psychology, slippage and fill issues, fees and commissions, and taxes.
We hope you enjoyed this article on the A14 options strategy backtest.
If you have any questions, please send an email or leave a comment below.
Trade safe!
Disclaimer: The information above is for educational purposes only and should not be treated as investment advice. The strategy presented would not be suitable for investors who are not familiar with exchange traded options. Any readers interested in this strategy should do their own research and seek advice from a licensed financial adviser.


Realistically, there is no way this could have been done live with only a $25k account. Sometimes the trades overlap, so there would have been times where one 10 lot trade would be on and another would have to be intiated on a Friday morning (as per the rules). Therefore that would be two 10 lot BWB’s (and that’s not including any margin used up by adjustments). Realistically this could only have been with a larger account, say $40-50k. So that would have brought the annual returns down from what is presented in the backtesting results.
That’s true and a valid point.
2022 was a bearish year and you would have had a better return than 73% in a bullish market. I’m thinking closer to 100%. I’ll take those returns any year.