


Divergence in trading refers to the condition when there is a discrepancy between a stock’s price action and its momentum indicators (most commonly the RSI and the MACD).
First, we need to fully understand the concept of conventional divergence before learning the new subject of hidden divergence.
In both cases, you must have a trend before looking for divergences.
Contents
Bearish Divergence
Consider the following line chart (so we can see better the peaks and valleys) of SPY during the uptrend in early 2025.
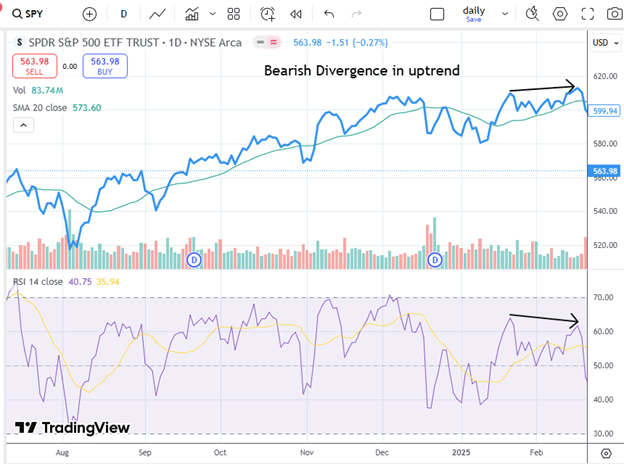
Looking at the price peaks, we see that it made a higher peak (as it should have if it was in an uptrend).
However, the RSI momentum has not confirmed this.
RSI made a lower peak at the same time.
The shift is subtle, but this is a discrepancy between the price and momentum.
This indicates that the momentum of the uptrend may be slowing down.
This is known as bearish divergence because it is believed that the price will soon follow the bearishness of the momentum and turn downwards.
In this case, it did happen”:
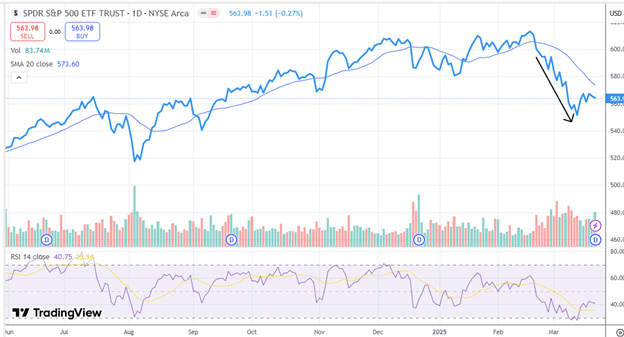
However, we need to remember that bearish divergence does not necessarily mean the price will go down.
It just means being on the lookout for the uptrend to slow down.
It could mean that the price will move sideways for a while.
Here, in the same asset, we can see bearish divergences where the price peaks are making higher highs while the RSI peaks are making lower highs:
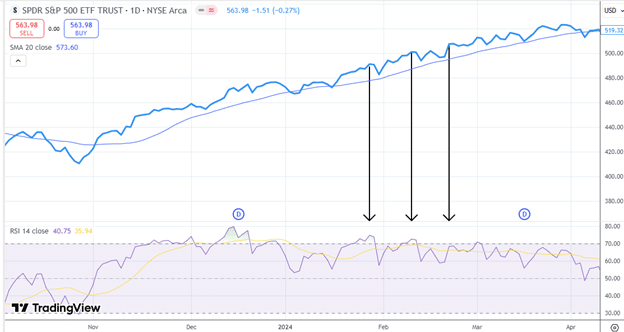
Yet the price continues to go up despite this, showing us that bearish divergence signals do not always work.
Bullish Hidden Divergence
Normally, the peaks and valleys of price should correspond to the peaks and valleys of momentum.
When looking for hidden divergences in an uptrend, we look at the valleys (instead of the peaks).
Here, we see GLD (gold ETF) in late 2024 with the ZigZag tool turned on.
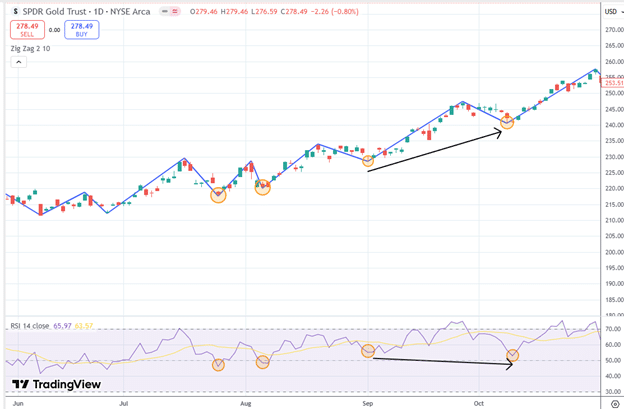
The first three highlighted valleys show prices going up.
So are the three corresponding valleys of RSI.
Things are as they should be.
The next valley in the price chart continues to go higher.
However, the fourth valley in RSI is lower than the third valley in RSI. Things are not as they should be.
RSI shows a hidden divergence from what the price is doing.
This implies that the price will continue its upward trajectory.
Indeed, we see that the price continues its upward trajectory after seeing this “bullish hidden divergence.”
We call this “bullish” hidden divergence because it implies an upward movement in price.
We say “bullish” or “bearish” divergences and hidden divergences as to what the signal implies the price will do.
Note that you may also see the terms “positive” or “negative” as being synonymous with “bullish” and “bearish,” respectively.
For some of the readers, hidden divergence may seem counter-intuitive.
If momentum is decreasing, why would the price continue up?
It helps to reframe the thinking for hidden divergences.
Momentum is lower, yet some forces are stronger than momentum, supporting higher prices.
This force carries the price further up.
This is especially true if you see the valleys of the RSI, both still above 50.
An RSI above 50 is bullish, and an RSI below 50 is bearish.
RSI has also been known as an oversold and overbought indicator. The fourth RSI valley indicates that the price is “more oversold” than the previous RSI valley, and hence, it is a good buy for bulls.
MACD As A Momentum Indicator
Below, we use MACD (instead of RSI) as the momentum indicator on a weekly chart of Costco (COST), which is in an uptrend.
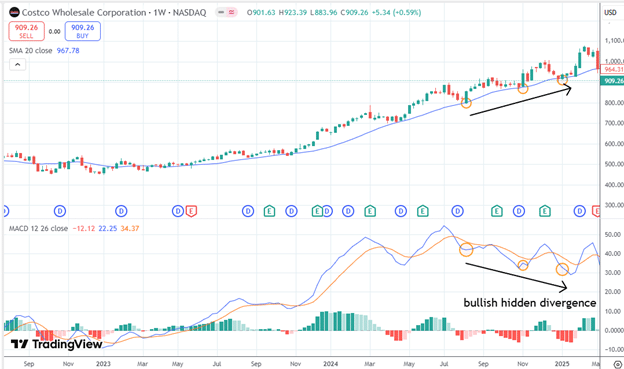
This shows that this concept works on any timeframe and can be applied to other momentum indicators.
We see a series of higher valleys in price with lower valleys in MACD.
This is a bullish hidden divergence suggesting a continuation of upward-moving prices.
Conflicting Signals
The astute reader may say:
But wait, I see a bearish divergence on the same chart
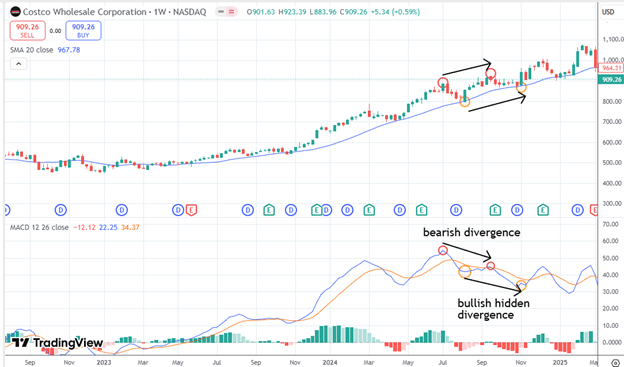
A bearish divergence suggests prices go down.
A bullish hidden divergence suggests prices to go up.
Which is it going to be?
Some traders find the hidden divergence signal to be more powerful.
Why?
Because the hidden divergence signal gives a signal in the direction of the trend. Meanwhile, the divergence signal is a counter-trend signal.
The chart is in an uptrend, and the bullish hidden divergence signal suggests the continuation of that trend.
Conclusion
Nothing in trading is black and white.
Divergences and hidden divergences are just one consideration many traders will use to monitor the price.
In this article, we gave only scenarios for an uptrend.
Because the market is moving up most of the time, we believe you should understand these concepts for an uptrending market before switching the thinking to a downtrending market, which we will cover in part 2.
We hope you enjoyed this article on divergence and hidden divergence.
If you have any questions, send an email or leave a comment below.
Trade safe!
Disclaimer: The information above is for educational purposes only and should not be treated as investment advice. The strategy presented would not be suitable for investors who are not familiar with exchange traded options. Any readers interested in this strategy should do their own research and seek advice from a licensed financial adviser.


Great information! smart and growing option.