


Bet you never heard of this before.
Contents
The name is in reference to the Oracle of Delphi, a highly regarded prophet at the Temple of Apollo in Delphi of Ancient Greece.
Scot Lowry named his trading system The Delphic Phenomenon for its prophetic ability to foresee price movements in advance.
This system is documented in his book The Magic of Moving Averages.
To him, the magic moving averages are the 18-period, the 40-period, and the 4-period simple moving averages.
He had spent years of painstaking research looking at moving averages and price patterns.
It would be worth our time to hear what he has to say.
This book was published a very long time ago, in 1998, when he had to phone his broker to place trade orders.
The examples in the book are primarily daily OHLC charts on Futures.
OHLC (Open High Low Close) bars were used before candlestick bars became popular.
In this article, we will pick out some patterns from recent candlestick equities charts to demonstrate his concepts and to show that his patterns still hold today.
Bullish Crossover And Signal
The basic pattern on the bullish side starts with the 18-period moving average crossing above the 40-period moving average.
This is not a simple moving average crossover strategy.
This is only the start of the setup and certainly not the trigger.
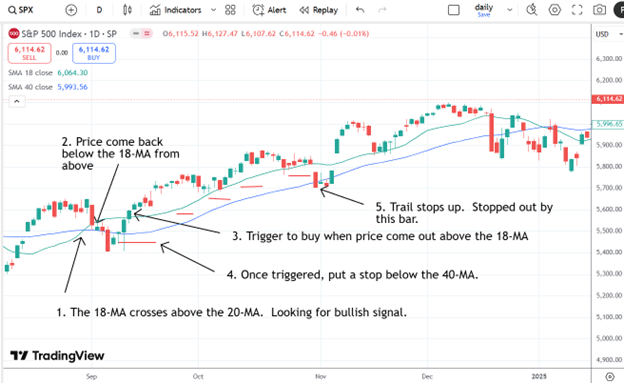
Here, we see the SPX index 18-MA (green line) cross above the 40-MA (blue line) at point 1, as indicated below.
Source: Tradingview
After the cross, we wait for the price to drop back down below the 18-MA back into the zone defined by the 18-MA and the 40-MA (see point 2 in the graphic).
The trigger to go long is when the price comes up above the 18-MA out of the zone (see point 3).
Once triggered into the trade, put a stop below the 40-MA.
As the stock moves up, start moving the stop up as well.
The stop should be placed between the 18-MA and the 40-MA lines.
In this example, we see that the trade got stopped at point 5 due to the overnight gap down.
The trade made about “1R”, which means it made profits equal to one times the initial risk.
Bearish Crossover And Signal
The strategy is not meant as a 100% mechanical system.
There are nuances that the trader needs to watch to make a discretionary decision as to whether to take the trade or not.
The quality of the system depends on the quality of the trader’s discretionary decisions.
The higher the win rate, the better.
But it doesn’t need to be very high because the average win size tends to be larger than the average loss size.
With an initial stop placed below the 40-MA, the trader quickly knows when the trade is wrong and exits with a small loss.
One nuance that the trader needed to judge was the distance of the 18-MA from the 40-MA at the point of the trigger.
If this distance is too large, the trader should forgo the trade as the risk will be too large since the stop has to be beyond the 40-MA.
For this example, we will look at the bearish crossover version.
Here, we see that Coca-Cola (KO) had an 18-MA crossing below the 40-MA:
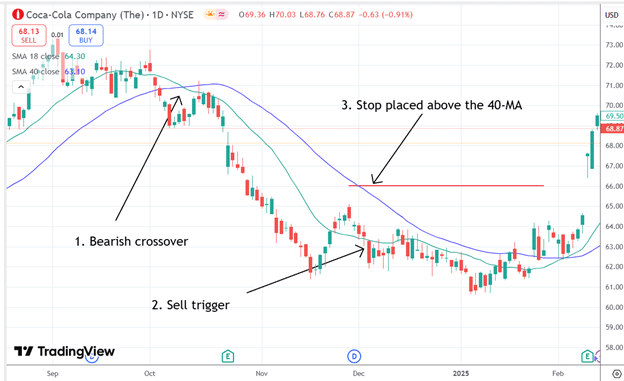
We wait for the price to come into the zone, back above the 18-MA.
The sell trigger is when the price exits the zone again by dropping below the 18-MA (see point 2 above).
The stop would then be placed above the 40-MA.
We see that at the point of the trigger, the distance between the price and the other side of the zone where we placed the stop is very large.
This should be enough for a trader to justify not taking the trade.
If they had taken the trade, they would have been stopped when the price gapped up on earnings, causing quite a significant loss.
Another reason not to take the trade is that the time from the crossover (point 1) to the trigger (point 2) is very long – nearly a month and a half has elapsed.
This is another reason not to take the trade.
By the time of the trigger, the downtrend had already occurred, and the price had not dropped much further.
When Too Long To Get Back To 18-MA
A discretionary distinction that a trader needs to consider is if the price takes too long to come back inside the 18-MA, the trader should forgo the trade because entry is too late into the trend.
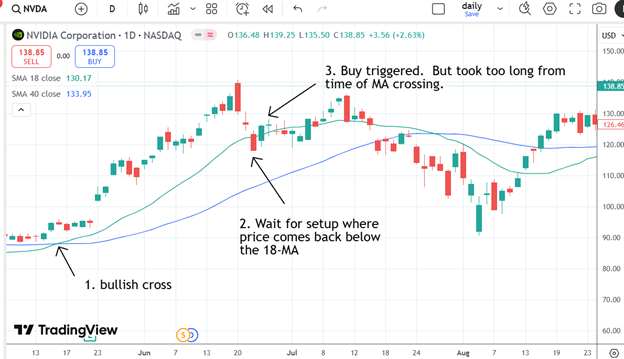
Here, NVIDIA had the moving average cross on May 16, 2024.
But we didn’t get the buy trigger until Jun 25. NVDA had gone up for a month already.
It is too late in the trend to buy. We have to let the trade go.
Only The First Time
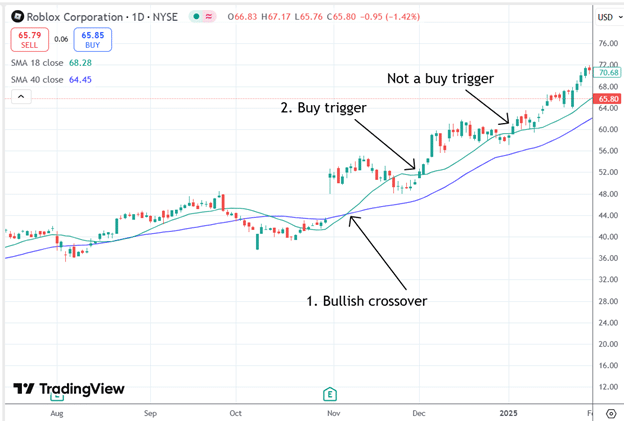
Scot emphasizes in the book that the buy trigger (or sell trigger) is only when the first time the pattern happens.
If the pattern uses the same crossover again, the second time is not a trigger.
For example:
Look At A Higher Timeframe
Scot also mentioned looking at the higher timeframe to determine the trend.
Do not go against the trend of the higher time frame.
Here is a daily chart of Microsoft (MSFT) where there was a bearish setup and then triggered in September 2024:
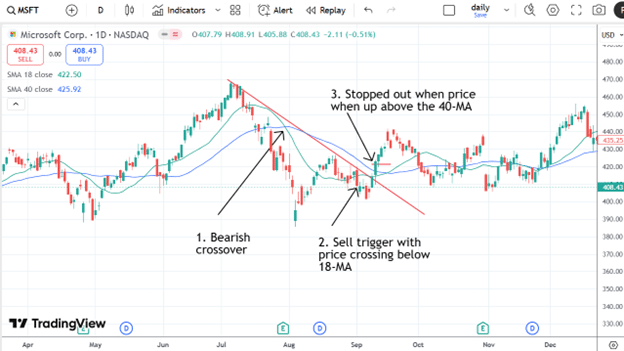
Should the trader take the short trade that was triggered?
No.
A trader taking the trade would have been stopped out when the price rallied up, breaking the down trendline and coming up above the 40-MA.
First of all, the time from the crossover to the sell trigger is a bit long.
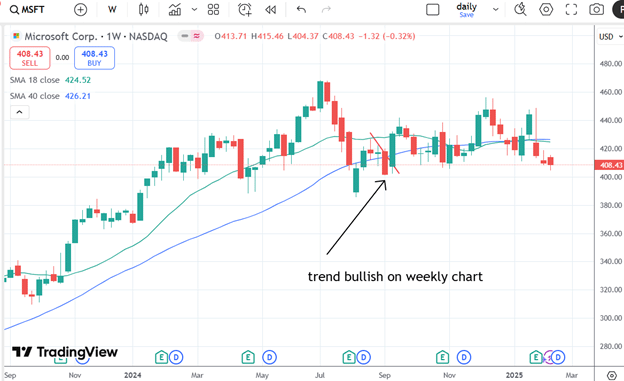
But more importantly, if the trader had checked the weekly chart, he would have seen that the longer timeframe trend is bullish and, therefore, should not be taking bearish trades.
The weekly chart is bullish, with an 18-MA above an upward-sloping 40-MA:
The System Failure Pattern
Now that we have learned what should happen after a moving average crossover, we need to learn what Scot calls the “system failure” pattern.
This is when what should happen does not happen.
Then, it may be time to do the opposite.
Take a look at Travel Leisure Co (TNL), where at point 1, it had a bearish crossover:
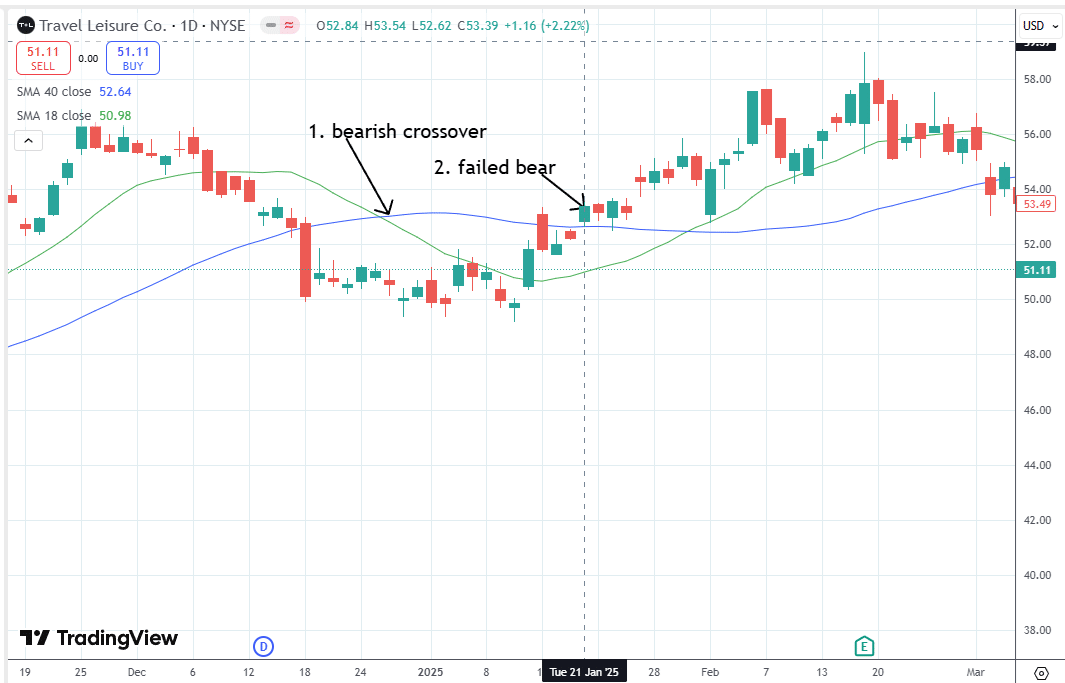
At point 2, its price came into the zone and is supposed to come out below the 18-MA.
However, it never did. Instead, on Jan 25, 2025, it went up above the 40-MA at where the stop would have been.
This is a sell failure pattern.
Should we then do the opposite and buy?
Let’s check the higher timeframe on the weekly chart on the candle for the week of Jan 21:
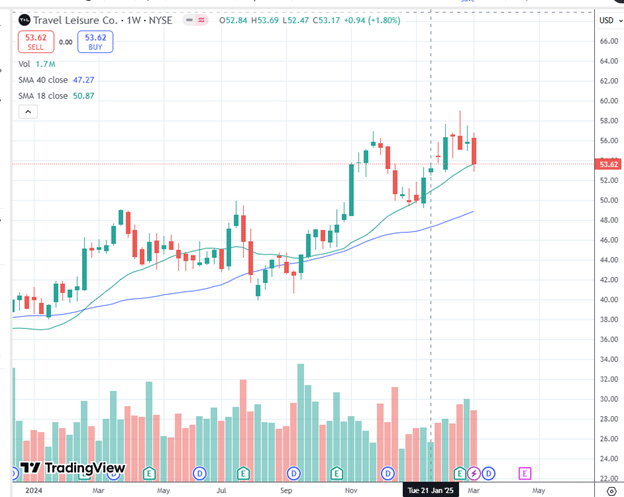
The chart is clearly in an uptrend.
So yes, we should go long on the daily chart on Jan 22.
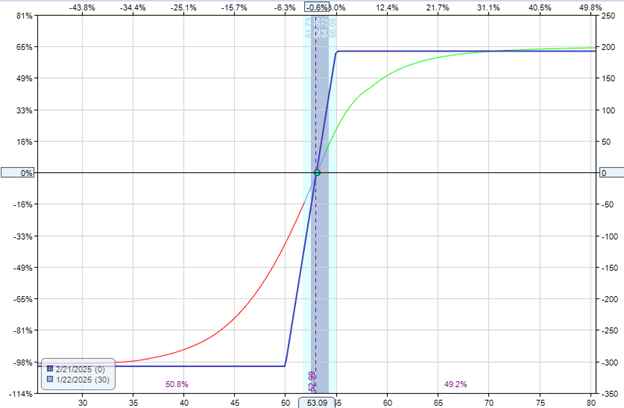
If the trader wanted to play directionally with the bull call debit spread:
Date: Jan 22, 2025
Price: TNL @ $53
Buy one call Feb 21 TNL $50 call @ $4.15
Sell one call Feb 21 TNL $55 call @ $1.07
Debit: -$308
Source: OptionNet Explorer
The trader would have seen a profit of $127 about two weeks later on Feb 7:
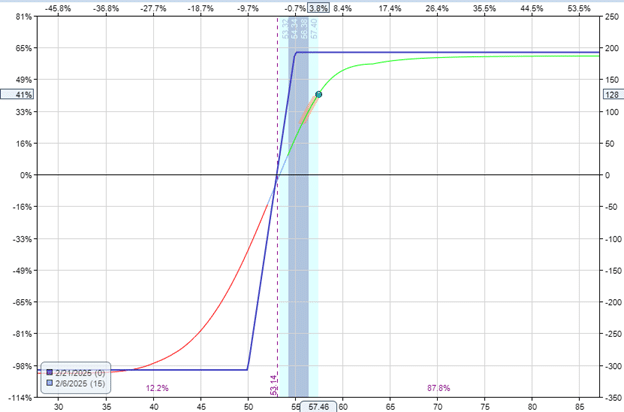
Or see a max profit of $192 if it is held to expiration.
Conclusion
The Delphic Phenomenon trading methodology was developed by Scot Lowry a quarter of a century ago.
However, we can find recent examples of stock trades and option trades that show that the system still has some validity.
The reader is encouraged to see if they find the patterns to hold true by looking through the history of many charts.
Like many systems, it is not so simple to say that once we learn the rules, we can be profitable right away.
Because there are critical decisions that the trader needs to make specific to that particular trade, it requires practice and seeing many examples of these patterns to succeed.
And, of course, it helps to read price action.
Some of those decisions include:
- is the crossover, and the trigger occurred close in time and price.
- is the trigger in the direction of the trend of the higher timeframe
- Is this a system failure pattern
- When to raise the stop
- When to exit the trade with profits.
We didn’t get a chance to talk about the 4-period moving average.
However, Scot does talk about it in his book.
We hope you enjoyed this article on the Delphi phenomenon trading system.
If you have any questions, send an email or leave a comment below.
Trade safe!
Disclaimer: The information above is for educational purposes only and should not be treated as investment advice. The strategy presented would not be suitable for investors who are not familiar with exchange traded options. Any readers interested in this strategy should do their own research and seek advice from a licensed financial adviser.


