


Contents
The Volume Weighted Average Price (VWAP) is an average price of a stock or asset for a specific period with calculations considering the volume traded at various prices.
It is said that this indicator combines the three most important ingredients of a stock chart, which are price, volume, and time.
The traditional VWAP is calculated over a period of that trading day – starting at the beginning of the day or session.
It is also known as the session VWAP or daily VWAP.
The VWAP originated in 1988 as a way for institutional investors to benchmark the prices they received for their purchases.
Did they end up buying the asset better or worse than the average price – or, in this case, the volume-weighted average price?
While this is still true today, the VWAP has been adopted by many traders as a technical indicator for entries and exits.
It is also a very common input into many of the algos that trade the markets today.
Because so many traders and programs use VWAP, it is one of the more important indicators.
The more people use it, the more it becomes a self-fulfilling prophecy to behave as people expect.
How Is The VWAP Used?
The VWAP is used by many day traders (in equities, forex, or futures) on shorter intraday time frames.
Some 0-DTE options traders also use it.
TradingView has a setting on its VWAP to turn off its display if the user switches to a daily chart or above.
For longer-term timeframes, the anchored VWAP would become more useful.
Using VWAP To Determine Bullish Or Bearish
If the price is above VWAP, there is bullish sentiment.
If the price is below VWAP, it is bearish.
This is analogous to longer-timeframe investors looking at whether a stock is above or below the 200-day moving average to determine whether to buy or sell.
Slope Of The VWAP
The slope of the VWAP line is important.
If it is sloping up, the average price is increasing.
If it is sloping down from left to right, then the price is generally moving lower.
If the VWAP is horizontal, price action is choppy and generally moves sideways.
Reversion To The Mean
Let’s look at a five-minute chart of the Nasdaq ETF (QQQ) on November 1, 2023.
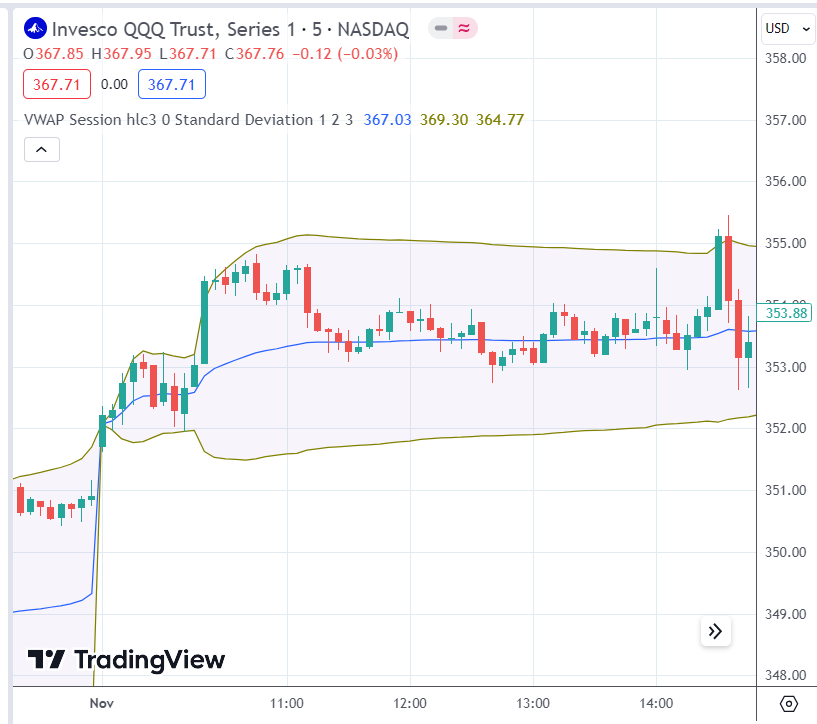
Because the VWAP starts its calculation at the market open at 9:30 EST, some traders like to wait some time to let the VWAP accumulate enough data.
We see a flat horizontal VWAP with prices oscillating around the VWAP.
There was little opportunity to trade here except in the afternoon session when the price came outside the two standard deviation bands surrounding VWAP.
Statistically, the price is outside those bands only 5% of the time.
Some traders may take a mean reverting trade there, expecting the price to go back to VWAP and taking profits or partial profits when it reaches VWAP.
And in this case, it worked out.
Using VWAP As Support And Resistance
Like major moving averages, the VWAP can sometimes act as support and resistance.
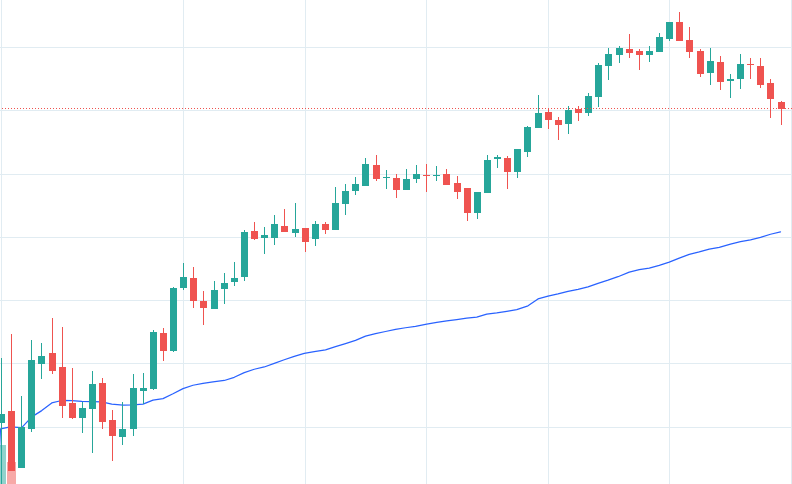
We see Apple (AAPL) on a 5-minute chart with the VWAP in blue:
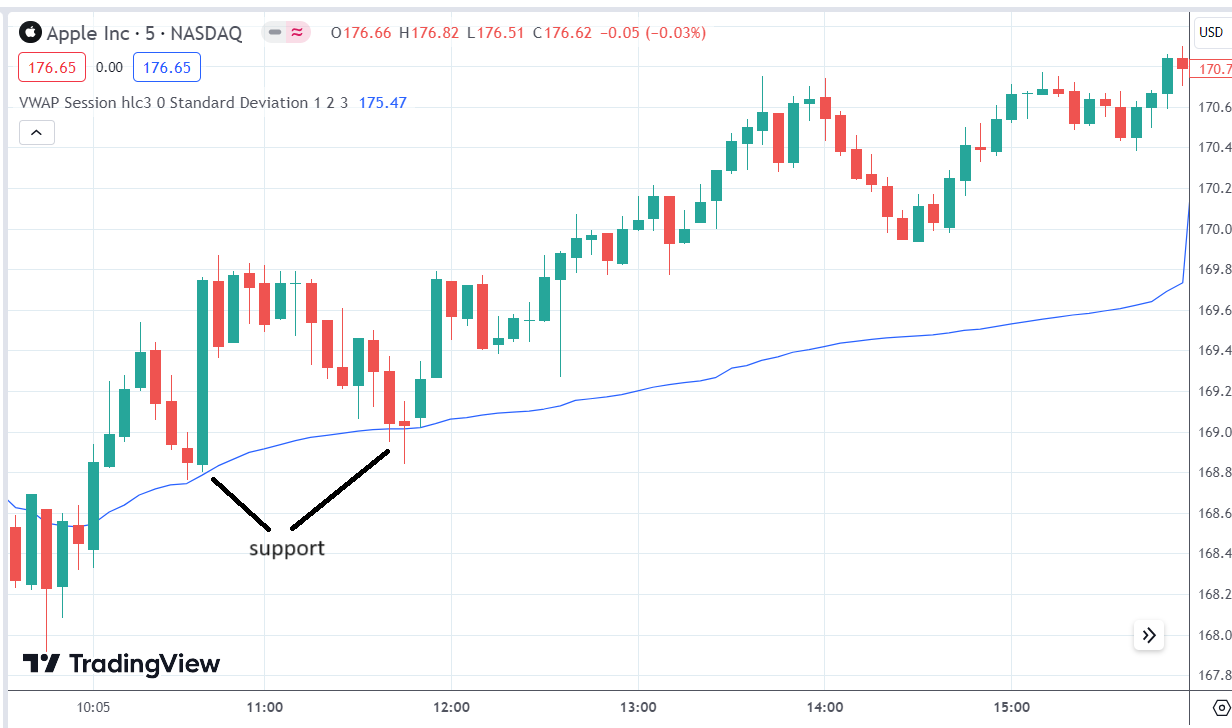
It had an upward-sloping VWAP with a price above the line.
This is bullish.
A trader waiting for trades to go long would have found good entries when the price pulled back to VWAP, which acted as support; then, put stops below VWAP.
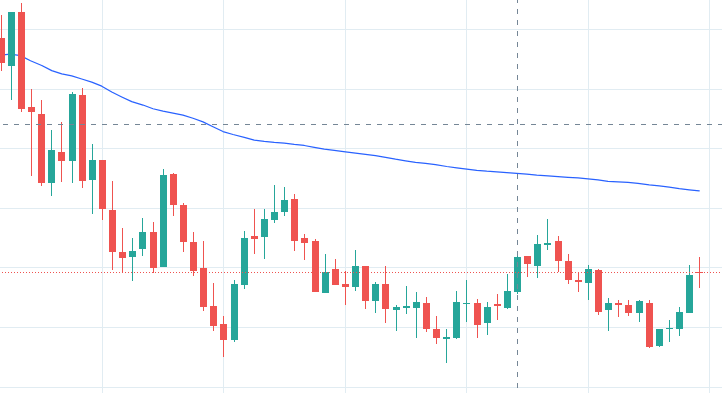
In the next example, we see Tesla (TSLA) gapped open lower on October 19, 2023, after its earnings announcement the night before.
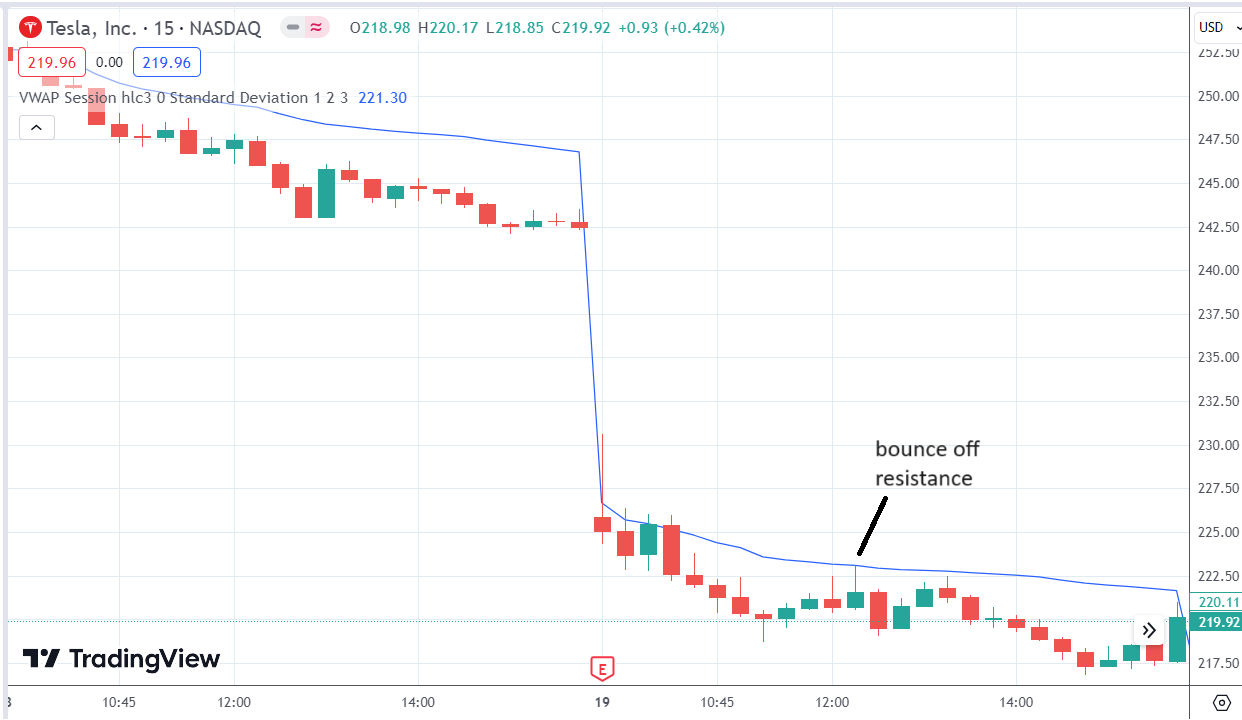
It traded below the downward-sloping VWAP.
At noon, it rallied and bounced back down after touching the VWAP, which acted as resistance.
We are seeing this on a 15-minute chart.
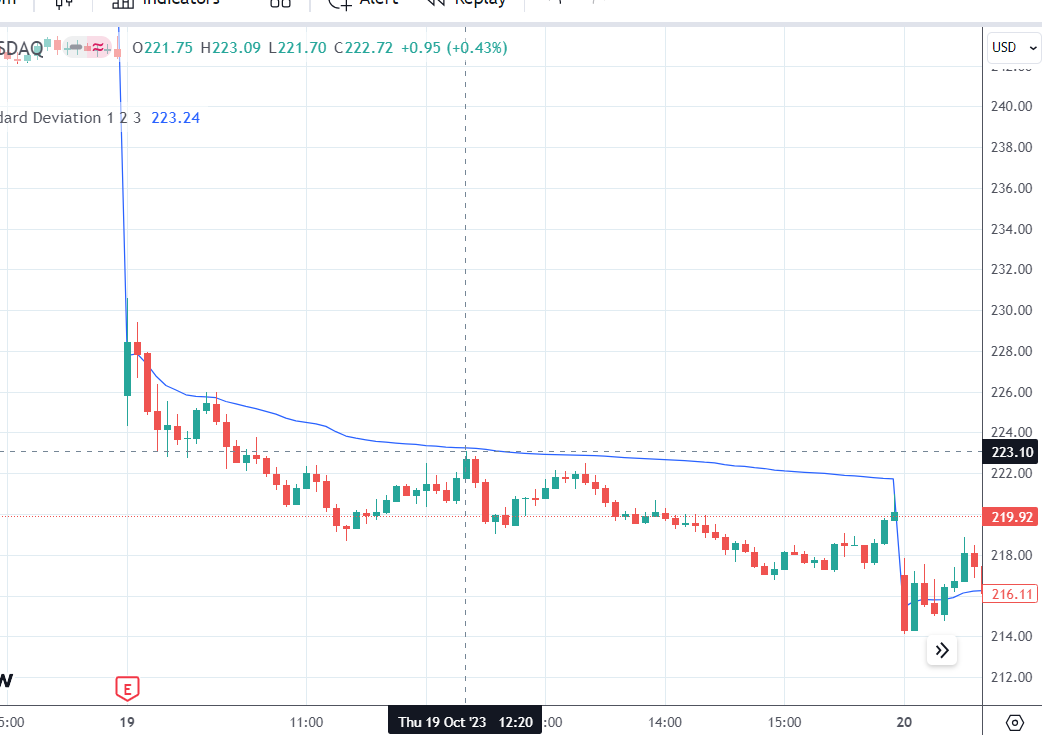
Unlike moving averages, the daily VWAP (or session VWAP) remains the same when switching timeframes.
When we switch to the 5-minute chart, we see that the price came up to the VWAP at the same time and price.
Trading With The Trend
In the last two examples, the trader was trading with the trend, which gives it greater probability of working out.
When VWAP is sloping up, they trade the bounce upwards.
When VWAP is sloping down, it is a short opportunity.
Price bounces off VWAP to resume its primary trend.
Trying to trade the bounce of a non-trending horizontal VWAP is hit or miss.
Sometimes it works, and sometimes it doesn’t.
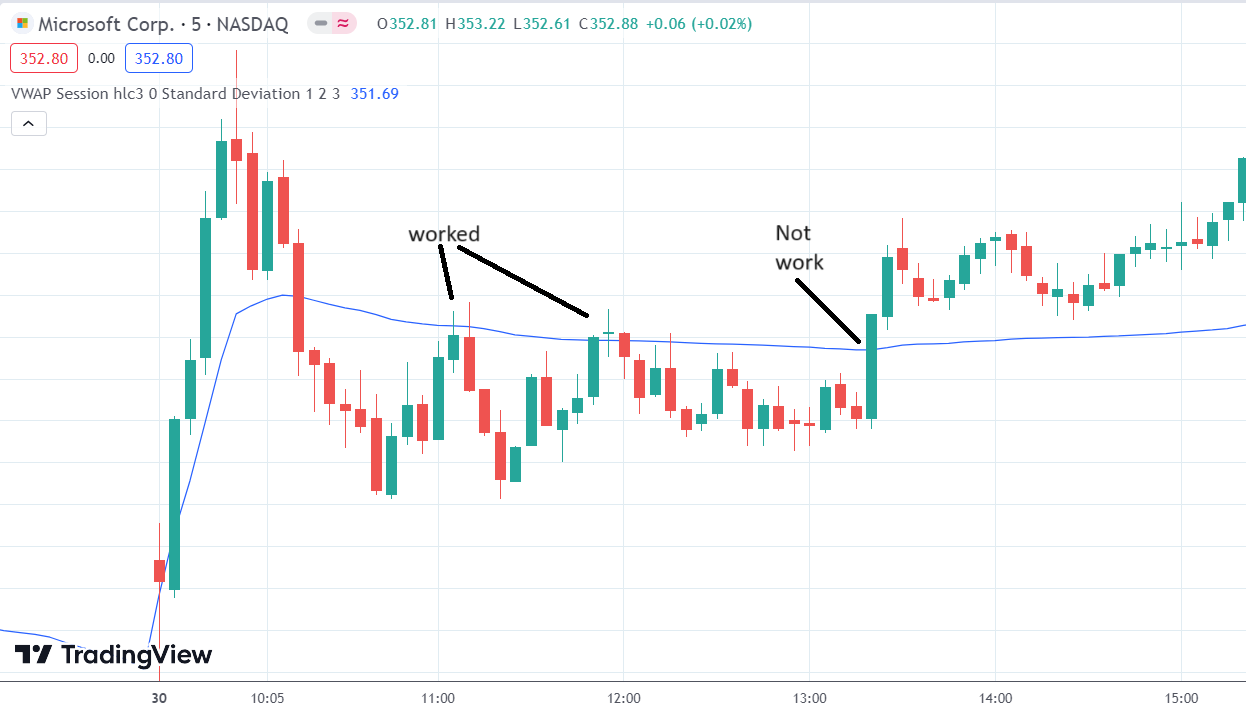
We see on this 5-minute Microsoft (MSFT) chart on October 30, 2023, that the first two attempts worked.
But the third try failed.
There was no bounce at the VWAP.
Instead, the price broke right through VWAP to the other side.
It is commonly said that support and resistance hold at first.
But when the price keeps knocking on the wall multiple times, eventually, it will break through.
After it breaks through, then resistance becomes support.
And support becomes resistance.
Frequently Asked Question
Who invented the VWAP?
It is believed to have been invented by mathematician Paul Levine.
Why is VWAP better than the moving average?
The typical moving average (such as the 50-period moving average or the 200-period moving average) does not consider volume.
The VWAP uses volume, meaning that every stock share has a vote in determining the VWAP value.
Do institutional trading algorithms use the VWAP?
Yes, a good percentage of them do.
Here is what Kenneth Griffin (CEO of Citadel) said to Congress during the February 18, 2021 GameStop hearing:
“Congresswoman, today, virtually all trades executed by institutional investors are in the form of program trades such as VWAP and other algorithm trades.”
Source: Transcript at rev.com
The information that can be found on the Internet these days is amazing.
Why is the VWAP on one charting package different from that of another charting package?
There are different ways to calculate the VWAP.
By default, TradingView uses the “high-low-close divide by 3” method, which could be changed here:
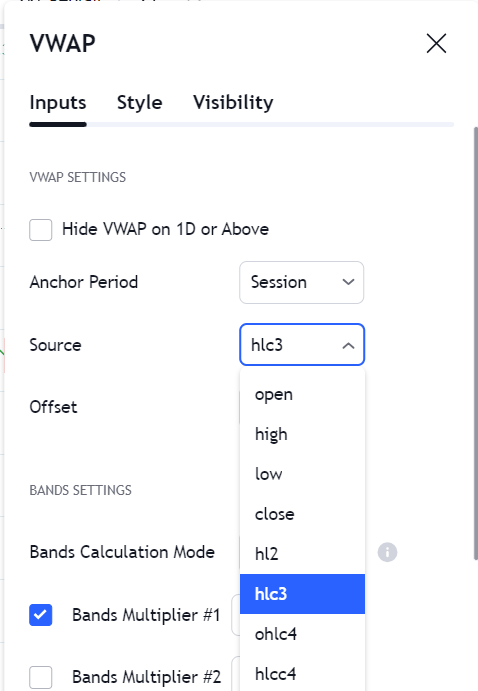
Perhaps other charting software uses the “open-high-low-close divide by 4” method.
How is VWMA different from VWAP?
Volume-weighted moving average (VWMA) fundamentally differs from volume-weighted average price (VWAP).
While VWMA does incorporate the volume of shares into its calculation, it is still more like the traditional moving average, such that the oldest data is dropped when new data comes in.
VWAP is different in that it never drops off any data once it starts picking up data from its anchor point.
It is a cumulative average price instead of a rolling average price.
Conclusion
We have seen examples of how intraday traders might use VWAP.
The next article will examine how options traders might use the longer-term anchored VWAP.
We hope you enjoyed this article on vwap.
If you have any questions, please send an email or leave a comment below.
Trade safe!
Disclaimer: The information above is for educational purposes only and should not be treated as investment advice. The strategy presented would not be suitable for investors who are not familiar with exchange traded options. Any readers interested in this strategy should do their own research and seek advice from a licensed financial adviser.


Thanks Gav. Nice review of VWAP! I like it when you send out ticklers like this.
Glad you liked it. I liked that you referred to it as a “tickler”
THANKS FOR THIS VERY GOOD INFORATION.