


Many traders live and die by the indicators they see on their charts.
One very common and potentially powerful indicator are Donchian Channels.
These channels look and function similarly to both regression channels and Bollinger bands.
In this guide, we will look to understand where Donchian Channels come from, how they are calculated, and how you can use them in your trading.
We will look at some examples of how to trade them and some potential shortcomings this powerful indicator has.
Contents
Understanding Donchian Channels
Donchian Channels are a technical indicator developed by Richard Donchian, a futures trader, in the 1970s.
These channels are designed to analyze and visualize the market trends and whether a security is trending or range-bound.
The indicator consists of the following lines: the Upper Channel, The Lower Channel, and the Midline Channel.
The Upper and Lower Channels are calculated based on the highest high and lowest low of a specified period.
The Middle Channel is the average of the Upper and Lower Channels over the last N periods.
This is also called the reversion line because it is considered the mean reversion value for the given period.
Trend Identification with the Donchian Channels
Donchian Channels are a great tool to help a trader identify a prevailing trend or lack thereof.
As the price continues to trend in a specific direction, the bands will keep adjusting in that direction.
An easier way to identify the trend using the Donchian channels is to watch the Midline.
Since this is an average of both the high and low price of the period, that will give you the average direction of the length of the bands.
Below, we will go into a few of the different trading techniques that are used with the channels.
Using the Donchian Channels
Now that we have explained the basics of Donchian Channels, it’s time to explore how to use them in trading.
Below, we will go over 3 of the more popular trading techniques.
This is far from an exhaustive list, though; similar to any indicator, the best way to use it is the way that makes you the most risk-adjusted profit.
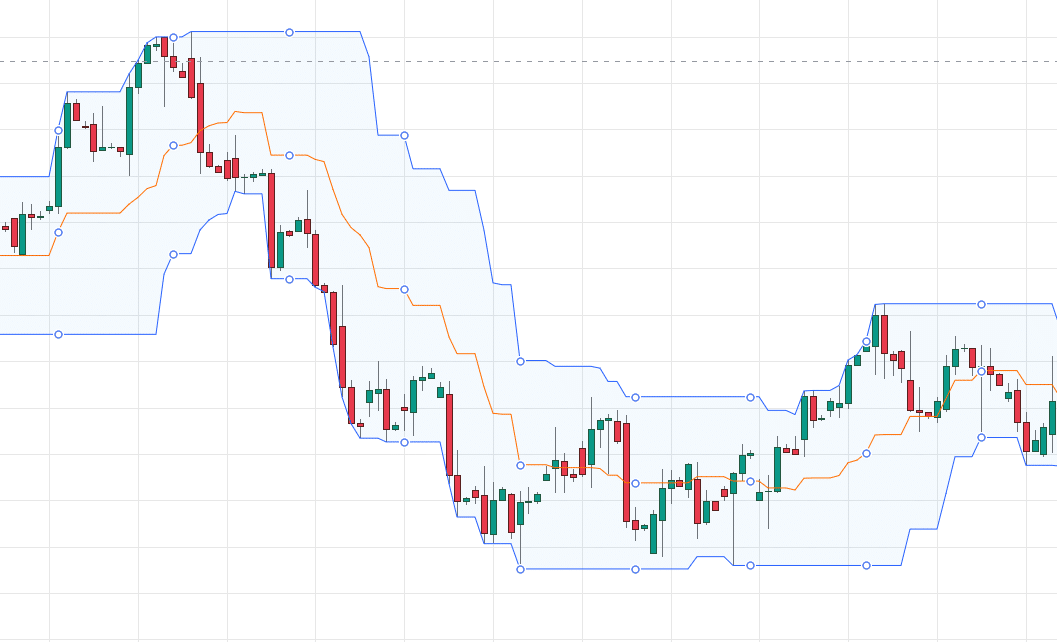
The Midline Bounce/Pullback Trade
One of the more common trades with the Donchian Channels is the Midline Bounce trade. This is a pretty simple trade, as it doesn’t matter what the prevailing trend is.
It will work with both rising and falling trends.
The first step is identifying the direction the stock/market is moving.
Once the overall direction has been identified, the trader will wait for the price to come up/down and touch the Midline in the channels.
This is called the signal bar because it signals that the trade is setting up.
The next step is to wait for the next candle to open and stay above/below the Midline, depending on direction.
The final step is to place the trade in the direction of the bounce.
Management for this trade is fairly simple: a stop loss is placed above/below the Midline following the risk management principles you trade with.
The target will be the upper/lower band, depending on direction.
It is important to mention that since this is a pullback-type strategy, it works best in trending markets. Below are a few examples from TSLA from earlier this year.
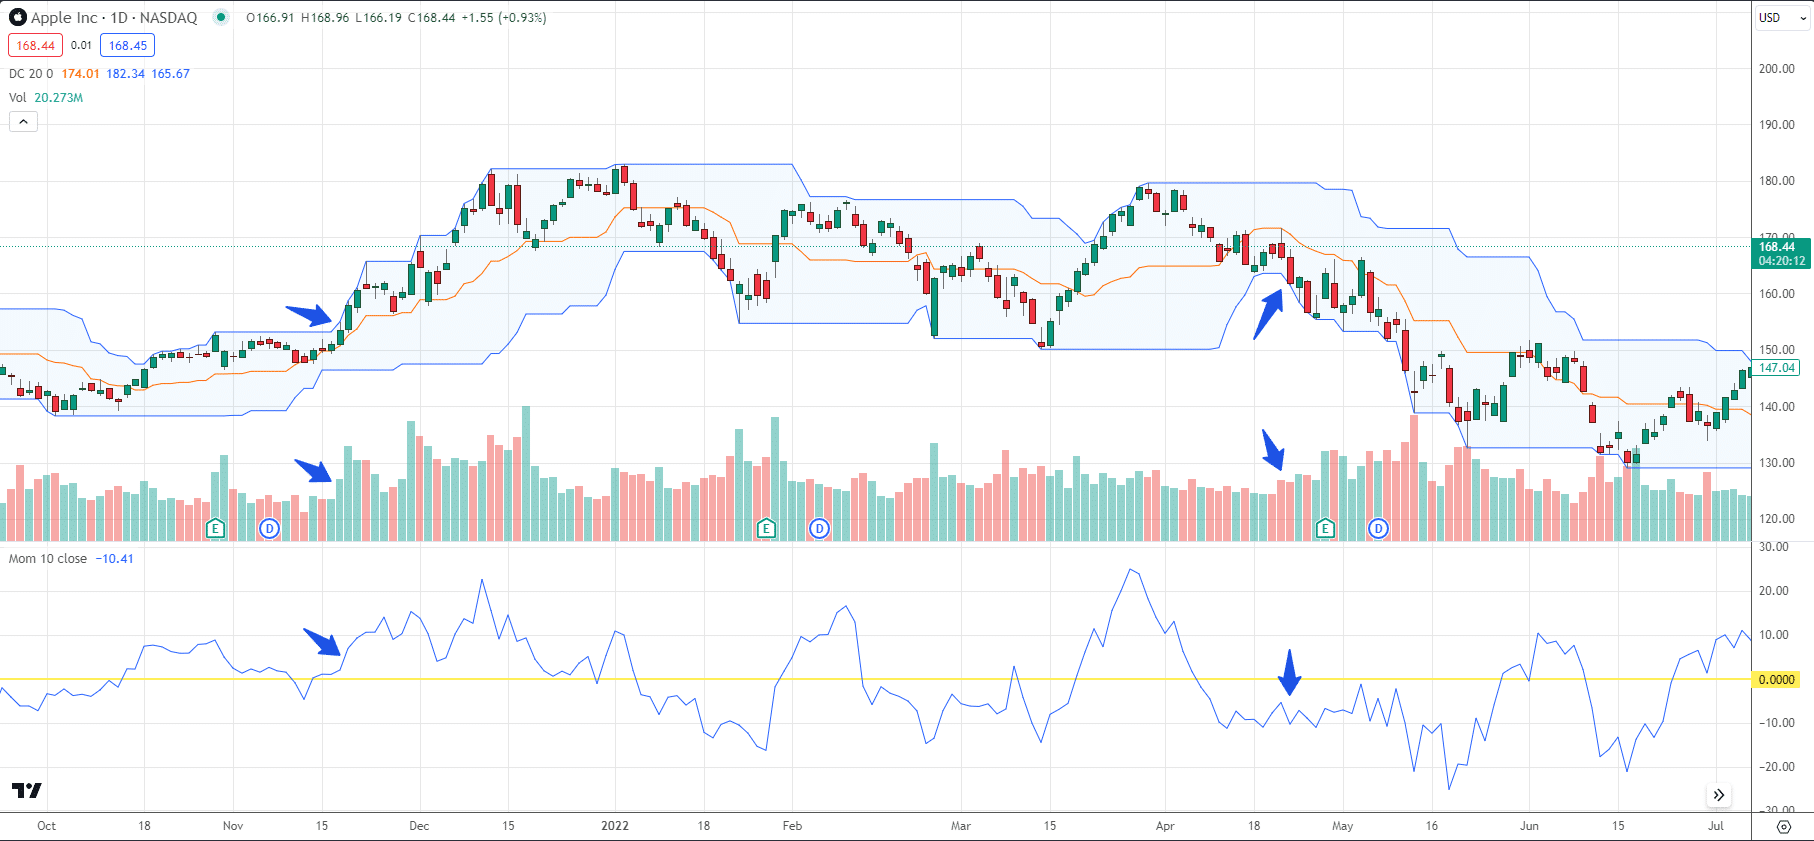
The Range Expansion/Breakout Trade
The range expansion trade, or “turtle trade,” is when a trader buys or sells a stock when it breaks the upper or lower channel.
Due to the fact that the bands adapt as the price moves, a trader is looking for a price to close above or below the prior periods, high or low.
As with all breakout trades, a confirmation signal is usually the best action before placing the trade.
Whether it is volume or another indicator, simply buying or selling based on the break of a channel may not yield the best results.
Let’s take a look at a couple of examples below on AAPL.
The first trade to the left is a breakout trade to the upside.
Price pierces the previous high, the volume higher than the previous few periods and is skewed towards the direction of the trade, and finally, the momentum indicator is positive and increasing.
Three signals, all potentially confirming a breakout.
The second example is a sell that flashed all the same signals in the opposite direction.
There was higher selling volume as the price pierced the bottom band, and the momentum indicator was negative, signaling negative momentum.
As far as risk management is concerned, that is up to the trader on a breakout trade.
Some traders use the Midline as their exit because it follows up with price, making it dynamic as the trade moves.
Others choose the fixed risk/reward ratios or a flat percentage of their account.
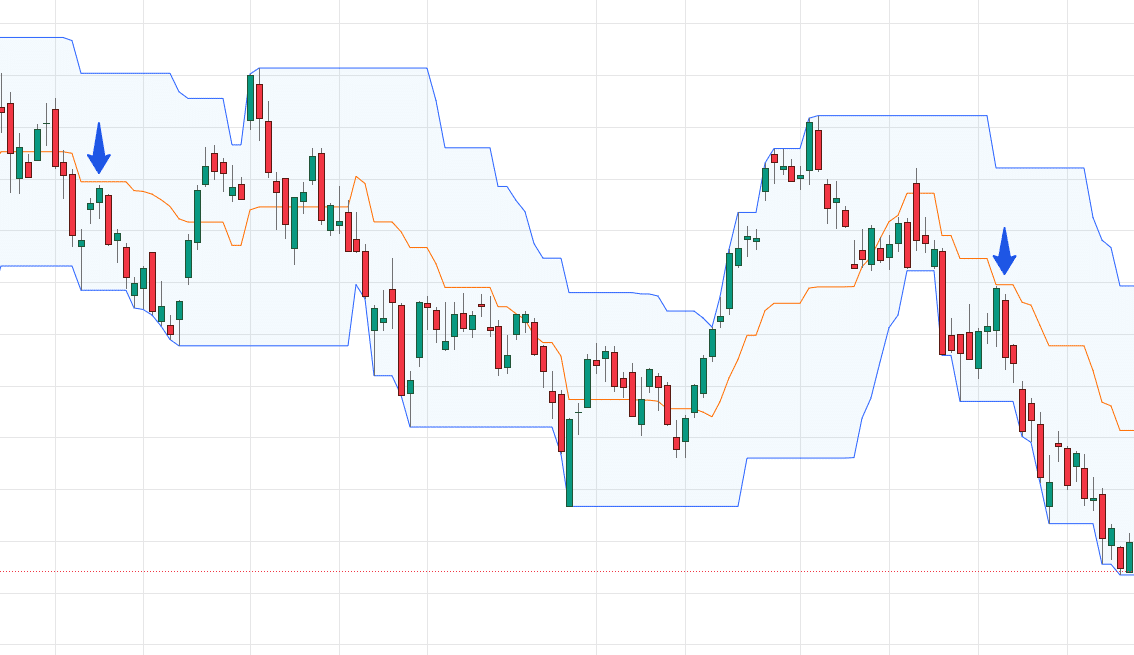
Return to the Mid Trade
The return to the mid-trade is simply a mean reversion trade. It is simple in concept but not always easy to see in real-time.
The trade is when the price bounces or pierces one of the outer channels but then quickly reverses and heads back to the Midline.
The entry on this trade would be the candle after the bounce.
There is a long example and a short example below. In the long example in mid-June, the entry would happen around the opening of that long green candle above the arrow.
The trade would have chopped around for a few days but eventually would have taken you to the Midline for a profit.
The second trade is a short in mid-August.
This is after a breakout trade; there is a Doji that pushes slightly higher, and then the small red candle would have been the entry candle on this trade.
These trades would have had relatively tight stop losses by putting them on the other side of the bands.
Optimization of the Channels
A vital part of all indicators and strategies is optimizing them to the traders’ particular style.
While many people find that the default settings work well with their trading, experimenting and backtesting some other settings may enhance their effectiveness.
Another important part of optimizing the Donchian Channels is seeing how to use them with other indicators.
There are a few examples of a momentum indicator above, but ultimately, it comes down to what fits a trader’s eye best.
Some other popular indicators you can use with the Donchian Channels are the ATR, MACD, RSI, and Volume.
Conclusion
Donchian Channels can prove to be a very powerful tool when used in conjunction with other indicators.
In this guide, we have looked at a basic understanding of how they work, how to calculate them, how traders can use them, and three basic trading strategies.
This is not all they can be used for, though other uses include daily ranges, trailing stop losses, and stock-specific volatility.
Ultimately, how they end up being used is up to the trader, but one thing is certain: the Donchian Channels should be a tool in every trader’s toolbox.
We hope you enjoyed this article on using donchian channels.
If you have any questions, please send an email or leave a comment below.
Trade safe!
Disclaimer: The information above is for educational purposes only and should not be treated as investment advice. The strategy presented would not be suitable for investors who are not familiar with exchange traded options. Any readers interested in this strategy should do their own research and seek advice from a licensed financial adviser.


