


Contents
The SKEW index is a measure of potential tail risk, or black swan event.
Hence it is also known as the “Black Swan Index”.
The higher the value, the greater the risk of such an event.
Or so the theory goes.
However, some critics have looked at historic data and found that when tail risk does exist, the SKEW index was not able to reliably predict it.
In some way, this makes sense; because by definition, a black swan event is one that is unpredictable.
Nevertheless, while not precise, its value whether high or low can tell an investor the general sentiment of the market.
A low SKEW indicates a normal calm market.
A high SKEW indicates a potentially agitated market.
It is analogous to the VIX, which measures the volatility of the S&P500.
Like the VIX, the value of the SKEW is based on the implied volatility (IV) of the S&P 500 options.
While the VIX is based on the IV of at-the-money options, the SKEW is based on the out-of-the-money options.
The SKEW is measuring the probability of S&P 500 moving 2 to 3 standard deviations in the next 30 days.
Since the time that SKEW has been tracked in 1990, its value had never gone below 100 and the highest recorded SKEW so far is 170.55 on June 25, 2021.
So, you can say that that is the range of the SKEW index is from 100 to 200.
If you go back to the charts and look at June 25, 2021, it was quite an uneventful day with the markets in a bullish uptrend.
False alarm.
Critics of the SKEW index would cite the low correlation between the SKEW and S&P 500.
Chart of the SKEW
The quickest way to get a snapshot of the SKEW index is on the CBOE website:
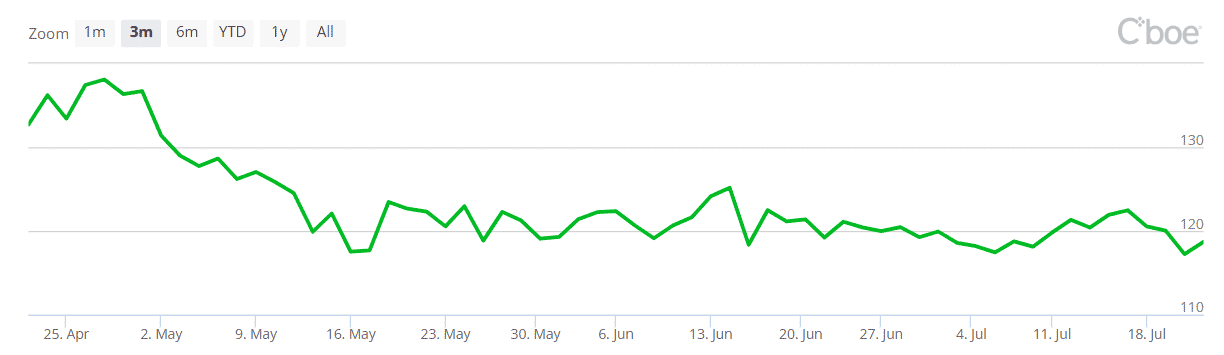
source: cboe.com
On TradingView.com and ThinkOrSwim, type in the symbol “SKEW”.
On StockCharts.com, type in the symbol “$SKEW”.
Non-normal returns
Another way to think of the SKEW index is the amount of skewness in the return distribution.
A skew of 100 means no skew; it has a normal distribution return graph.
The higher the SKEW value, the greater the non-normality of the returns.
Non-normality of returns means that the normal distribution curve is not symmetrical.
It is skewed to one side due to the put options and the call options at the same strike prices having different implied volatility.
FAQs
Can you trade options on the SKEW index?
No, there are no options on the SKEW index.
There are options on the VIX index, however.
Is VIX or SKEW more useful?
The VIX is a much more useful index and is more commonly used by investors than the SKEW index.
Conclusion
While the SKEW index can be used as a gauge of market sentiment, its use as a predictive tool is limited.
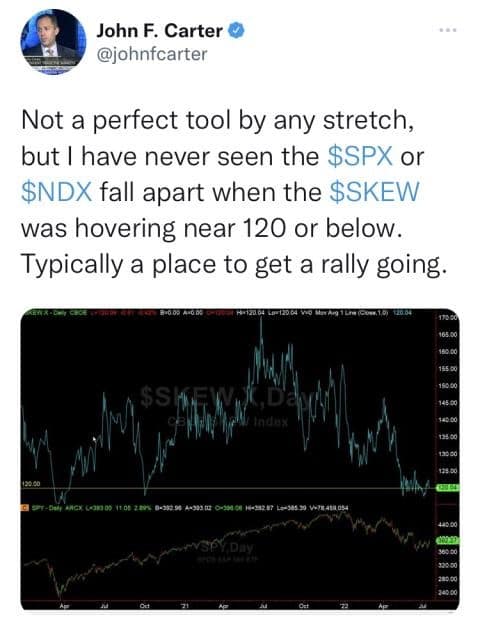
In a tweet on July 19, 2020 when the SKEW index dropped back down to 120, John Carter of SimplerTrading said…
“Not a perfect tool by any stretch, but I have never seen the $SPX or $NDX fall apart when the $SKEW was hovering near 120 or below. Typically a place to get a rally going.”
And that sums it up.
We hope you enjoyed this article on the SKEW Index.
If you have any questions, please send an email or leave a comment below.
Trade safe!
Disclaimer: The information above is for educational purposes only and should not be treated as investment advice. The strategy presented would not be suitable for investors who are not familiar with exchange traded options. Any readers interested in this strategy should do their own research and seek advice from a licensed financial adviser.


