





The Sharpe Ratio is a common metric used in quant finance to gauge how good a strategy or portfolio is doing.
In simple terms, the Sharpe Ratio measures the risk-adjusted returns.
The higher the Sharpe ratio, the better.
In more complicated terms, the Sharpe Ratio is the portfolio return minus the risk-free return divided by the standard deviation of the portfolio’s returns.
Sharpe Ratio = (return – risk free return) / (standard deviation)
The standard deviation is how much the equity curve fluctuates up and down and is a proxy for risk in the strategy.
The ratio penalizes strategies that have high volatility (large swings up and down) and gives higher scores to strategies that have a smooth return curve.
In visual terms, you can see a hypothetical return of a strategy with Sharpe of 0.5 (red line) versus that of 1.5 (green line).
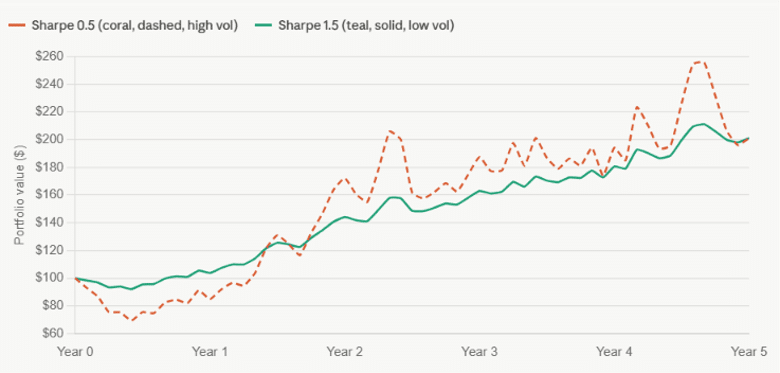
Even though both returned the same, the higher-Sharpe green line is better because it has lower volatility (and hence lower drawdowns).
This strategy is easier for an investor to hold and have higher investor confidence.
The red line is more painful to hold as the investor does not have as much confidence in the strategy when it dipped into negative P&L from the start.
More importantly, a strategy with a higher Sharpe ratio is much easier to scale to larger size.
Intuitively, we already know to allocate smaller size to strategies that have high risk and are more comfortable increasing the size for lower risk strategies.
Contents
- What Is A Good Sharpe Ratio?
- How Can We Optimize A Portfolio’s Sharpe Ratio?
- How Options Income Strategies Affect Your Sharpe Ratio
- Practical Ways To Improve Your Portfolio’s Sharpe Ratio
- FAQ
- Final Thoughts
What Is A Good Sharpe Ratio?
The Sharpe Ratio of S&P 500 over a five year period is about 0.67.
Typical hedge fund Sharpe ratio over the long term is about 1.0, with average industry-wide funds at 0.5 to 1.0, and good hedge funds around 1.0 to 1.5.
Elite top-tier hedge funds like Citadel can have Sharpe of 2.0 or more.
A strategy posting a suspiciously high Sharpe of over 3.0 over a short window deserves more scrutiny of its tail risk.
Because some strategies are notorious for showing inflated Sharpe ratios right up until an infrequent severe loss wipes out a long stretch of gains, since they collect small, steady premiums with occasional fat-tail drawdowns that standard deviation alone doesn’t fully capture.
Therefore a good Sharpe Ratio for retail investors to shoot for would be a Sharpe of 1.0 or more.
How Can We Optimize A Portfolio’s Sharpe Ratio?
One way is by diversification of strategies.
Here we see two strategies (red and green lines) each with a Sharpe ratio of about 1.0.
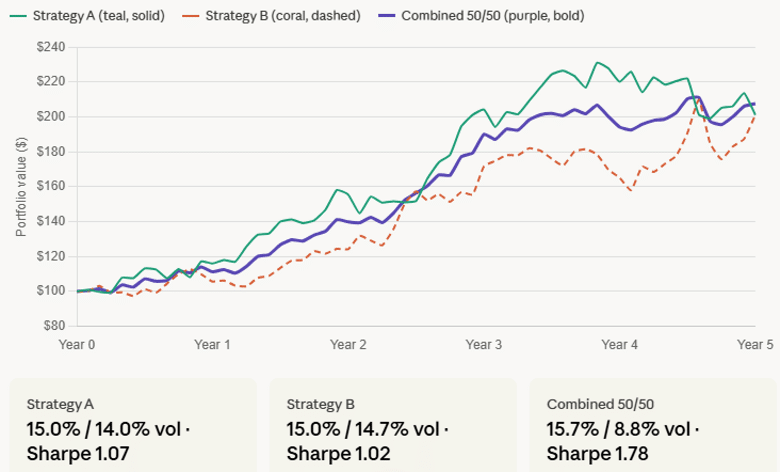
Instead of allocating the entire portfolio on one strategy, if we allocate half the portfolio to one strategy and half the portfolio into the other strategy, we typically will get a mixed portfolio with a better Sharpe ratio than either strategy alone.
Mixing two return streams that don’t move in lockstep cancels out some of each one’s idiosyncratic noise, so the combined volatility comes in well below either single strategy’s volatility.
This is why multi-strategy funds like Citadel can post Sharpe ratios well above what any single underlying strategy achieves.
Ray Dalio, founder of Bridgewater Associates, calls it the “Holy Grail of Investing,” describing how fifteen good uncorrelated return streams can dramatically reduce risk without reducing expected returns.
Bridgewater held the title of most profitable hedge fund in history by cumulative gains for years before Citadel passed it.
How Options Income Strategies Affect Your Sharpe Ratio
Options income strategies — particularly defined-risk structures like iron condors, bull put spreads, and covered calls — have a structural advantage when it comes to Sharpe Ratio: they generate income in a relatively smooth, consistent fashion that keeps the equity curve stable.
A well-managed iron condor portfolio, for example, generates small, regular premium income with occasional managed losses.
This smooth return profile — low volatility relative to the returns generated — is exactly the characteristic that Sharpe Ratio rewards.
Contrast this with a long options strategy: buying calls or puts typically produces a lumpy, volatile equity curve with many small losses and occasional large wins.
The same expected return could produce a dramatically lower Sharpe Ratio simply because of the higher return volatility.
This is one of the structural reasons why short-premium income trading appeals to systematic traders who care about risk-adjusted returns rather than just raw P&L.
The caveat: strategies that collect small, consistent premiums with occasional fat-tail losses can post artificially inflated Sharpe Ratios — as mentioned above. An unmanaged naked short options strategy might show a Sharpe of 2.0 for years before a single volatile event wipes out the gains. This is why defined-risk structures are critical — they cap the maximum loss and prevent the tail-risk event that would otherwise destroy the Sharpe calculation retrospectively.
Practical Ways To Improve Your Portfolio’s Sharpe Ratio
Beyond diversifying across uncorrelated strategies, there are several practical levers options traders can pull:
Trade defined-risk structures. Replacing naked short options with spreads caps the maximum loss on any single trade, reducing the standard deviation of returns over time. A bull put spread that loses $500 maximum contributes less volatility to the equity curve than a naked put that could theoretically lose $10,000.
Size positions consistently. Erratic position sizing — trading too large when confident, too small when uncertain — introduces unnecessary volatility to the equity curve. Consistent percentage-based position sizing (risking the same percentage of portfolio per trade) is one of the most direct ways to smooth returns and improve Sharpe.
Diversify across underlyings. Running iron condors on AAPL, AMZN, and GOOGL simultaneously produces a smoother combined P&L than running all capital in a single condor on one underlying. Each name has its own idiosyncratic risk — company-specific events, earnings surprises, sector rotation — and diversification across names reduces the impact of any single event.
Combine strategies with different volatility profiles. As Ray Dalio’s “Holy Grail” principle illustrates, combining uncorrelated strategies reduces portfolio volatility without reducing expected return. An iron condor portfolio combined with a calendar spread portfolio, for example, mixes negative vega exposure (condors) with positive vega exposure (calendars) — reducing the impact of volatility moves on the combined portfolio.
Use the Sharpe Ratio as a position filter. When reviewing past trades, calculate the Sharpe Ratio of each strategy separately. Strategies or underlyings that have consistently lower Sharpe Ratios — even if they have good raw returns — may not be worth including if they introduce disproportionate volatility to the overall portfolio.
Want to Build a Portfolio Optimised for Risk-Adjusted Returns?
The systematic income strategies taught in Options Income Mastery — iron condors, credit spreads, the wheel, and calendars — are designed to produce smooth, consistent returns that maximise risk-adjusted performance.
The course covers position sizing, strategy diversification, and exactly how to combine strategies for a better overall equity curve.
FAQ
What Is A Good Sharpe Ratio For An Options Trading Portfolio?
For a retail options trading portfolio, targeting a Sharpe Ratio of 1.0 or above is a reasonable goal.
The S&P 500 itself averages approximately 0.67 over five-year periods, so a Sharpe above 1.0 means you’re generating better risk-adjusted returns than simply holding the index.
Well-managed short-premium income portfolios often achieve Sharpe Ratios in the 1.0–1.5 range when combined with consistent position sizing and defined-risk structures.
Why Do Short-Premium Strategies Show High Sharpe Ratios?
Short-premium strategies — selling iron condors, credit spreads, and covered calls — generate consistent, relatively smooth returns that keep the equity curve stable.
Sharpe Ratio rewards low-volatility return streams, and the steady premium income of a well-managed options portfolio produces exactly that.
The caveat is that strategies with fat-tail risks (such as naked short options) can show artificially inflated Sharpe Ratios right up until a large drawdown event occurs.
How Is Sharpe Ratio Different From Sortino Ratio?
The Sharpe Ratio penalises all volatility — both upside and downside — in its standard deviation calculation.
The Sortino Ratio only penalises downside volatility.
For options income traders whose strategies occasionally produce months of higher-than-expected returns (upside volatility), the Sortino Ratio often gives a more accurate picture of risk-adjusted performance because it doesn’t treat good months as a negative.
Can Diversifying Across Options Strategies Improve My Sharpe Ratio?
Yes — combining strategies with different volatility profiles and low correlation to each other reduces the standard deviation of combined returns without necessarily reducing the expected return.
Iron condors and calendar spreads, for example, have opposite vega exposures (condors are short vega, calendars are long vega) — combining them in a portfolio smooths out the impact of volatility moves and improves the overall Sharpe Ratio relative to running either strategy alone.
Does Position Sizing Affect Sharpe Ratio?
Yes, significantly.
Erratic position sizing — trading too large in some periods and too small in others — introduces unnecessary volatility to the equity curve and lowers the Sharpe Ratio even if the underlying strategy has good expected value.
Consistent percentage-based position sizing is one of the most direct ways to improve Sharpe without changing your strategy at all.
Final Thoughts
While a strategy should not be judged by its Sharpe Ratio alone, the ratio attempts to quantify the quality of a strategy by accounting for the risk that is taken in order to achieve a particular return.
Other metrics that account for strategy risk are:
Sortino ratio – which only penalizes downside volatility (and not upside volatility)
Calmar ratio – which compares return to max drawdown.
Those are topics for readers interested in exploring further on their own.
The Sharpe Ratio and Sortino Ratio derived their names from the people who introduced them: William Sharpe and Frank Sortino.
Calmar is not a person’s name, but rather an acronym for CALifornia Managed Accounts Reports, the newsletter/company associated with Terry W. Young, who introduced the ratio in 1991.
The Sortino Ratio is particularly worth exploring for options income traders — because it only penalises downside volatility, it often gives a more favourable and arguably more accurate picture of short-premium strategies where upside volatility (a position performing better than expected) is not actually a risk.
We will cover both ratios in a future article.”
We hope you enjoyed this article on optimizing the Sharpe Ratio of your portfolio.
If you have any questions, please send an email or leave a comment below.
Trade safe!
Disclaimer: The information above is for educational purposes only and should not be treated as investment advice. The strategy presented would not be suitable for investors who are not familiar with exchange traded options. Any readers interested in this strategy should do their own research and seek advice from a licensed financial adviser.