


Options Play Review: OptionsPlay is a trading platform, trade signal service, and education provider, packaged into one monthly subscription price with no commitment or contract.
Alternatively, you can opt for the annual membership package, which is slightly discounted.
They provide new members with a 30-day free trial that provides full access to all the features without any need to provide payment information.
The platform is a web-based app, so there is nothing to download.
Just log in at optionsplay.com.
Contents
- Trading Platform
- DailyPlays Trading Signals
- Strategy Analyzer and OptionsPlay Score
- Education Provider
- FAQs
- Conclusion
Trading Platform
For a good four-minute overview of the trading platform, watch the publicly available YouTube video; however, the video was created back in 2015.
The platform has improved since then, so the 2022 platform preview video is available, which is one hour long.
Both videos are presented by Tony Zhang, the Chief Strategist at OptionsPlay, who can often be seen on CNBC presenting trade ideas and commentaries to the public.
Central to the platform is a charting software that has a rich set of features.
You can even expand the chart to full view mode.
Here are some of the chart types that it can render:
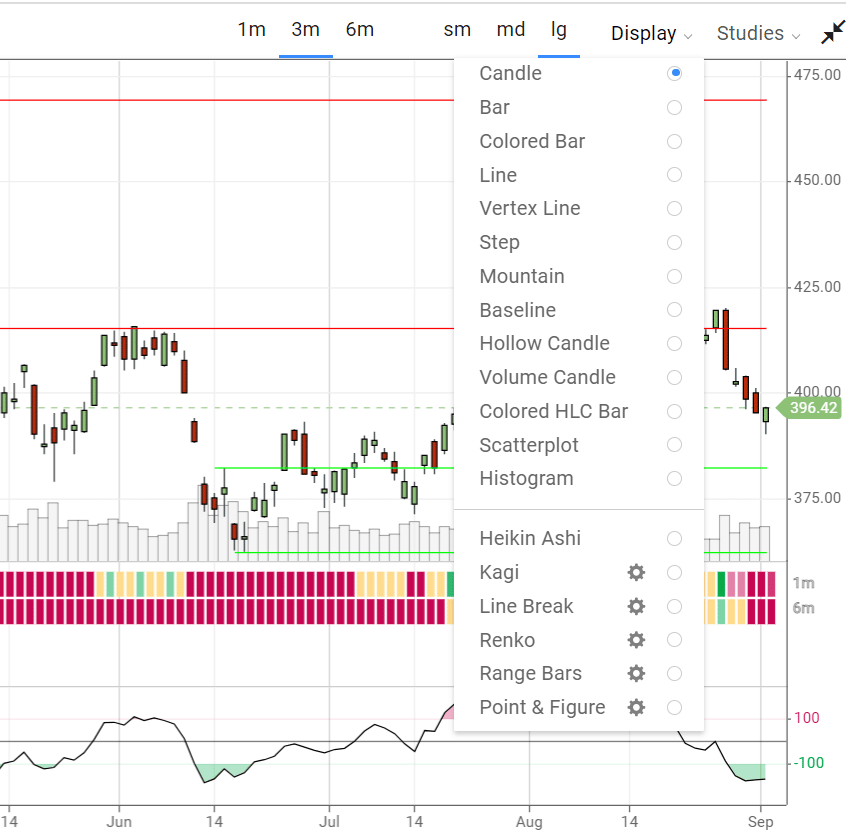
source: optionsplay.com
If you want a Heikin Ashi chart, you got it. I don’t know anyone using Point and Figure, but if you are, it is there.
There are over 100 indicators (known as “studies”) that you can lay on top of the chart.
All the common indicators are there, some less common, such as the Supertrend indicator, and some that I’ve never heard of, such as the Gopalakrishnan Range Indicator.
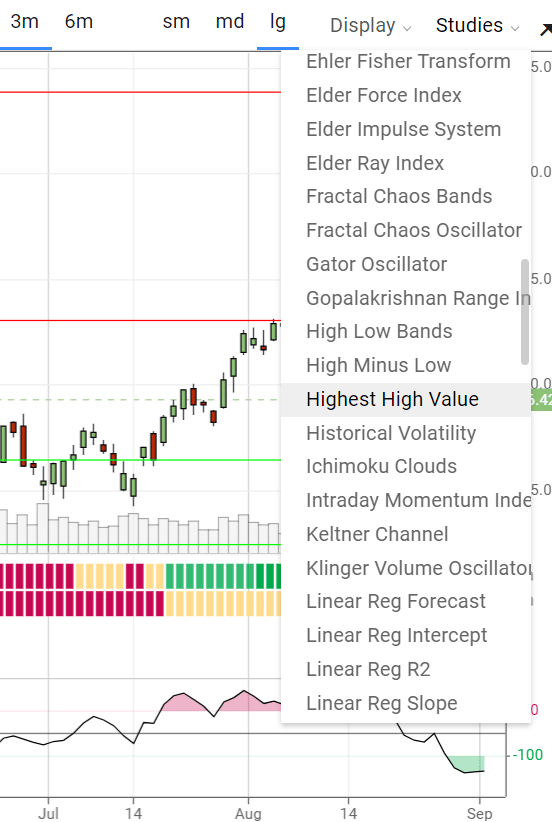
source: optionsplay.com
Some investors pay money to have volume profiler software.
OptionsPlay has a very basic version of that as a study, which looks like this:
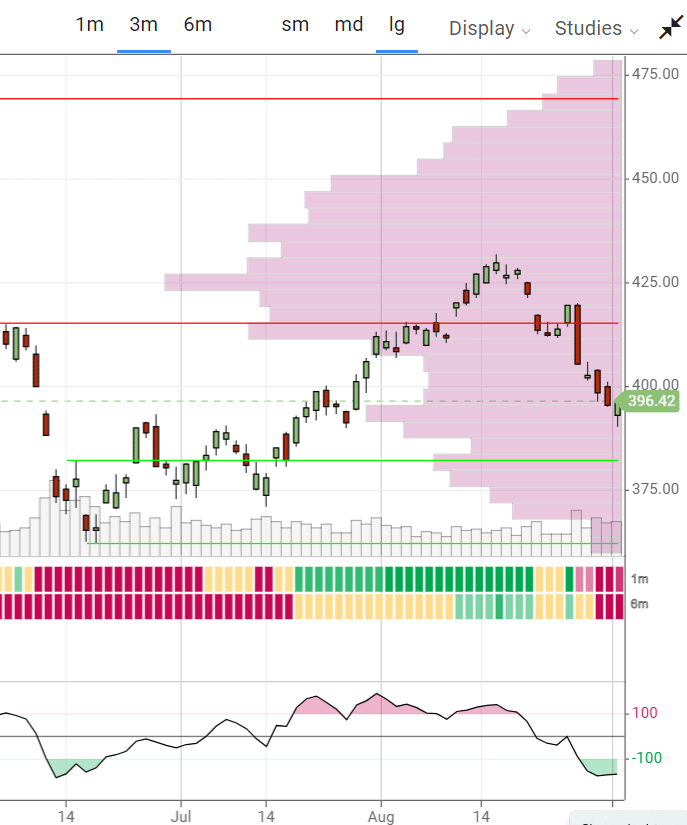
source: optionsplay.com
It does not have all the features of a true volume profiler — no point of control and the other fine-grained details.
So it will not work for true volume profiler traders.
Also, the charting will not work for intraday traders as there are no intraday charts — only the daily, weekly, and monthly charts are available.
In the above screenshot, you might wonder what those two horizontal red lines drawn across the chart are.
Software Generated Trendlines
They are automatic software-generated resistance lines.
If they were colored green, then they would be support lines.
The colored bars below the chart are the one-month (indicated by “1m” on the right axis) and 6-month trend indicators. Green means a bullish trend.
Red means a bearish trend, and yellow means neutral.
On the left panel is a software generated scans of trade ideas.
The list quickly shows you whether the stock is bullish or bearish and its relative strength score.
You can also quickly see the liquidity and IV rank on the list.
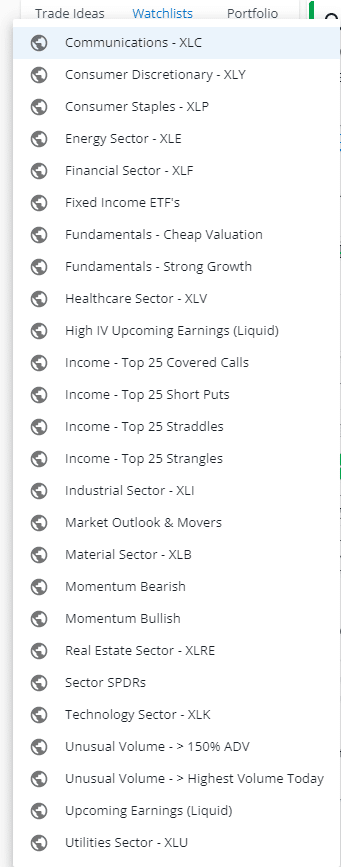
In the watchlists tab, you can have it scan for bullish/bearish momentum, strong growth fundamentals, top 25 short-put income trades, upcoming earnings, various sectors, etc.
DailyPlays Trading Signals
Automated scans may be good.
But what some traders find more interesting are the DailyPlays, which are analysts’ hand-picked trade signals (although there may not be a trade every day).
The trade signals for opening and closing a trade come in the form of an email sent to members before the market opens.
It contains the option strikes, expiry, and the number of contracts, along with an analysis with a chart explaining the reason for the trade.
Depending on your portfolio size, you need not do the same number of contracts as indicated.
OptionsPlays videos suggest that a trade’s max loss should not be more than 2% of the portfolio size.
The signal provides the maximum risk and reward of each trade, so you can easily size it appropriately for your portfolio.
The trade signals are typically directional vertical credit and debit spreads.
Another way to access the DailyPlays is via the popup window when you log into the platform with a link to the DailyPlays page (which you can just bookmark).
Trade Signals
On that page, you will see the past history of opening and closing signals of previous trades.
These are called trade signals rather than trade alerts because you will not be given text alerts in real-time as the trade happens.
The trades are not short-term intraday trades, so that is not necessary.
It is probably sufficient if you put in the trade within the same day.
The signals are based on the previous day’s closing price, and if the market gaps on the open, they say they will probably adjust the strikes and prices to reflect a more accurate trade entry.
This trade entry will then be reflected in the Portfolio tab of the OptionsPlay platform, where the currently open DailyPlays are tracked.
Many of these signals and trade ideas come from Rick Bensignor, who joined OptionsPlay in early 2022.
He was a former Morgan Stanley Chief Market Strategist, and he trades primarily from technicals but does consider macro views.
His style is a bit contrarian.
His technical analysis uses the DeMark indicators in conjunction with the Ichimoku Cloud to find counter-trend trades.
The DeMark indicators are proprietary indicators developed by Tom DeMark, which are available by paid subscription at symbolik.com or other DeMark service partners.
That’s why you will not be able to bring up the DeMark indicator in the OptionsPlay platform nor in others charting packages.
For this reason, the DeMark indicators are typically used by institutions rather than retail traders.
Strategy Analyzer and OptionsPlay Score
On the right panel of the OptionsPlay platform are a trade analyzer and P&L simulator where you can analyze various strategies of the ticker symbol that you’ve just entered.
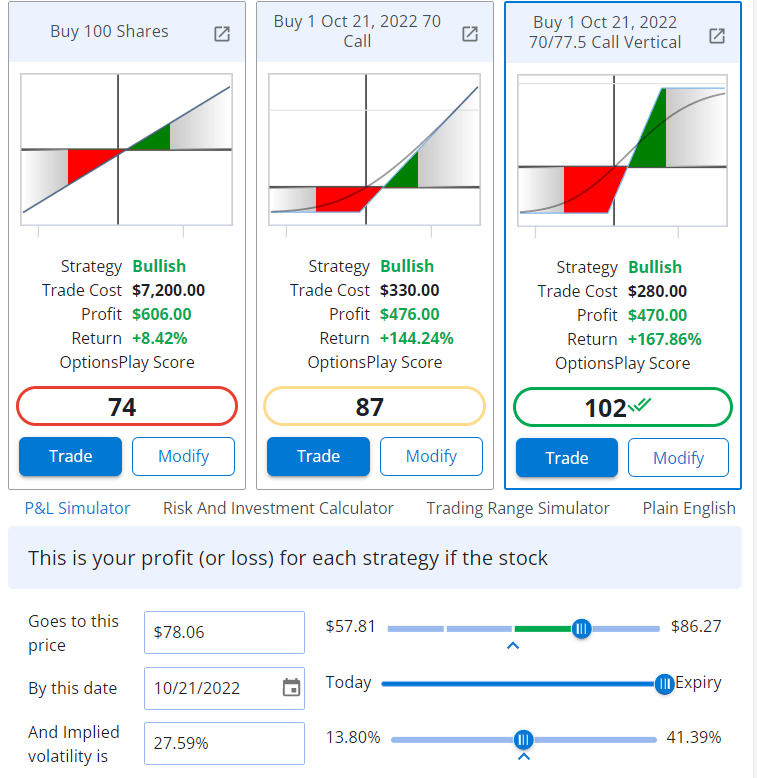
There it will provide an OptionsPlay score for the strategies.
This is a calculated score based on the risk-to-reward ratio of the strategies in combination with the probability of profit.
When the score is circled in green means that the algorithm thinks it is a good trade.
A score in yellow means there is no particular edge and that if you do the trade many times, you will probably be at breakeven.
A score circled in red means that the trade either has an extremely low probability or its risk-to-reward is extremely poor.
Although a high probability trade will indeed have a less favorable risk-to-reward ratio and vice versa, you don’t want a trade on either extreme of the spectrum.
You need to balance risk-to-reward with probability.
The OptionsPlay score indicates how well this is balanced.
Education Provider
There are various member-only weekly webinars on macro views, market outlook, and other options educational resources.
The OptionsPlay Hub is where you find links to the DailyPlays and the Market Insights.
There are links to various reports such as:
- Daily Liquidity & IV Rankings
- Earnings Calendar
- Unusual Volume Report
- Credit Spread Opportunity Report
- Covered Call Report
- Short Put Report
- ATM Straddle Income Report
(The “ATM Straddle” stands for at-the-money straddle and doesn’t mean “Automatic Teller Machine” spitting out money.)
With all these reports, there will not be a lack of trade ideas.
There you will also find six videos in the Options 101 course.
FAQs
Does OptionsPlay have a mobile app?
Yes, it does for both iOS and Android
Are the stock prices in OptionsPlay real-time?
No, they are not real-time prices. However, they said they are working on getting those for the future.
As of this writing, all stock and options prices are delayed market data by 20 minutes.
What if I’m not comfortable trading counter-trend?
We believe that you should trade strategies that you feel comfortable with.
Perhaps you were trained to trade only with the trend, or perhaps your trading style is momentum or trend following.
If the word counter-trend may not sound like a strategy that appeals to you, there is nothing wrong with that.
However, the word counter-trend can mean many different things.
On one end of the spectrum, it may mean buying a stock that is crashing.
On the other end of the spectrum, a counter-trend may just mean buying on a pullback because a pullback is a small counter-trend that you are getting into to ride the longer-term dominant trend.
To determine what they exactly mean by counter-trend and to see whether it gels with your personal style of trading, you can look at the past history of DailyPlays signals.
Backtest them. Trade the new signals on paper or small size to get a feel for them.
Is following the trade signals during the free 30-day trial enough to determine if the signals are profitable?
Since some trades can take a month to play out, you will not get enough completed trades in 30 days to determine if their strategy is profitable.
You need at least 20 completed trades and preferably 100 trades to get a statistically significant sample size to determine the profitability of a strategy.
To get that large sample, we recommend you go through the logs of past signals you have access to during the free trial.
Is counter-trend trading a good strategy?
It can be if it is done correctly and with solid risk management in place.
And it appears that Rick, with 40 years of trading experience, can do it correctly.
To see his experience and track record, you can read the OptionsPlay blog.
That being said, it’s challenging to implement counter-trend strategies correctly because it is difficult to pick tops and bottoms.
It can be quite risky if not done correctly or without a good strategy or analysis.
That is why many do not advise beginning traders to do counter-trend trades themselves, with maxims such as “always trade with the trend,” “don’t catch a falling knife,” and “you can not time the market.”
But there is nothing wrong with following counter-trend trade signals of an expert specialist in these strategies, especially if you have backtested some of the previous signals and feel comfortable with them.
What are some of the benefits of counter-trend trading?
When counter-trend trading is done correctly, one can get into the move earlier and capture much more of the move than trend-following.
Most trend-followers get in when the trend is already obvious because the indicators are lagging.
This could cause them to leave perhaps 15% of the move on the table.
And because signals to get out are also lagging, they give back a little at the top.
By getting in just around the time when the price is reversing, you can have smaller stops, and your wins capture a greater portion of the move.
This gives the counter-trend trader a higher reward-to-risk ratio.
But that involves being able to time the market.
Rick mentions that it is possible to time the market and aims for a two-to-one or a three-to-one reward-to-risk ratio in the trades.
As a simplified model, you can think of trend-following as buying high and selling higher. Counter-trend is buying low and selling high.
Conclusion
Tony and Rick are reputable names in the options space, and I like the transparency of the OptionsPlay team.
Even on their public YouTube channel, they explain their strategy behind the OptionsPlays trade signals and put out many educational videos on options investing.
They provide full access to their platform for 30-day without needing any credit card information.
By doing so, they are exposing their entire trade signal logs for the past year.
Anyone can see the trades’ style and compute their performance.
While some of you may be tempted to forgo the OptionsPlay subscription and try to use the DeMark indicator and Ichimoku Cloud as Rick does, it is not that simple.
The money that you would have spent to get access to the DeMark indicator would have been better spent paying for the OptionsPlay membership.
The analysis from years of experience working with the DeMark model and Ichimoku Cloud makes the OptionsPlay membership worth it.
You can not expect to have a profitable strategy simply by looking for 9’s and 13’s generated by the DeMark model.
As Rick mentions, it takes years to learn this.
While the Ichimoku cloud is not commonly used in the West, it is a perfectly fine indicator, as we have written about it in the past.
However, it does take some experience to learn to read it.
Why not leverage the experience of the OptionsPlay team?
We hope you enjoyed this Options Play Review.
If you have any questions, please send an email or leave a comment below.
Trade safe!
Disclaimer: The information above is for educational purposes only and should not be treated as investment advice. The strategy presented would not be suitable for investors who are not familiar with exchange traded options. Any readers interested in this strategy should do their own research and seek advice from a licensed financial adviser.


Great review – thank you!!!
I asked for a refund and havnt received one. I dont even used this platform and want a refund. But no reply from many requests.
Sorry to hear that, but thanks for letting others know about your experience with OptionsPlay. That is terrible if they are not honoring refund requests.
I’m not sure why you are expecting a refund. From what I can see on their site, it says: “we do not offer any refunds”.